Python Tool for APT Mass Statistics

Project description
APT Stats 


A python package to calculate the probability of ions in Atomic Probe Tomography results and correlate with DA values.
Global purpose
The objective of this package is to give statistical probability of having a given ion in an Atomic Probe Tomography mass diagram based on both the abundance of each element in the material and the natural abundance. The package provide selecting and displaying tools in order to help the user.
Lastest version
A new "impurities", keyword has been added to the material definition. This way, impurities can be introduced in the material calculation :
impurities=('Ar','Ne')
Therefore, during calculation of the whole possibilities or for a specific mass to charge ratio, impurities can be displayed. Warning has to be made that the probability levels for impurities are normalized to 1 and are not acknowledgeable as a real probability as no probability value is imputed.
Installation
Dependencies
- matplotlib
- numpy
- mendeleev > 0.4
- tableprint
PIP
pip install apt-stats
Usage
Defining the material
import APT_stats as apt
#Defining a 6061 aluminum alloy using weight percentages
al_6061=apt.material({'Mg':0.0085,
                      'Si':0.0048,
                      'Fe':0.0005,
                      'Cu':0.003,
                      'Cr':0.003,
                      'Mn':0.0008,
                      'Zn':0.0005,
                      'Al':0.9789},impurities=('Ar',),wt=True)
Combination calculation
#Setting the maxiumum multiple ions combinations and lowest acceptable probability
depth=3
low=1E-7
#Calculation
res=apt.calc(al_6061,depth,low)
#Adding charges to the calculation, considering three charges as maximum possibility
res=apt.charge_calculation(res,(1,3))
Navigating through the results
#Saving results
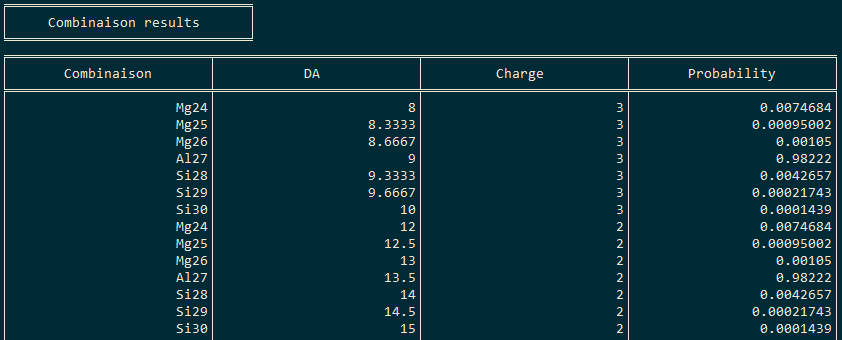
apt.save_results(res,'res.txt')
#Global displaying without impurities
apt.disp_results(res,imp=False)
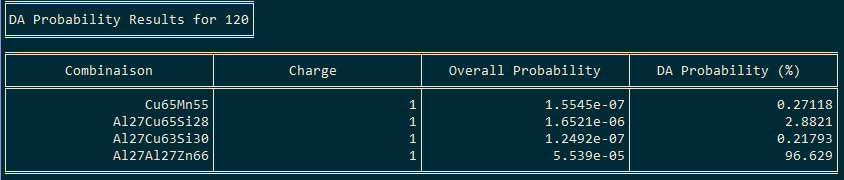
#Display probabilities for DA=120
apt.disp_select(res,120)
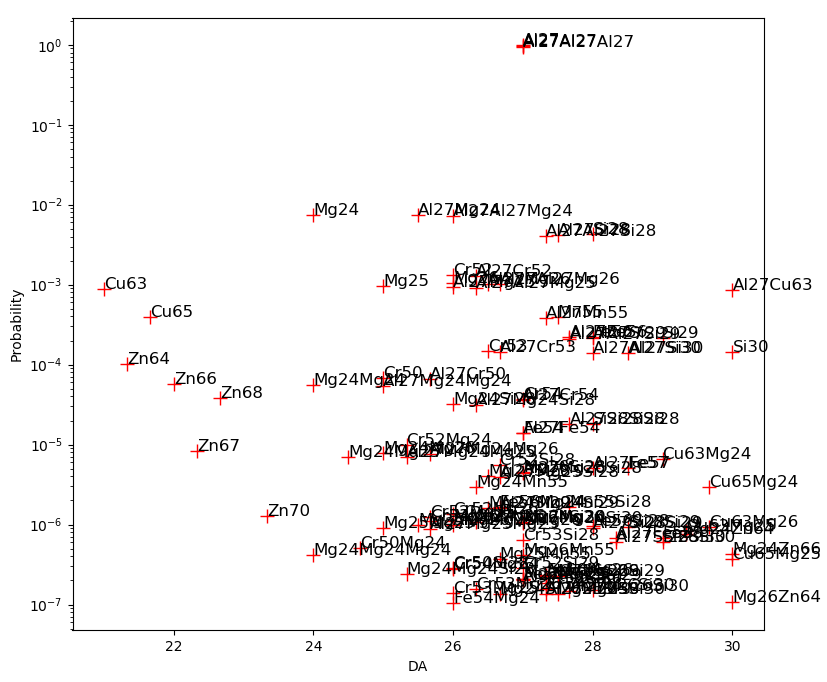
#Graphical display arround 20<DA<30
apt.plot_results(res,(20,30))
Warning !
This package is highly experimental. No warranty is given. The user should be using it as its own risk.
Release history Release notifications | RSS feed


Download files
Download the file for your platform. If you're not sure which to choose, learn more about installing packages.
Source Distribution
Built Distribution
Filter files by name, interpreter, ABI, and platform.
If you're not sure about the file name format, learn more about wheel file names.
Copy a direct link to the current filters
File details
Details for the file APT_stats-0.0.4.tar.gz.
File metadata
- Download URL: APT_stats-0.0.4.tar.gz
- Upload date:
- Size: 4.5 kB
- Tags: Source
- Uploaded using Trusted Publishing? No
- Uploaded via: twine/3.1.1 pkginfo/1.5.0.1 requests/2.22.0 setuptools/42.0.2 requests-toolbelt/0.9.1 tqdm/4.36.1 CPython/3.6.9
File hashes
| Algorithm | Hash digest | |
|---|---|---|
| SHA256 |
07428349f2dc2c5fe38e05afb421fe59a0a2aa454cb28100986fa5c79b9e1346
|
|
| MD5 |
d0aa37df0db74903a3bc0259f1e83eab
|
|
| BLAKE2b-256 |
4d2a55074fc8c6b3332d4d954f83449be3afa8899dbeff457a533db741a76b89
|
File details
Details for the file APT_stats-0.0.4-py3-none-any.whl.
File metadata
- Download URL: APT_stats-0.0.4-py3-none-any.whl
- Upload date:
- Size: 17.5 kB
- Tags: Python 3
- Uploaded using Trusted Publishing? No
- Uploaded via: twine/3.1.1 pkginfo/1.5.0.1 requests/2.22.0 setuptools/42.0.2 requests-toolbelt/0.9.1 tqdm/4.36.1 CPython/3.6.9
File hashes
| Algorithm | Hash digest | |
|---|---|---|
| SHA256 |
7419c4593d088dfa7b18fb9312f00d5650216480464a88770ea732d703238a5f
|
|
| MD5 |
bc1e86ad76f9d52939468608fd8e53ee
|
|
| BLAKE2b-256 |
0d091c7f1f49f564ffd3e3facc9d6567dd1e6b9b88442bd70ca17d517d8d517e
|


