Data Science enabled Data extraction and control library for Arduino with accurate Data Visualizations !.

Project description
Arduino_Master_Delta Version 1.0
What's the difference between Alpha and Delta Versions ?
>>> Alpha version provides easier but approximate interface for data extraction and Visualization (Since X values are automatically generated and fit enables only approximation of the data plotting).
>>> Delta version of Arduino_Master is designed to deliver accurate visualization and hence a bit more complex than Alpha versions.
>>> To ease using of functions, Delta version uses a specific type of input called hybrid to represent both the X and Y values of a given plot with just one variable.
>>> Default plotting style is 'dark_background' unlike 'ggplot' of Alpha.
>>> Link to Arduino_Master (Alpha Version) Arduino_Master_Alpha
What's New in 1.0 ?
>>> Bugs related to readSerial, writeSerial and dynamicSerial fixed.
>>> farFrom and minDeviation parameters added to filter function.
>>> Bugs in filter function that prevented the use of farFrom, closeTo, maxDeviation and minDeviation parameters together rectified.
>>> compress() function updated to work with hybrids too !!
Intro:
Embedded C is used to program microcontrollers like Arduino. However embedded C could never compete with Python's simplicity and functionality. Also Arduino being a microcontroller, we get a lot of garbage values which we require to filter before utilizing. This module eases the process of extracting and passing data to Arduino via Serial communication.
This Module also provides Easy and flexible Data Science functions for Data extraction, filtering, removing garbage values and Data Visualization !
Installing via pip:
Use the following command to install Arduino_Master using pip.
pip install Arduino_Master_Delta
Automatic Installation of other required Modules:
This module requires two more packages namely pyserial and matplotlib. Yet just by importing this module using the import statement or by using any function, unavailable modules will be installed and imported automatically. Make sure you have good internet connection and if still you get ModuleNotFound error, try installing these two modules manually via pip.
Importing Functions:
from Arduino_Master_Delta import * statement is used to import all available functions from Arduino_Master. This version contains the following functions which we'll be discussing shortly. These functions can be grouped into 2 categories:
>> For Extracting and Writing data to Arduino:
$ ardata
$ readSerial
$ writeSerial
$ dynamicSerial
>> Data Science enabled functions for filtering and visualizing Data:
$ hybridize
$ Graph
$ compGraph
$ horizontal
$ vertical
$ marker
$ most_frequent
$ least_frequent
$ compress
$ filter
ardata():- Returns a list
ardata function is used to communicate with the arduino via Serial. This function returns a list of values available in the Serial port.
ardata(COM ,lines= 50 ,baudrate= 9600 ,timeout= 1 ,squeeze= True ,dynamic= False ,msg= 'a' ,dynamicDelay= 0.5, numeric= True ) is the function header.
COM
COM parameter is used to specify the COM port to which arduino is connected to. You can pass either an integer or a string specifying the COM port.
Eg:
# COM parameter usage:
data = ardata(8) # or
data = ardata('COM=8')
#This will be interpreted as COM8
# If your COM port's name is not in this format, use the following:
data = ardata("YOUR_COM_PORT_NAME") #or
data = ardata('COM=YOUR_COM_PORT_NAME')
lines
lines denotes the number of data units or lines it reads from the Serial monitor of Arduino. The default value is set to 50 which can be changed. Note that based on another parameter squeeze, the number of elements in the list this function returns might be lesser than the that of actual data.
baudrate
baudrate parameter is used to specify the baudrate at which the Serial communication occurs at. The default value is 9600 which is the most widely used baudrate.
timeout
timeout is used to specify the timeout value in seconds. The default value is 1.
squeeze
squeeze is used to specify if the data needs to be compressed. This uses a function from data science part of this module compress() which is used to remove repeated and sequential set of data with a single piece of data.
Eg:
# Consider the following list of data:
data = [ 1 , 2 , 2 , 2 , 3 , 3 , 5 , 1 , 1 , 2 , 5 , 5 ]
info = compress(data)
print(info)
# This will print [ 1 , 2 , 3 , 5 , 1 , 2 , 5 ]
squeeze uses the same function and takes either True (or) False boolean values as parameters. By default, this parameter is set to True. Referencing the above example code, if squeeze is set to False, ardata will return data and if it is set to True which is the default setting, it will return info.
dynamic
dynamic is used to specify if the Serial communication is just to read from the serial port or for both reading and writing to the serial port. The default value is false which means you can only read from the Serial port. If dynamic is set to true, the string from the msg parameter will be written to the Serial port every time before reading a value.
msg
msg parameter specifies the message that is to be written in the serial monitor. the default value is 'a'. It is a must to pas this parameter if dynamic is set to true.
dynamicDelay
dynamicDelay is used to specify the time this program has to wait after writing a value to the console and to start reading from the COM port. It is experimentally determined that a delay of 0.5 seconds is mandatory in order to prevent overlapping of passed messages.
Note: ardata() reads one line at a time and hence Serial.println() should be used while coding Arduino and make sure there are no unnecessary Serial.print() or Serial.println() statements present in the code.
numeric
numeric is used to specify if the data you are expecting is of numeric type or not.
Demo:
1) One way communication: With dynamic set to False
//       Code uploaded to Arduino
int check = 2;
void setup() {
Serial.begin(9600);
pinMode(check,INPUT);
}

void loop() {
if(digitalRead(check)==HIGH)
  Serial.println("HIGH");
else
  Serial.println("LOW");
delay(500);
}
# Python code:
from Arduino_Master import *
# info contains complete data
info = ardata(8,squeeze=False,numeric= False)
print(f"{len(info)}=>{info}")
#compressed info contains compresses form of data
CompressedInfo = compress(info)
print(f"{len(CompressedInfo)}=>{CompressedInfo}")

'''
Output:
50=>['LOW', 'LOW', 'LOW', 'LOW', 'LOW', 'LOW', 'HIGH', 'HIGH', 'HIGH', 'HIGH', 'HIGH', 'HIGH', 'HIGH', 'HIGH', 'HIGH', 'HIGH', 'HIGH', 'LOW', 'LOW', 'HIGH', 'HIGH', 'HIGH', 'HIGH', 'HIGH', 'HIGH', 'LOW', 'LOW', 'LOW', 'LOW', 'LOW', 'LOW', 'LOW', 'LOW', 'LOW', 'LOW', 'LOW', 'LOW', 'LOW', 'LOW', 'LOW', 'LOW', 'LOW', 'LOW', 'LOW', 'LOW', 'LOW', 'LOW', 'LOW', 'LOW', 'LOW']
5=>['LOW', 'HIGH', 'LOW', 'HIGH', 'LOW']

Thus actual data contains 50 elements whereas compresses data contains only 5 elements yet represents the outline of the data.
if info = ardata(8) was used instead, we would get the compressed version of data here represented by CompressedInfo.
'''
2) Two way communication: With dynamic set to True
//       Code uploaded to Arduino
int check = 2;
void setup() {
Serial.begin(9600);
pinMode(check,INPUT);
}

void loop() {
if(Serial.available()>0)
{
  if(Serial.readString()=="State")
  {
          if(digitalRead(check)==HIGH)
            Serial.println("HIGH");
          else
            Serial.println("LOW");
  }

delay(500);
}
}
// This code will print the result on the serial monitor only if "State" is sent to the serial monitor
#   Python code
from Arduino_Master import *

info = ardata(8,dynamic=True,msg="State",numeric=False)
print(info)
'''
This would print
['LOW', 'HIGH', 'LOW', 'HIGH', 'LOW', 'HIGH']
Since squeeze by default is set to True, data is compressed!
'''
Though both these demonstrations are used to extract data from Arduino, the later is better than the former. The reason is that when dynamic is set to True, we ask for instantaneous information whereas when dynamic is set to False, there is a possibility of getting initial data alone rather than instantaneous data since arduino keeps writing the values to the Serial monitor.
The functionality being inherited from pyserial, It is possible to call all functions from pyserial module without prefixing the functions with 'serial.' statement.
readSerial:- Returns a value( int / float / String )
readSerial reads only one line from the Arduino.
readSerial( COM , baudrate = 9600 , timeout = 1 ) is the function header.
| Parameters | Usage |
|---|---|
| COM | Specify the COM port. Similar to ardata(), you can pass either an integer or the complete name as a string. |
| baudrate =9600 | Set the baudrate. Default value is 9600. |
| timeout =1 | Set the timeout. Default is 1 |
returns a element (if available within timeout !). numeric is set to False for readSerial.
writeSerial():- Returns Nothing
writeSerial writes only one string to the Arduino's Serial monitor.
writeSerial(COM,baudrate=9600,timeout=1,msg="") is the function header.
| Parameters | Usage |
|---|---|
| COM | Specify the COM port. Similar to ardata(), you can pass either an integer or the complete name as a string. |
| baudrate =9600 | Set the baudrate. Default value is 9600. |
| timeout = 1 | Set the timeout. Default is 1 |
| msg = "" | String to be written to the Serial Port |
Returns nothing !
dynamicSerial:- Returns a list with only one element
dynamicSerial is similar to dynamic mode of ardata() except that this returns a list with just one element in it.
dynamicSerial( COM , baudrate = 9600 , timeout = 1 , msg = "a" , dynamicDelay = 0.5 ) is the function header.
| Parameters | Usage |
|---|---|
| COM | Specify the COM port. Similar to ardata(), you can pass either an integer or the complete name as a string. |
| baudrate =9600 | Set the baudrate. Default value is 9600. |
| timeout =1 | Set the timeout. Default is 1 |
| msg ="a" | String to be written to the Serial Port |
| dynamicDelay = 0.5 | Similar to that of ardata's dynamicDelay. Default value is set to 0.5 seconds. Any value lesser than this would result in overlapping of the input. |
This function returns a list with only one element.
Note:
For an arduino program that prints a value on Serial monitor only when we send it a value, the combination of writeSerial and readSerial functions won't work. dynamicSerial has to be used at that place.
# Use
dynamicSerial(8,msg="Give DATA")

# INSTEAD OF
writeSerial(8,msg="Give Data")
data=readSerial(8)

# The latter would only return an empty list !!!
Introduction to hybrids
hybrid is used to pack both X and Y values of a plot together for easier accessing of functions. A hybrid is basically a tuple of two lists with the first one containing the X values (index) and Y values (amplitude). They have a significant advantage over the limitation offered Dictionaries. In this Delta version, the first parameter of most of the data science functions is a hybrid. The functions discussed before this section returns only a list whereas most of the upcoming functions returns hybrids.
# X and Y are lists
X = [ 1,2,3,4,5,6,7,8,9,10 ]
Y = [ 10,9,8,7,6,1,4,3,2,-5 ]

# hyb is a tuple which we refer to as an hybrid.
hyb = ( [ 1,2,3,4,5,6,7,8,9,10 ] , [ 10,9,8,7,6,1,4,3,2,-5 ] )

# Method 1:
anyFunction( x=X , y=Y )

# Method 2:
anyFunction( hyb ) # Since for most of the data science fucntions, the first parameter is a hybrid,
# it can be passed directly !

# It is evident that Method 2 is less time consuming than Method 1
hybridize:- Returns a hybrid
hybridize takes one or two lists as parameters and returns an hybrid.
hybridize ( li1 , li2 = None ) is the function header.
When two lists are passed, li1 corresponds to index and li2 corresponds to amplitude.
# X and Y are lists
X = [ 1,2,3,4,5,6,7,8,9,10 ]
Y = [ 10,9,8,7,6,1,4,3,2,-5 ]

hyb = hybridize( X , Y )
print(hyb)

# This would print -> ( [ 1,2,3,4,5,6,7,8,9,10 ] , [ 10,9,8,7,6,1,4,3,2,-5 ] )
When we don't need custom X values, passing just amplitude is enough. In this case X values will be automatically generated from 0 to (length of amplitude list -1)
# X and Y are lists
X = [ 1,2,3,4,5,6,7,8,9,10 ]
Y = [ 10,9,8,7,6,1,4,3,2,-5 ]

hyb = hybridize( Y )
print(hyb)

# This would print -> ( [ 0,1,2,3,4,5,6,7,8,9 ] , [ 10,9,8,7,6,1,4,3,2,-5 ] )
Note: Passing parameters with parameter names is not encouraged ! (i.e.) hyb = hybridize( li2 = Y) would throw an error.
Separating a hybrid into its constituent lists:
hyb = ( [ 1,2,3,4,5,6,7,8,9,10 ] , [ 10,9,8,7,6,1,4,3,2,-5 ] )

listX , listY = hyb
print(listX)
print(listY)
# This would print the following
# [1, 2, 3, 4, 5, 6, 7, 8, 9, 10]
# [10, 9, 8, 7, 6, 1, 4, 3, 2, -5]
Graph:- Returns Nothing. Just plots a Graph
Graph function is used to visualize a list of data.
Graph( hybrid= None, x= [], y= [], xlabel= 'dataPiece', ylabel= 'Amplitude', label= 'myData', color= 'red', title= 'Graph', markersize= 7, stl= 'dark_background', d= {}, mark= 'x' ) is the function header.
| Parameters | Usage |
|---|---|
| hybrid = None | Used to pass a hybrid. Since it si the first parameter, hybrid can be passed directly without the parameter name |
| x = [] | Pass a list of valuesto be plotted along the x-axis. |
| y = [] | Pass a list of values to be plotted along the y-axis. The x-axis is automatically generated depending on the number of parameters in your given list if no hybrid or x parameter is passed. |
| xlabel = 'dataPiece' | Used to label the X-axis legend |
| ylabel = 'Amplitude' | Used to label the Y-axis legend |
| label = 'myData' | What you want your data to be called |
| color = 'red' | What color you want your data to be plotted with |
| title = 'Graph' | Name of the graph |
| mark = 'x' | Used to set the marker type. Refer this StyleSheet => Marker_Style_Sheet |
| markersize = 7 | Size of the plotting line. |
| stl = 'dark_background' | Style of Graph you wish. Refer this StyleSheet => StyleSheet |
| d = {} | Used to pass a dictionary. This is used only when you need custom x values instead of default sequentially arranged X-values. y and d must not be passed together. |
Passing Strings to y (or) Dictionaries whose values are strings will also be plotted accordingly !
Demo:
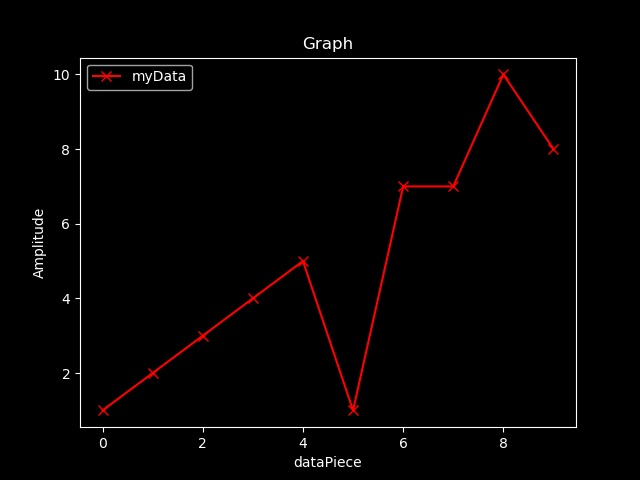
Demonstration 1: Passing a list to y
# Python Code
myList = [ 1 , 2 , 3 , 4 , 5 , 1 , 7 , 7 , 10 , 8]
Graph(y = myList)
Output:
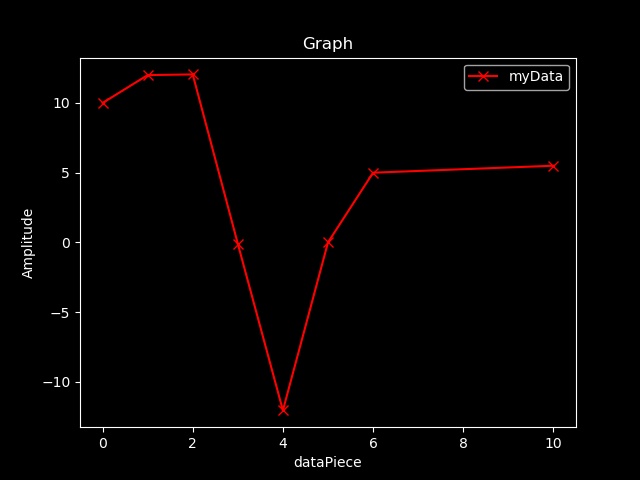
Demonstration 2: Plotting using a dictionary to get custom X-values.
# Python Code
myDict = { 0:10 , 1:12 , 2:12.05 , 3:-0.1 , 4:-12.05 , 5:0 , 6:5 , 6:5 , 10:5.5 }
Graph(d=myDict)
Output:
Demonstration 3: Plotting Strings:
# Python code
listOfStrings = ['LOW', 'LOW', 'LOW', 'LOW', 'LOW', 'LOW', 'HIGH', 'HIGH', 'HIGH', 'HIGH', 'HIGH', 'HIGH', 'HIGH', 'HIGH', 'HIGH', 'HIGH', 'HIGH', 'LOW', 'LOW', 'HIGH', 'HIGH']
Graph(y = listOfStrings)
Output:
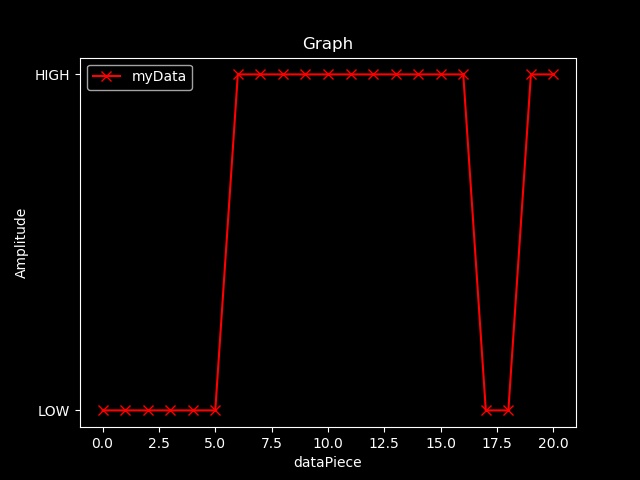
The same can also be done by passing a Dictionary !
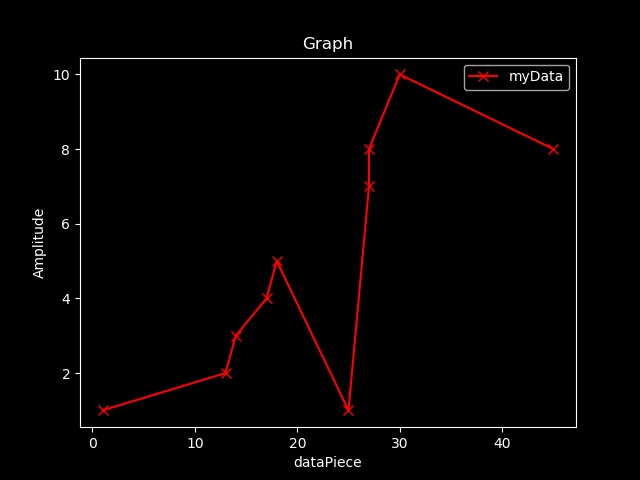
Demonstration 4: Using hybrid:
#python code
X = [ 1 , 13 , 14 , 17 , 18 , 25 , 27 , 27 , 30 , 45 ]
Y = [ 1 , 2 , 3 , 4 , 5 , 1 , 7 , 8 , 10 , 8]

hyb = hybridize(X,Y)
Graph(hyb)

# Graph( x=X ,y=Y ) would give the same output but it is a better practice to use hybrids since key functions like filter takes and returns hybrids.
Output:
compGraph:- Returns Nothing. Just plots a Graph
compGraph is used to compare two sets of data (any combination of list, dictionary or a hybrid)
compGraph( hybrid1= None, hybrid2 =None, x1= [], y1= [], x2= [], y2= [], xlabel= 'dataPiece', ylabel= 'Amplitude', label1= 'myData-1', label2= 'myData-2', color1= 'red', color2= 'blue', title= 'Graph', markersize= 7, stl= 'dark_background', fit= True, d1= {}, d2= {} ) is the function header.
| Parameters | Usage |
|---|---|
| hybrid1 = None | pass first hybrid |
| hybrid2 = None | pass second hybrid |
| x1 = [] | Pass a list of values to be plotted along X-axis for the first plot. |
| y1 = [] | Pass a list of values to be plotted along the y-axis. The x-axis is automatically generated depending on the number of parameters in your given list if x1 is not passed. |
| x2 = [] | Pass a list of values to be plotted along X-axis for the second plot. |
| y2 = [] | Pass a list of values to be plotted along the y-axis. The x-axis is automatically generated depending on the number of parameters in your given list if x2 is not passed. |
| xlabel = 'dataPiece' | Used to label the X-axis legend |
| ylabel = 'Amplitude' | Used to label the Y-axis legend |
| label1 = 'myData-1' | What you want your first set data to be called |
| label2 = 'myData-2' | What you want your second set data to be called |
| color1 = 'red' | What color you want your first set of data to be plotted with |
| color2 = 'blue' | What color you want your second set of data to be plotted with |
| title = 'Graph' | Name of the graph |
| markersize = 7 | Size of the plotting line. |
| stl = 'dark_background' | Style of Graph you wish. Refer this StyleSheet => StyleSheet |
| d1 = {} | Used to pass a dictionary as the first set of data. This is used only when you need custom x values instead of default sequentially arranged X-values. y and d1 must not be passed together. |
| d2 = {} | Used to pass a dictionary as the second set of data. This is used only when you need custom x values instead of default sequentially arranged X-values. y2 and d2 must not be passed together. |
| fit = True | A bit complex, and hence explained below |
fit
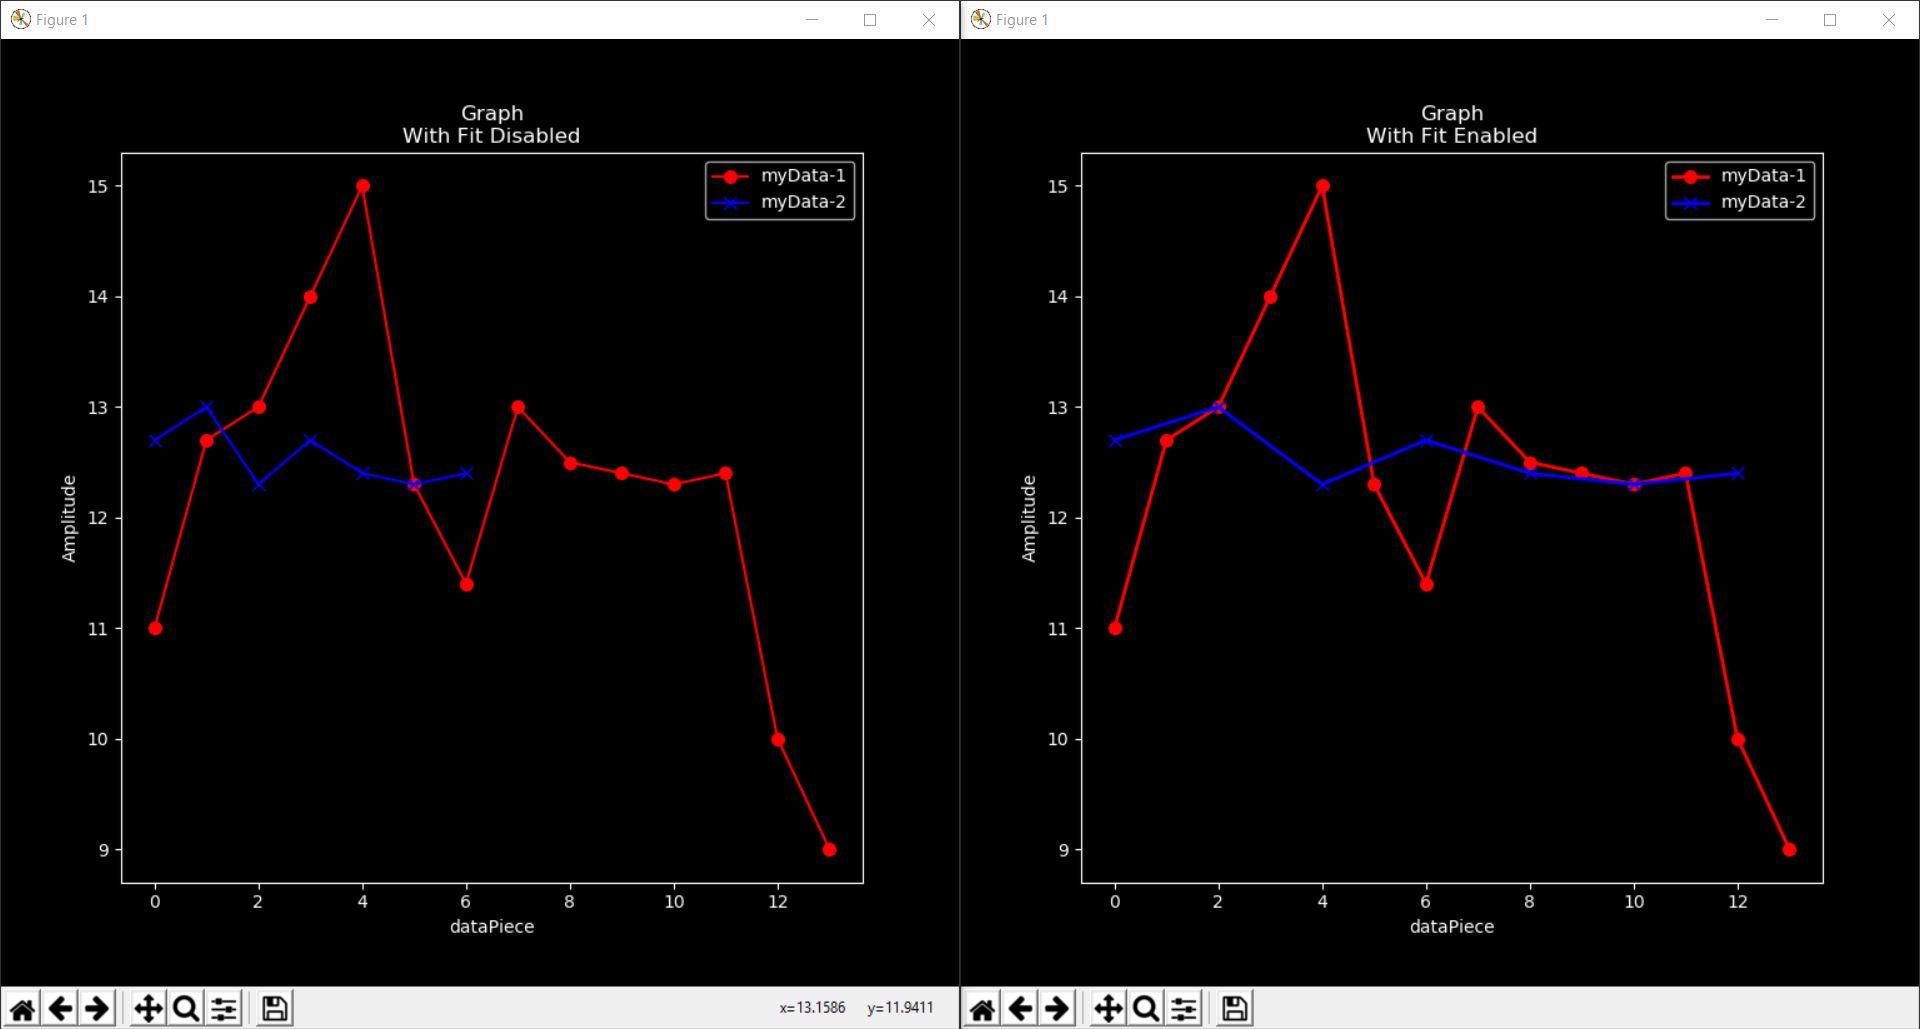
fit parameter is used to specify if both the graphs need to be scaled to the maximum size or not. When y and y2 values have different number of elements fit = True enables changing X-values of the list of data which has less number of elements to equalize and approximate the correctness of distribution of data.
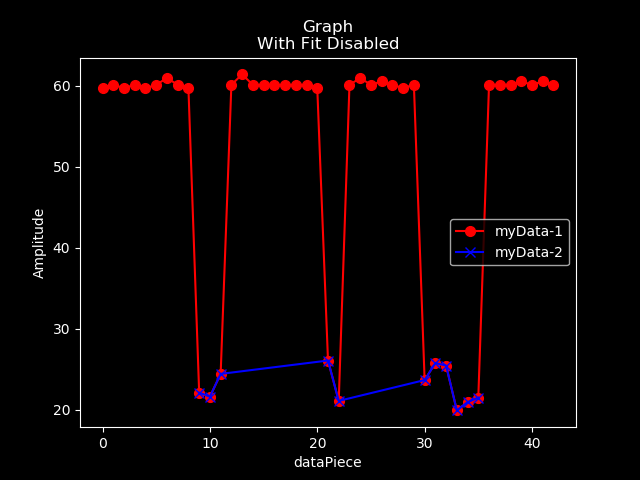
When using lists:
# Code for left graph
y1=[11,12.7,13,14,15,12.3,11.4,13,12.5,12.4,12.3,12.4,10,9]
y2=[12.7,13,12.3,12.7,12.4,12.3,12.4]
compGraph(y1=y1,y2=y2,fit= False)

# Code for right graph
y1=[11,12.7,13,14,15,12.3,11.4,13,12.5,12.4,12.3,12.4,10,9]
y2=[12.7,13,12.3,12.7,12.4,12.3,12.4]
compGraph(y1=y1,y2=y2)
With Fit Disabled (left) and With Fit Enabled (right)
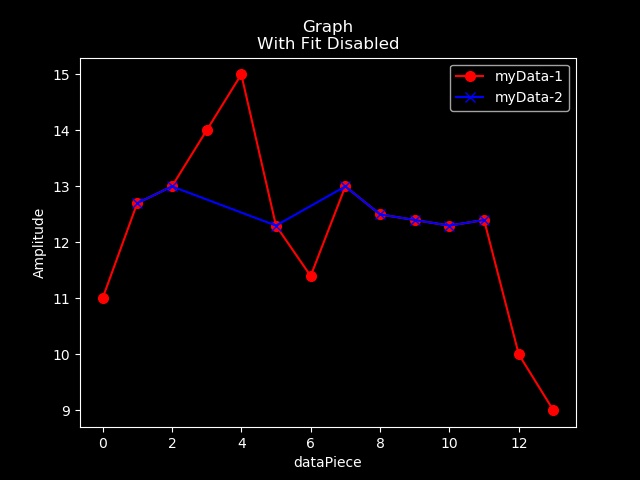
When using hybrids:
y1=[11,12.7,13,14,15,12.3,11.4,13,12.5,12.4,12.3,12.4,10,9]
y2=[12.7,13,12.3,13,12.5,12.4,12.3,12.4]
x2=[1,2,5,7,8,9,10,11]    # x2 values were created based on the position of y2 elements in y1.
# Filter function would ease this process !
# Which will be explained soon !!

hyb1 = hybridize(y1) # x1 values are automatically generated !
hyb2 = hybridize(x2,y2) # x2 values are provided

compGraph(hyb1,hyb2) # fit is set to False
Since when hybrids are used, Fit is disabled for accuracy !
In the above pics, the red colored data represents raw_data and blue colored data represents filtered data. So naturally filtered set of data will have less number of elements in it and if compGraph() function is used the result would be similar to the left Graph which looks a bit absurd. When fit = True enables data to fit into the whole graph without affecting the Amplitude of the data. In simple words, smaller list of data is stretched to the size of the bigger list of data along the X-axis to give an approximation without using dictionaries which are comparatively difficult to use than lists so as to make the functions newbie friendly.
Fit is set to False when hybrids are used.
compGraph is similar to Graph function just with visualizing one more list of data
horizontal:- Returns Nothing. Just a placeholder for graph
Creates a line parallel to X-axis.
horizontal( y , lbl = 'horizontal' , start = 0 , end = 10 , stl = 'dark_background',color='yellow') is the function header.
| Parameter | Usage |
|---|---|
| y | The distance from the origin is specified here |
| lbl = 'horizontal' | label is set to 'horizontal' by default |
| start = 0 | value from which this line should start |
| end = 10 | value at which this line should end |
| color='yellow' | Color of the horizontal |
| stl='dark_background' | Set the style of the plot. Refer this StyleSheet => StyleSheet |
Use this function before the Graph() function you wish the line to plotted in.
vertical:- Returns Nothing. Just a placeholder for graph
Creates a line parallel to Y-axis.
vertical( x , lbl = 'vertical' , start = 0 , end = 10 , stl = 'dark_background',color='yellow') is the function header.
| Parameter | Usage |
|---|---|
| x | The distance from the origin is specified here |
| lbl = 'vertical' | label is set to 'vertical' by default |
| start = 0 | value from which this line should start |
| end = 10 | value at which this line should end |
| color='yellow' | Color of the vertical |
| stl='dark_background' | Set the style of the plot. Refer this StyleSheet => StyleSheet |
Use this function before the Graph() function you wish the line to plotted in.
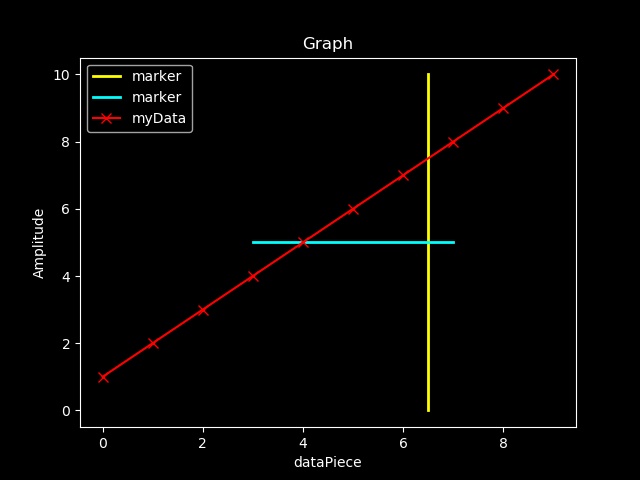
vertical and horizontal are used as markers in a graph and are yellow in color by default !
vertical(6.5)
horizontal(5,start=3,end=7,color='cyan')
Graph(y=[1,2,3,4,5,6,7,8,9,10])
# This would result in the following Graph
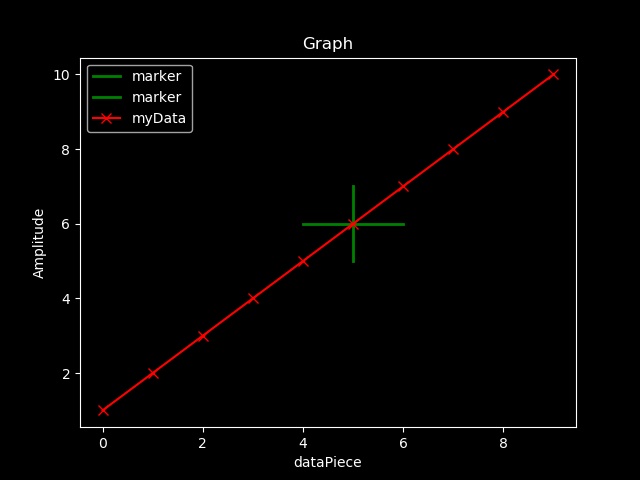
marker:- Returns Nothing. Just a placeholder for graph
marker function creates a plus shaped plot at a given co-ordinate.
marker( x , y , limit = 1 , lbl = "marker" , stl = 'dark_background',color='yellow') is the function header.
| Parameter | Usage |
|---|---|
| x | X Coordinate |
| y | Y Coordinate |
| limit=1 | size of the marker |
| lbl='marker' | specify a label |
| color='yellow' | Color of the marker |
| stl='dark_background' | Set the style of the plot. Refer this StyleSheet => StyleSheet |
Use this function before the Graph() function you wish this marker to be plotted
marker(5,6,color='green')
Graph(y=[1,2,3,4,5,6,7,8,9,10])
# This would result in the following Graph
most_frequent:- Returns a value( int / float / String )
most_frequent is used to return the most frequently occurring element in a given list.
most_frequent(List) is the function header. Just pass a list as a parameter, and it will return the most repeated element in the given list.
least_frequent:- Returns a value( int / float / String )
least_frequent is used to return the least frequently occurring element in a given list.
least_frequent(List) is the function header. Just pass a list as a parameter, and it will return the least repeated element in the given list.
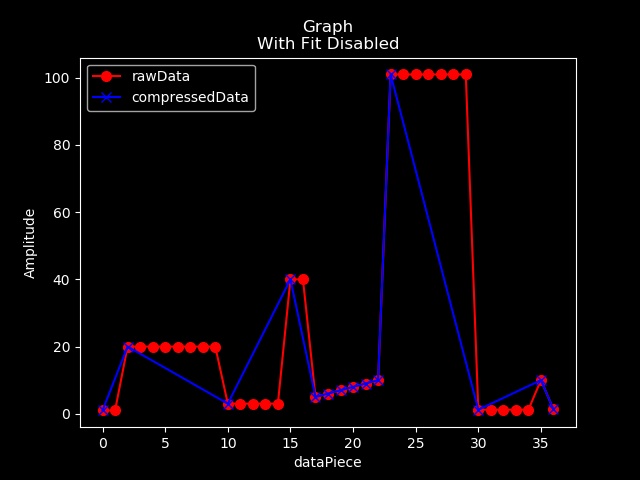
compress:- Returns a list if you pass a list. Returns a hybrid if you pass a hybrid
compress() which is used to remove repeated and sequential set of data with a single piece of data.
compress(li) is the function header.
From this version(0.9.2), compress function is compatible with both lists and hybrids.
If a list is passed, this function returns a list and if a hybrid is passed, this function returns a hybrid.
In the below pic, red colored plot refers to the actual, uncompressed data while blue represents compressed data. As you can see the only purpose of compress is to show the trend of data and since Fit is enabled, an approximation of data is shown. In simple words, compress replaces continuous equivalent elements by a single element. compress is used only to visualize how many times a data piece varies to and fro and hence just an approximation. The next pics also has the same color representation as of before and demonstrates compress() function !
When lists are used, we observe that the compressed data is approximated.
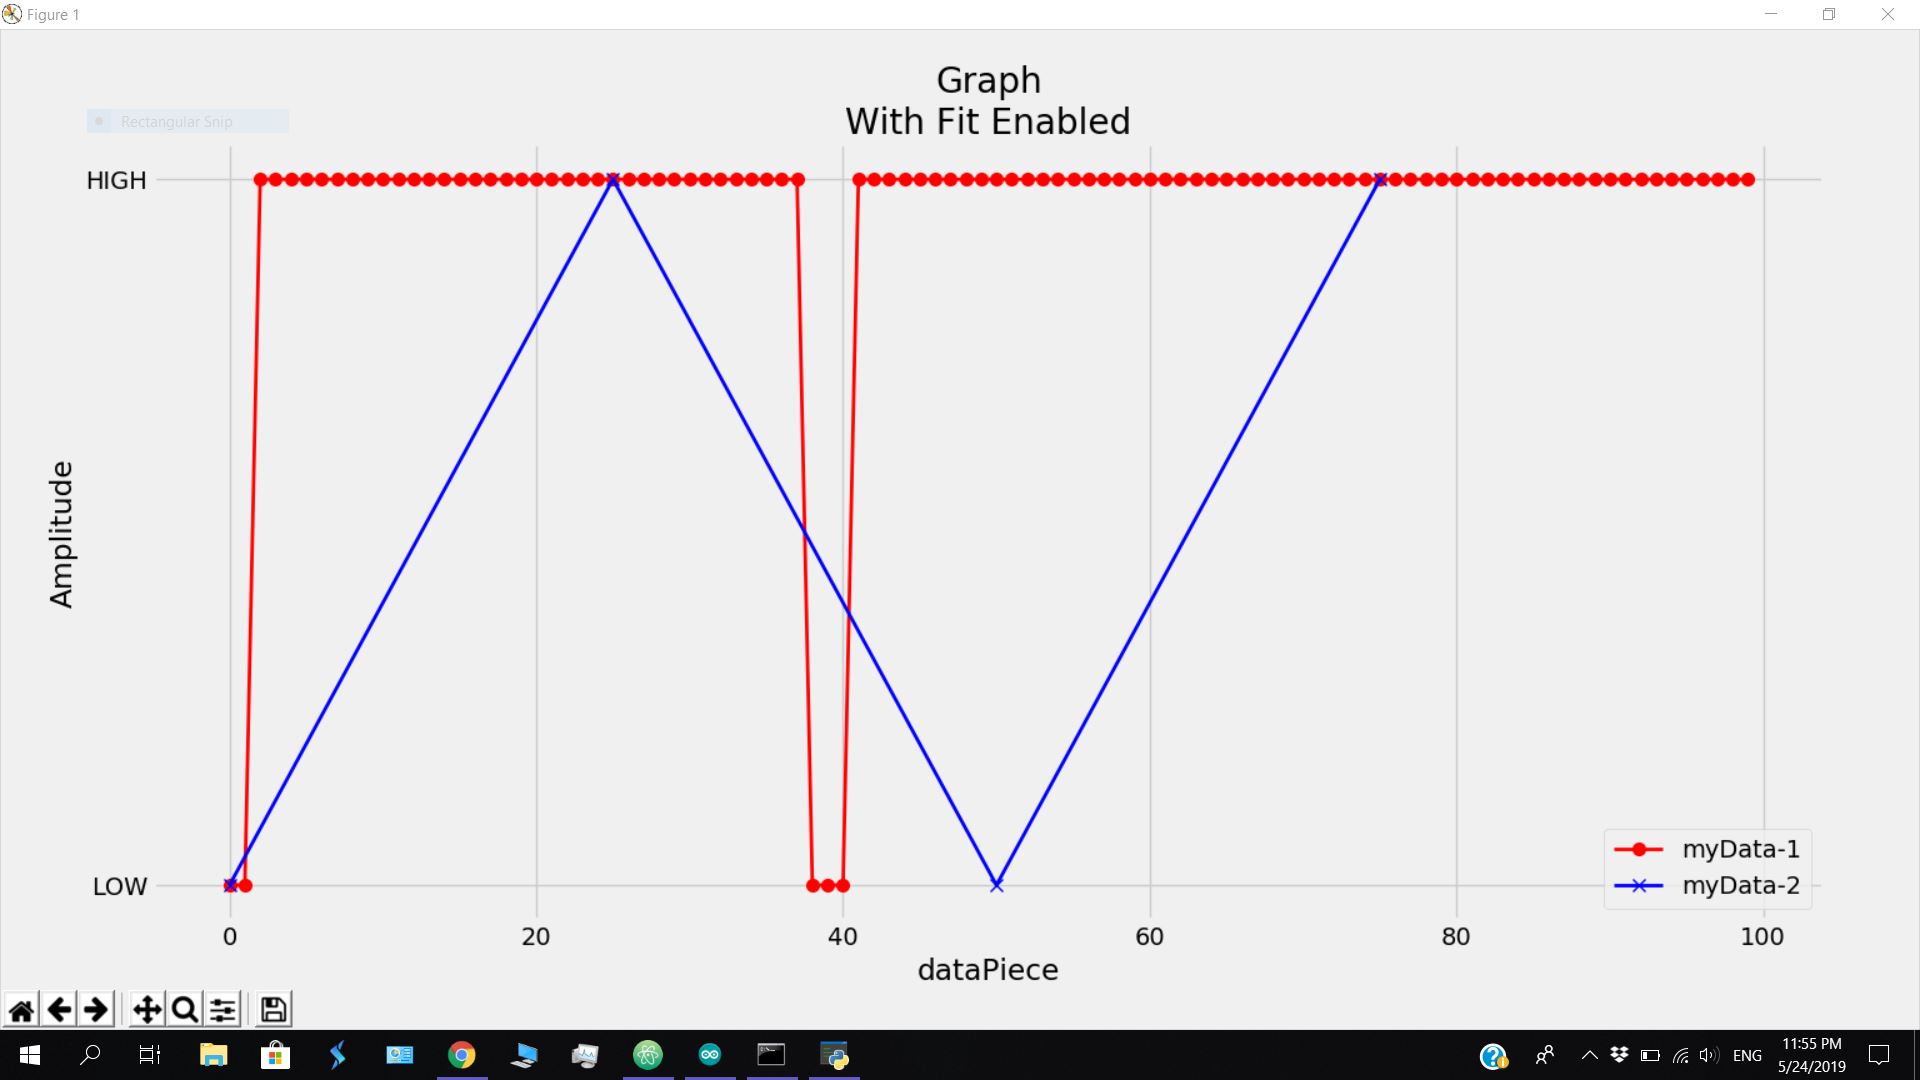
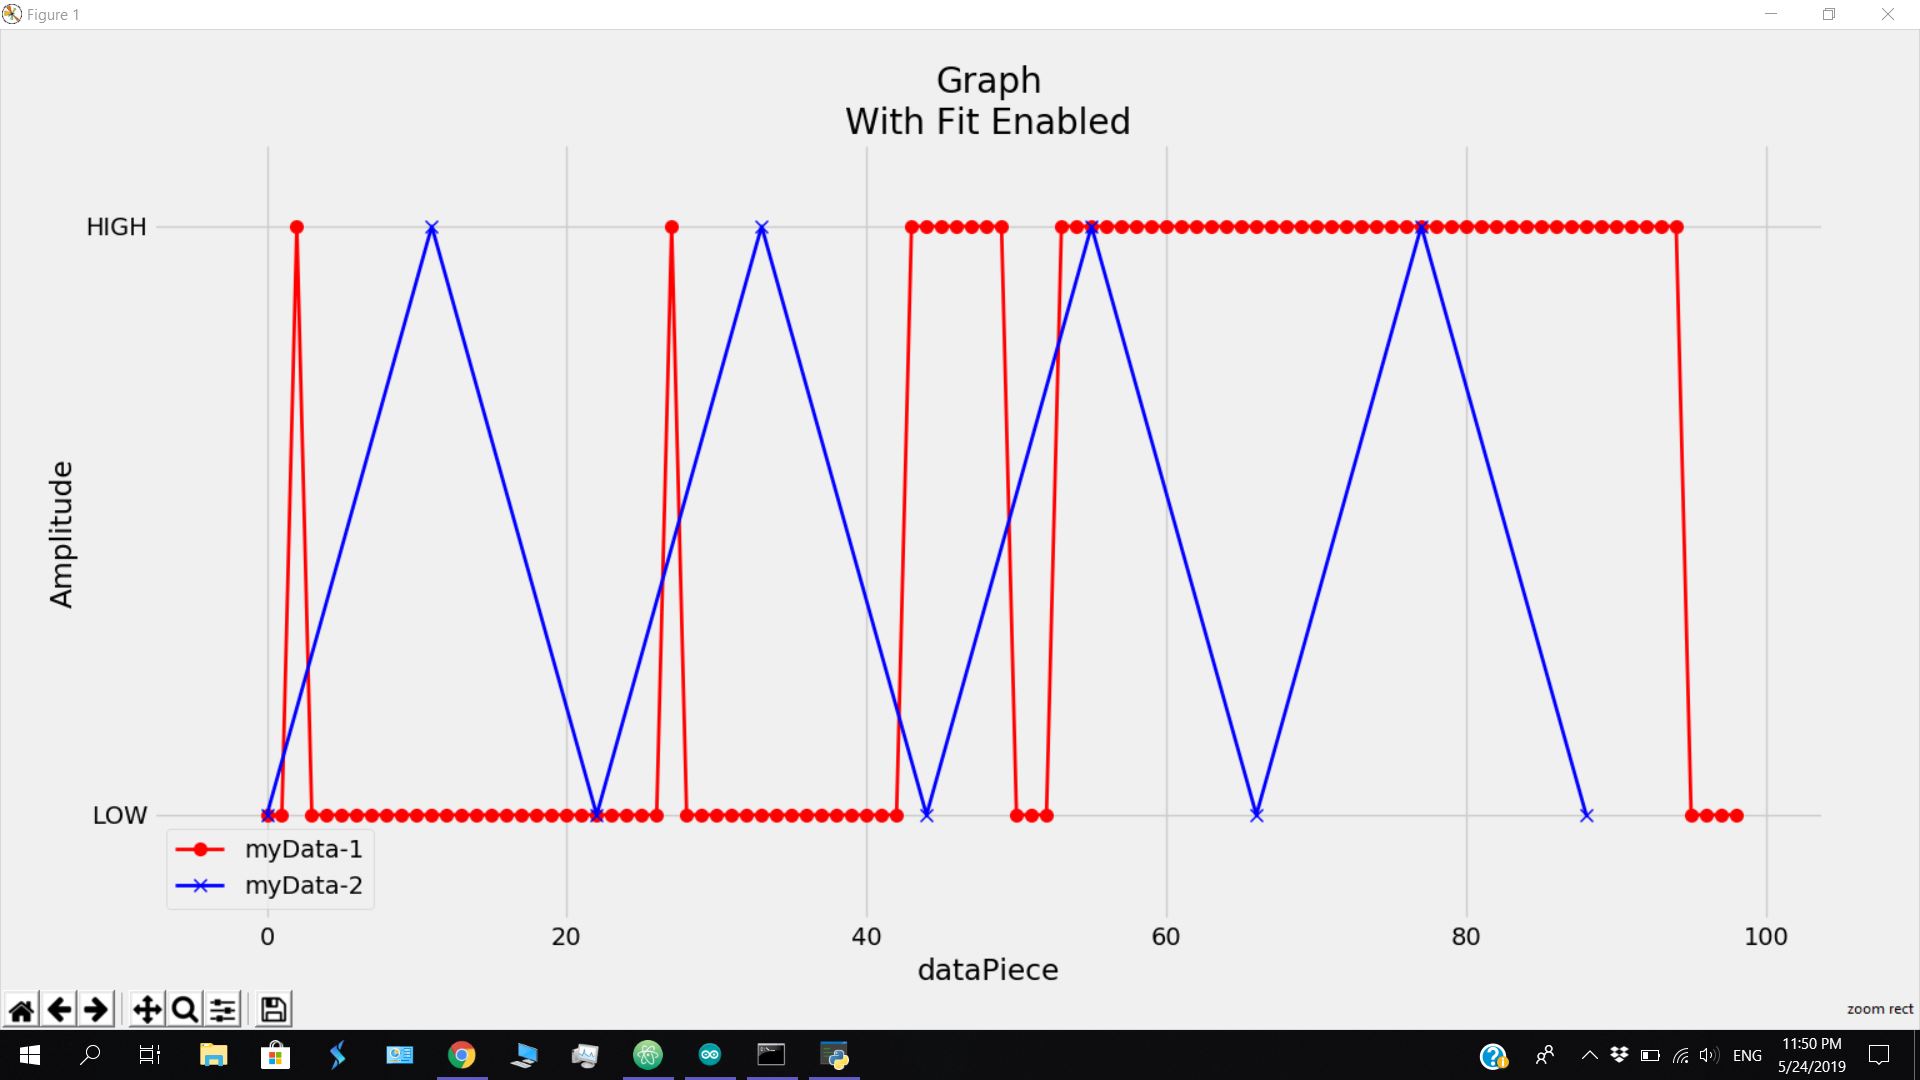
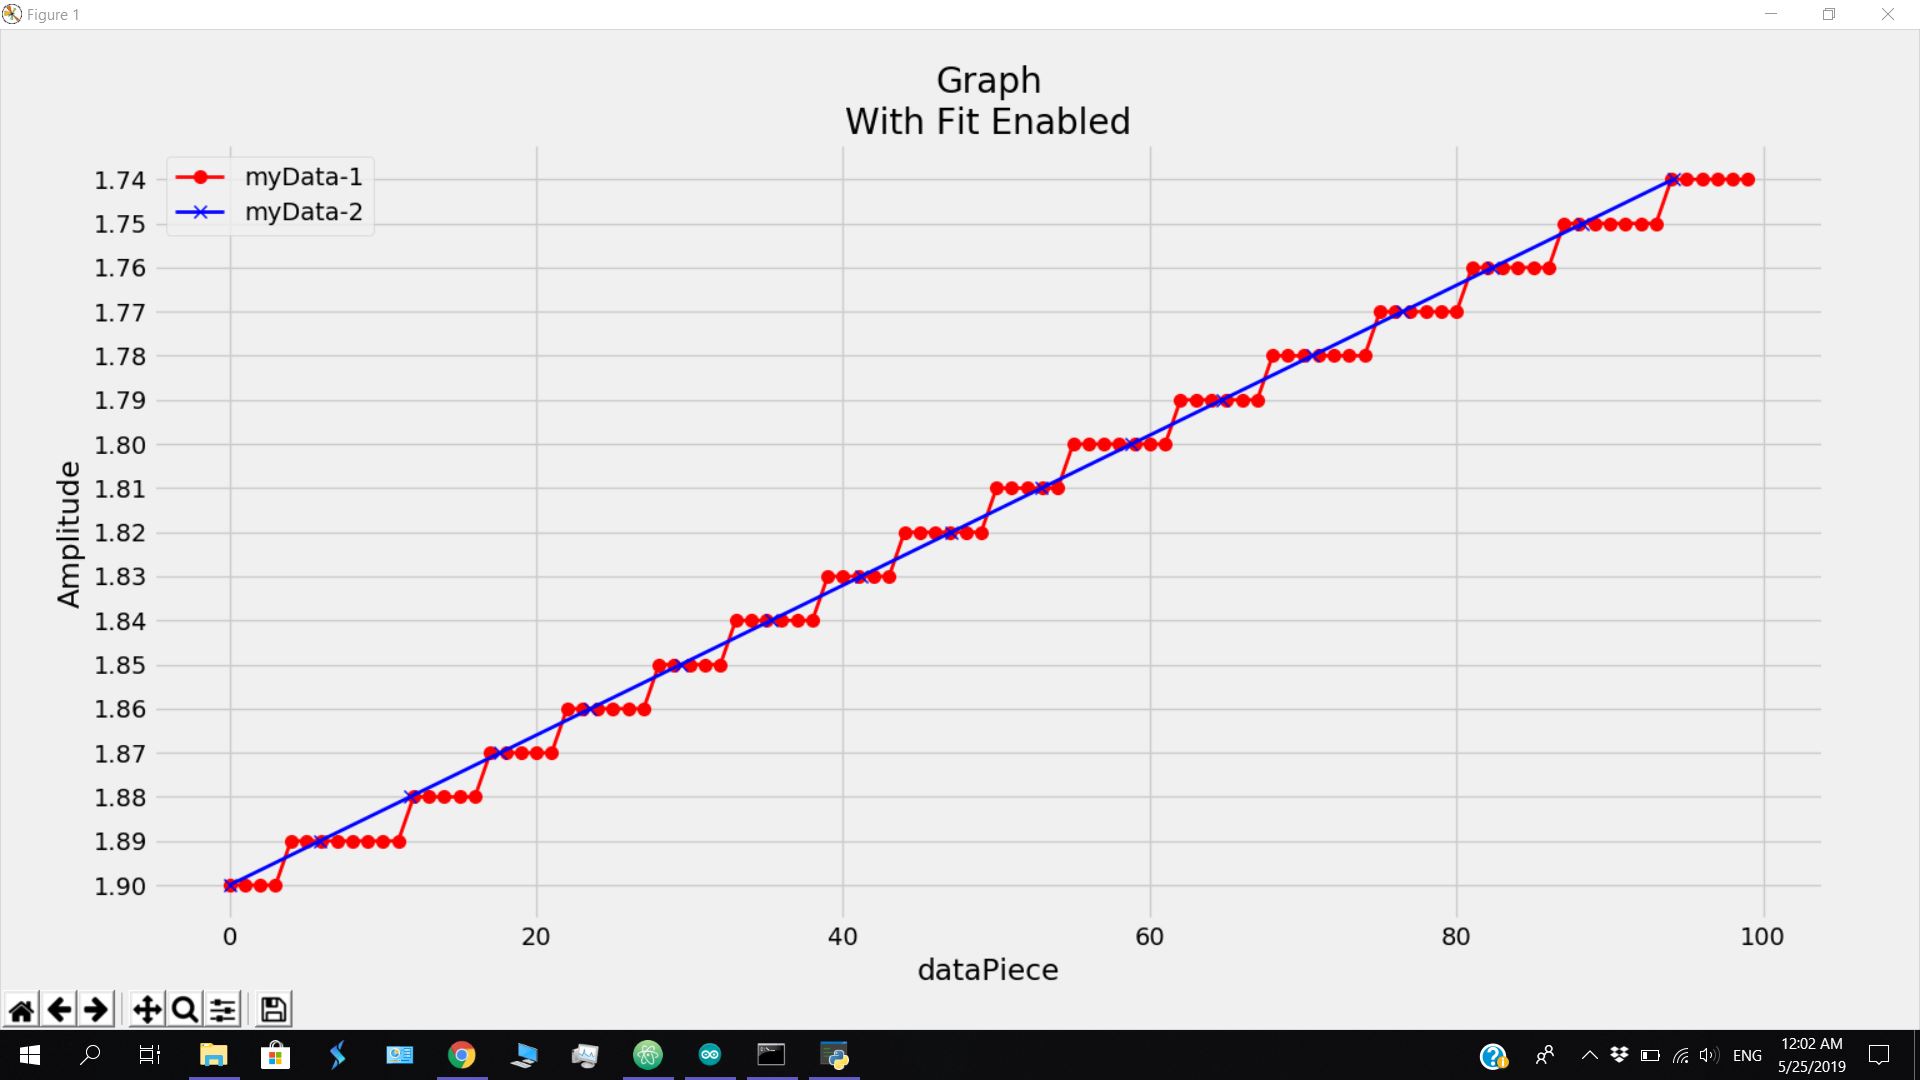
When a hybrid is used, we get an accurate representation of data.
filter:- Returns a hybrid
filter function is used to remove unnecessary data from a list.This function is compatible with lists and hybrids..This function returns a hybrid !
filter( hybrid= None, index= [], data= [], expected= [], expectedType= None, maxDeviation= None, minDeviation= None, closeTo= None, farFrom= None, numeric= True, limit= [], frequentAverage= False ) is the function header.
| Parameters | Usage |
|---|---|
| hybrid = None | Pass an hybrid |
| index = [] | This parameter accepts a list of X-axis values. |
| data = [] | This parameter accepts a list of Y-axis values. |
| expected = [ ] | Pass a list of expected elements that you need in the filtered list |
| expectedType = [ ] | Filters data based on the type. You can pass the following as arguements : int , float , str , 'num' , 'all'. Note that num and all alone are placed within single quotes since they are custom made types. 'num' denotes all numeric data like int and float. 'all' denotes all kinds of data. When expectedType is used, numeric is set to False |
| maxDeviation = None | Permitted maximum deviation from calculated average. |
| minDeviation=None | Permitted minimum deviation from calculated average or farFrom parameter. |
| closeTo = None | Used to find data close to the given arguement. If closeTo alone is used without max_deviation, then max_deviation is taken as 1 by default. |
| farFrom=None | Pass an numeric value or 'avg' (string). if farFrom!='avg', data minDeviation units farther from the farFrom parameter is considered. If farFrom=='avg', data minDeviation units away from average is considered.If minDeviation is not passed, minDeviation is taken as 1. |
| numeric = True | Used to specify if you are looking for numeric data for calculation. If you wish to have strings of data in your filtered list make sure you set numeric to False. numeric = True converts all values to float and that's the reason why when expectedType is used, numeric is set to False. |
| limit = [ ] | Used to specify filter out garbage values! It basically means, no matter what, the data would not have gone beyond these limits. If it did, it is a Garbage Value. The format is limit=[ start-limit , end-limit ] |
| frequentAverage = False | Used to specify if to use most frequent data as average |
Why and How average is calculated ?
While filtering data with max_deviation, a value has to be specified from which the upper and lower limits containing data are filter.(i.e.) if max_deviation is 1.5, data is filtered such that only data within +(or)- 1.5 than average is present in the filtered data.
This is how average is calculated.
If closeTo value is present, closeTo is taken as average.
If closeTo value is not passed, the most frequent data piece in the list of data is taken as average.
If closeTo is not passed as well as all the elements in the given data are unique, average is calculated in the conventional way. But with huge garbage values, the average would shift so much that no data remains in that area returning an empty list. For that when limit parameter is passed, garbage values are filtered out earlier before other calculations take place.
Depending on the number of lines you need to read, time you need to wait will increase !!!
Garbage values occur when your arduino's pins come in contact with each other. No matter if it is a cloth or your hand, arduino is sensitive enough to sense it and give you garbage values !!
Demo:
Garbage Value Removal:
String msg;
const int trigPin = 9;
const int echoPin = 10;
double duration;
float distance;

void setup()
{
    Serial.begin(9600);
    pinMode(echoPin, INPUT);
    pinMode(trigPin, OUTPUT);
}

void loop()
// If information is available in Serial port from arduino get it and then checking for the distance
{   if (Serial.available()>0)
{
    msg=Serial.readString() ;
    if(msg=="d")
      {
        digitalWrite(trigPin, LOW);
        delayMicroseconds(2);
        digitalWrite(trigPin, HIGH);
        delayMicroseconds(10);
        digitalWrite(trigPin, LOW);
        duration = pulseIn(echoPin, HIGH);
        distance= duration/29/2;
        Serial.println(distance);
       }
    else
      int i=0; // Just Do nothing.....(Never Mind statement !!! )

}
}
# importing area !!
from Arduino_Master_Delta import *

# collecting data and saving it as a list in rawData
rawData = ardata(7,lines=50,dynamic=True,msg='d')  # if set is not used, the most repeated set of value would be taken as average !

# Inserting garbage values for checking,
rawData.insert(13,600)
rawData.insert(28,5600)

# rawHybrid contains hybridized form of rawData
rawHybrid = hybridize( rawData )
print(rawHybrid)
filteredHybrid = filter(rawHybrid,expectedType='num',limit=[0,200],maxDeviation=10)
print("")
print(filteredHybrid)

Graph(hybridize(rawData))
Graph(filteredHybrid)
compGraph(rawHybrid,filteredHybrid)
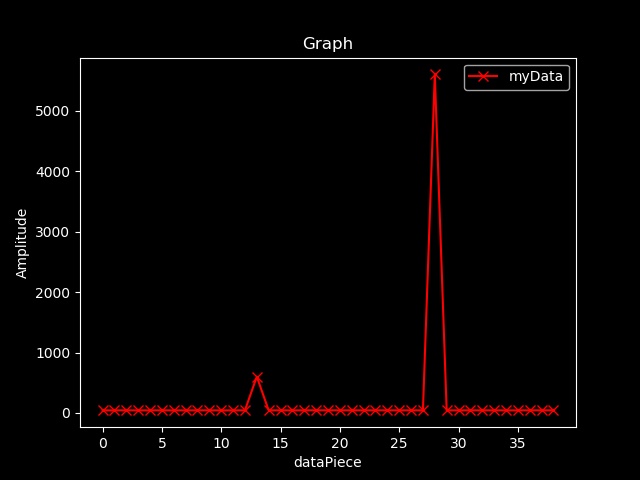
Without any filter, The above pic displays the data from Arduino with custom added garbage values in order to test.
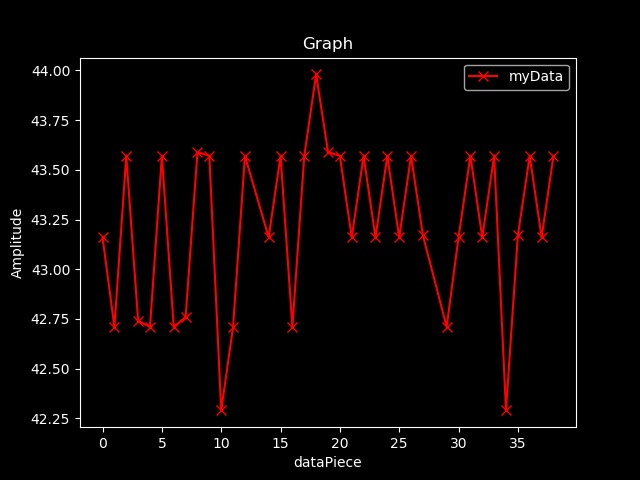
Data after filtering is displayed above !! Thus conventional average works fine !!
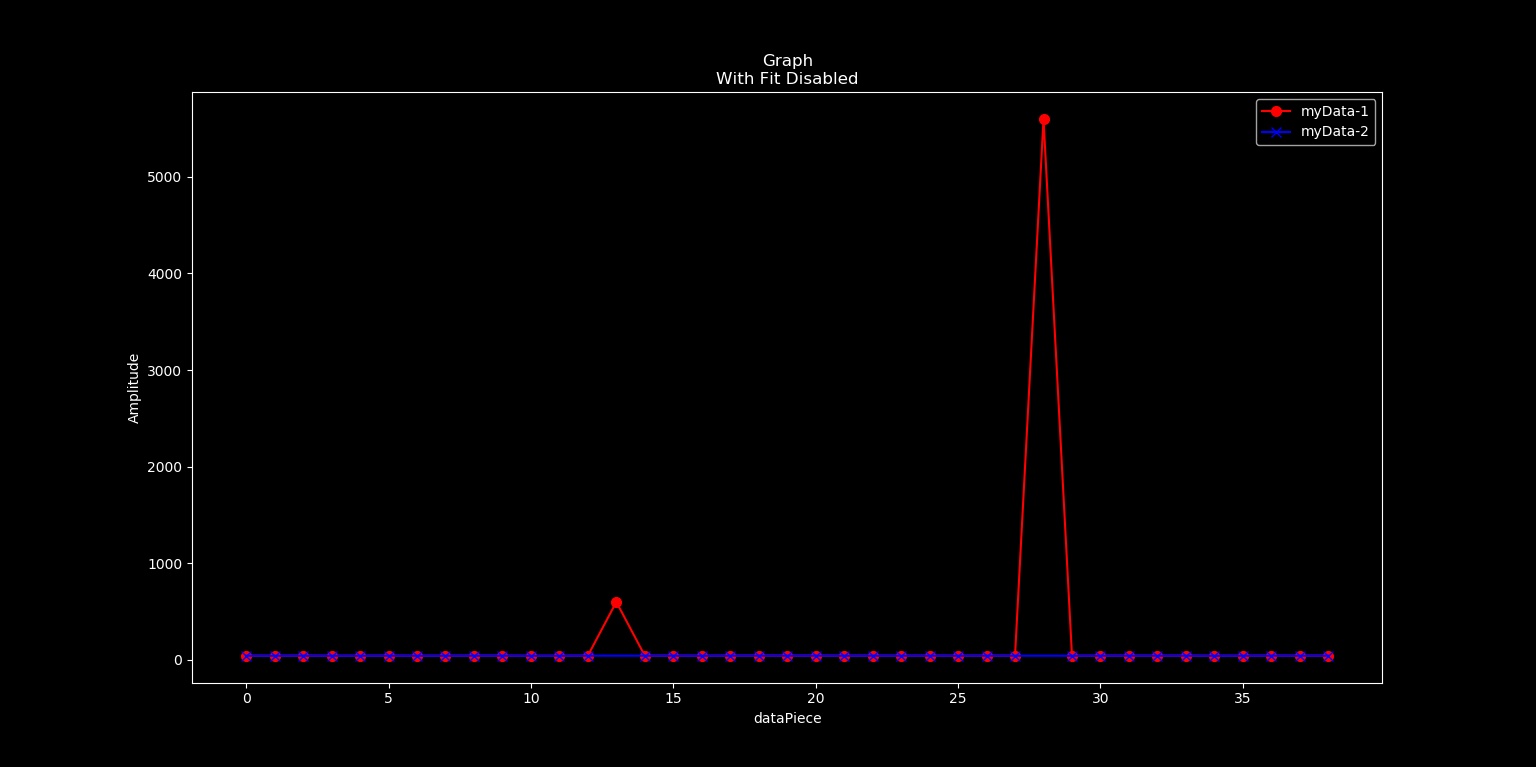
Comparison of data is displayed above. Since the limits of the sensor were specified, values as high as 4500 and 6000 were removed and then the average was calculated making this module a well built one. Red is raw data whereas Blue is filtered data.
If used correctly, you can filter your data in the following ways !!!

Check light intensity and with previously measured values, you can check if the light is switched on or not just using an LDR.
Arduino Code:
int ldr = A0;
void setup() {
Serial.begin(9600);
pinMode(ldr,INPUT);
}

void loop() {
if(Serial.available()>0)
{
  if(Serial.readString()=="d")
  {
          Serial.println(analogRead(ldr)*5.0/1023.0);
  }

}
}
Python Code:
rawData = ardata(7,lines=50,dynamic=True,msg='d')  # if set is not used, the most repeated set of value would be taken as average !

# rawHybrid contains hybridized form of rawData
rawHybrid = hybridize( rawData )
print(rawHybrid)
Hybrid = filter(rawHybrid,expectedType='num',limit=[0,3.5]) # Just filtering out garbage values if any
print("")
print(Hybrid)

ind , data = Hybrid # Seperating the hybrid

#Segregating Data:
newData=[]
for z in range(len(data)):
    if (data[z]>1.5):
        newData.append("Light On")
    else:
        newData.append("It's Dark")
filteredHybrid = hybridize(ind , newData)


compGraph(Hybrid,filteredHybrid)
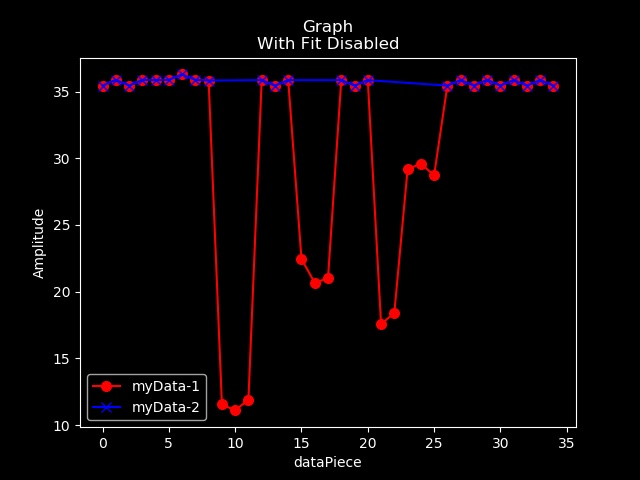
Impulse removal Example in the above pic
Arduino_Code:
String msg;
const int trigPin = 9;
const int echoPin = 10;
double duration;
float distance;

void setup()
{
    Serial.begin(9600);
    pinMode(echoPin, INPUT);
    pinMode(trigPin, OUTPUT);
}

void loop()
// If information is available in Serial port from arduino get it and then checking for the distance
{   if (Serial.available()>0)
{
    msg=Serial.readString() ;
    if(msg=="d")
      {
        digitalWrite(trigPin, LOW);
        delayMicroseconds(2);
        digitalWrite(trigPin, HIGH);
        delayMicroseconds(10);
        digitalWrite(trigPin, LOW);
        duration = pulseIn(echoPin, HIGH);
        distance= duration/29/2;
        Serial.println(distance);
       }
    else
      int i=0; // Just Do nothing.....(Never Mind statement !!! )

}
}
Python Code for impulse removal:
# collecting data and saving it as a list in rawData
rawData = ardata(7,lines=50,dynamic=True,msg='d')  # if set is not used, the most repeated set of value would be taken as average !

# rawHybrid contains hybridized form of rawData
rawHybrid = hybridize( rawData )
print(rawHybrid)
filteredHybrid = filter(rawHybrid,expectedType='num',limit=[0,200],maxDeviation=5,frequentAverage=True)
print("")
print(filteredHybrid)

Graph(hybridize(rawData))
Graph(filteredHybrid)
compGraph(rawHybrid,filteredHybrid)
You can also detect and measure impulses !!!
Arduino Code is same as the above one ! Python code for impulse detection and measurement is :
# collecting data and saving it as a list in rawData
rawData = ardata(7,lines=50,dynamic=True,msg='d')  # if set is not used, the most repeated set of value would be taken as average !

# rawHybrid contains hybridized form of rawData
rawHybrid = hybridize( rawData )
print(rawHybrid)
filteredHybrid = filter(rawHybrid,expectedType='num',limit=[0,200],maxDeviation=7,closeTo=20) # since  I know impulse are going to be near 20 cm from the ultrasonic sensor !
print("")
print(filteredHybrid)

Graph(hybridize(rawData))
Graph(filteredHybrid)
compGraph(rawHybrid,filteredHybrid)
Developed by SAYAD PERVEZ !!!
Trust me Am just 17.

EmailID : [pervez2504@gmail.com]
Release history Release notifications | RSS feed


Download files
Download the file for your platform. If you're not sure which to choose, learn more about installing packages.
Source Distribution
Built Distribution
Filter files by name, interpreter, ABI, and platform.
If you're not sure about the file name format, learn more about wheel file names.
Copy a direct link to the current filters
File details
Details for the file Arduino_Master_Delta-1.tar.gz.
File metadata
- Download URL: Arduino_Master_Delta-1.tar.gz
- Upload date:
- Size: 34.8 kB
- Tags: Source
- Uploaded using Trusted Publishing? No
- Uploaded via: twine/1.13.0 pkginfo/1.5.0.1 requests/2.20.1 setuptools/41.0.1 requests-toolbelt/0.9.1 tqdm/4.32.1 CPython/3.7.0
File hashes
| Algorithm | Hash digest | |
|---|---|---|
| SHA256 |
2f30d908647251546d245b58ae0200a088e548de23b34b4422260bb8a4589566
|
|
| MD5 |
cae682a8ac086017e4bcc875be026ddf
|
|
| BLAKE2b-256 |
0627736a4aa1cedf6ac1df343cbed16b96a695150545219354176e77315e3317
|
File details
Details for the file Arduino_Master_Delta-1-py3-none-any.whl.
File metadata
- Download URL: Arduino_Master_Delta-1-py3-none-any.whl
- Upload date:
- Size: 17.2 kB
- Tags: Python 3
- Uploaded using Trusted Publishing? No
- Uploaded via: twine/1.13.0 pkginfo/1.5.0.1 requests/2.20.1 setuptools/41.0.1 requests-toolbelt/0.9.1 tqdm/4.32.1 CPython/3.7.0
File hashes
| Algorithm | Hash digest | |
|---|---|---|
| SHA256 |
5a5e723525f7a7d217de28615ca3f76913ced0ed5d688cda0ccce887a3a378ec
|
|
| MD5 |
e596f1e1ff8c535a19cd56b9012b2ef5
|
|
| BLAKE2b-256 |
b26d8c47c4981d5d25dbf80b8d2d3e6b606c0c160b1be53106dfd59acea1e5fc
|


