Adaptive Density Peak Tree Clustering
Project description
Introduction
Spatiotemporal raster (STR) data employ an array of grids (i.e., raster cube) to represent temporally changed and spatially distributed information, and it is usually used in recording environmental variables and socioeconomic indices. To reveal the geographic patterns embedded in STR data, the Clustering by Fast Search and Finding of Density Peaks (CFSFDP) algorithm is considered to be effective and suitable. However, limitations still exist in this algorithm. Targeting the selection of centers, the support of a large volume of data, and the measurement of spatial-temporal-attribute coupled distance, we proposed an improved method (Spatial Temporal - Adaptive Density Peak Tree Clustering, ST-ADPTC). A strategy for automatically selecting clustering centers is introduced based on adaptive density peak tree segmentation. The k-nearest neighbors (kNN) method is employed to decrease the memory usage when facing big data. Moreover, the neighborhood of coupled spatial, temporal, and attributes is constructed to calculate the local density and to find clusters with their time-varying behaviors. Based on the proposed method, we developed an open-source Python package (Geo_ADPTC) to assist users conducting clustering analysis for STR data. Experiments on benchmarking datasets show the improvement of autoselection of clustering centers. A case study on sea surface temperature data shows that it is feasible and effective to explore spatial and temporal distribution patterns using the proposed method.
Composition of GEO_ADPTC
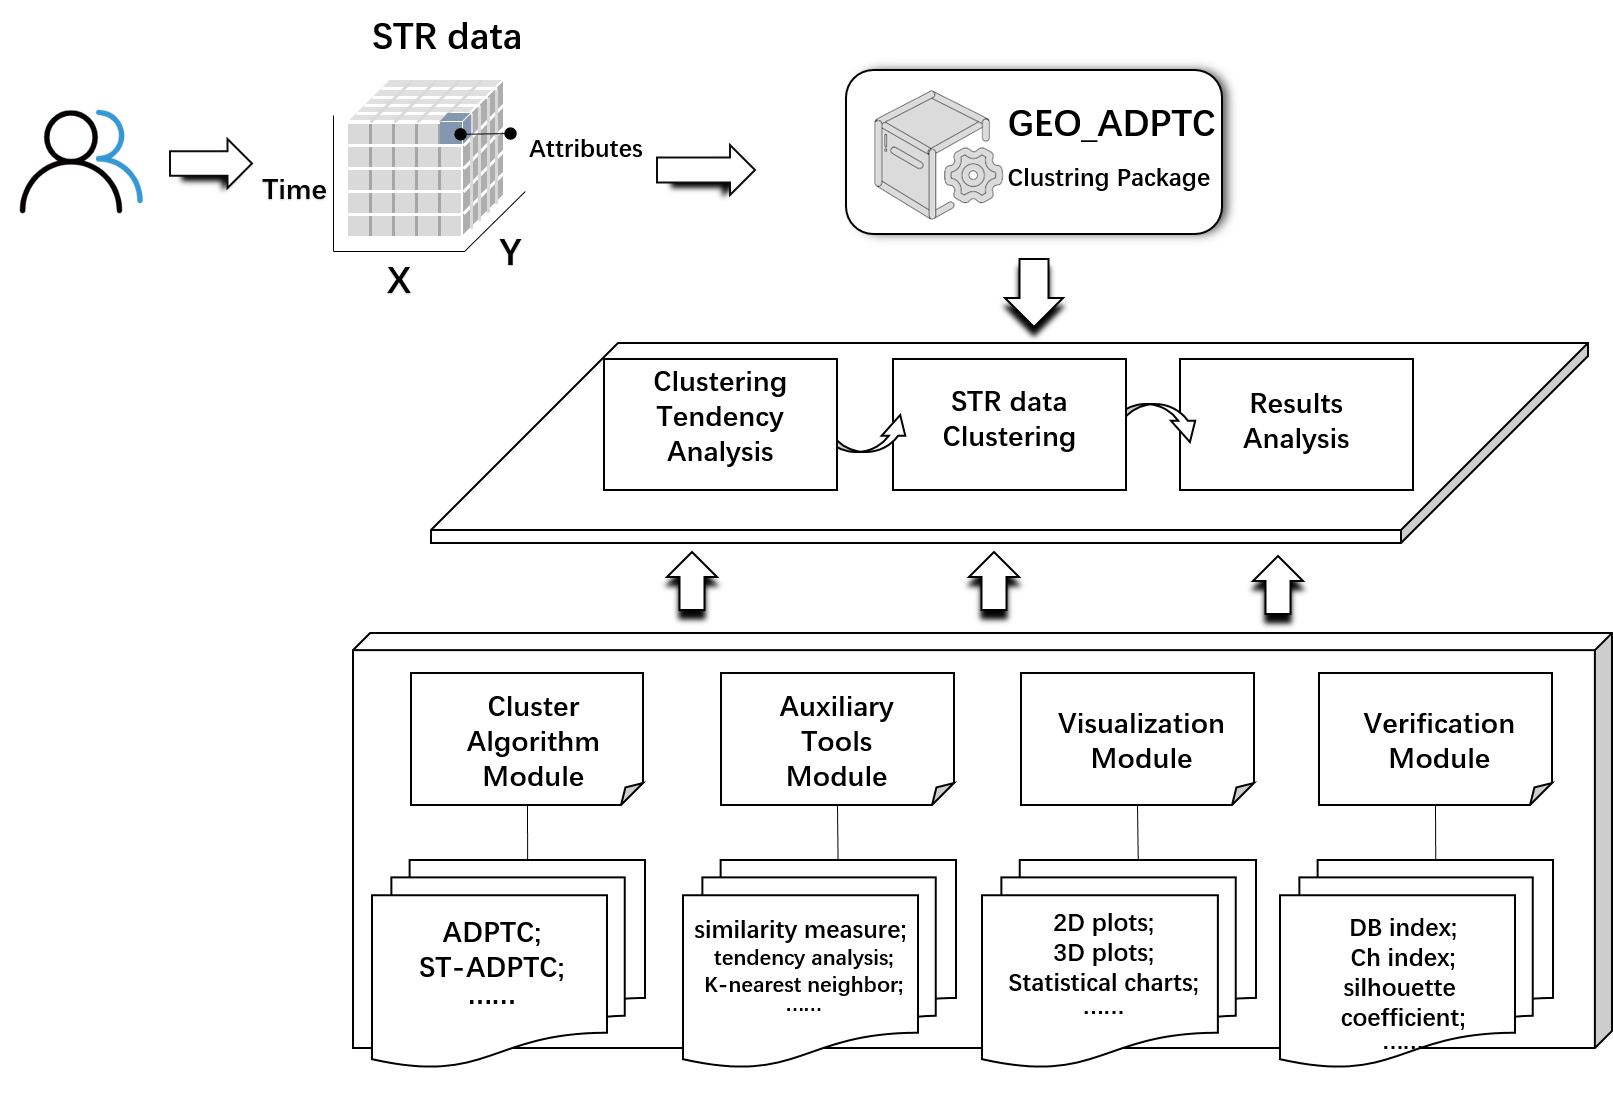
To help clustering analysis of STR data, the ST-ADPTC method is implemented in Python along with some functions that support exploration (data visualization, clustering tendency, evaluation of clustering results, etc.). The open source package, named Geo_ADPTC, has four major modules: the cluster algorithm module, auxiliary tool module, visualization module and validation module.
-
Cluster Algorithm Module: Provides interfaces for the clustering algorithm described in this paper, including the ADPTC clustering algorithm and ST-ADPTC clustering algorithm.
-
Auxiliary Tools Module: The main functions include preprocessing of the dataset, clustering tendency analysis, similarity measure functions (Euclidean distance, Manhattan distance, Mahalanobis distance, cosine similarity, etc.), local density functions (cutoff density and Gaussian density), and the kNN algorithm.
-
Visualization Module: Provides a variety of visualization methods to assist users in analyzing the clustering results, including two-dimensional plots, three-dimensional scatter plots and some statistical analysis charts, such as box charts and violin charts; additionally, it includes the auxiliary decision graph of the classical density peak algorithm.
-
Verification Module: A series of methods are provided to quantitatively evaluate the clustering results, including the DB index, CH index, silhouette coefficient, etc.
Project details
Release history Release notifications | RSS feed
Download files
Download the file for your platform. If you're not sure which to choose, learn more about installing packages.
Source Distribution
Built Distribution
Hashes for GEO_ADPTC-0.0.4-py3-none-any.whl
| Algorithm | Hash digest | |
|---|---|---|
| SHA256 | 563a8fd8be54169d1859a80f1c7feab1d9273b02ab85971de412678f760d96fd |
|
| MD5 | 7e41f26f438c32586dc51a3796a6874f |
|
| BLAKE2b-256 | 2ab7680b9c59acc27b42a6435bf6bb2c53e1e9dcd8bb0b40ac4c28f406f6df23 |


