
MetaArray
MetaArray is a class that extends ndarray, adding support for per-axis metadata storage. This class is useful for storing data arrays along with units, axis names, column names, axis values, etc. MetaArray objects can be indexed and sliced arbitrarily using named axes and columns.
Justification
Consider data in the following shape:
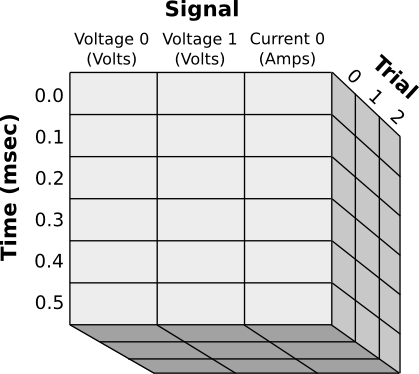
Notice that each axis has a name and can store different types of meta information:
- The Signal axis has named columns with different units for each column
- The Time axis associates a numerical value with each row
- The Trial axis uses normal integer indexes
Data from this array would best be accessed variously using those names:
initial_v1s = data[:, "Voltage 1", 0]
trial1_v0 = data["Trial": 1, "Signal": "Voltage 0"]
time3_to_7 = data["Time": slice(3, 7)]
Features
- Per axis meta-information:
- Named axes
- Numerical values with units (e.g., "Time" axis above)
- Column names/units (e.g., "Signal" axis above)
- Indexing by name:
- Index each axis by name, so there is no need to remember order of axes
- Within an axis, index each column by name, so there is no need to remember the order of columns
- Read/write files easily (in HDF5 format)
- Append, extend, and sort convenience functions
Documentation
Installation
pip install MetaArray
Instantiation
Accepted Syntaxes:
# Constructs MetaArray from a preexisting ndarray with the provided info
MetaArray(ndarray, info)

# Constructs MetaArray from file written using MetaArray.write()
MetaArray(file='fileName')
info parameter: This parameter specifies the entire set of metadata for this MetaArray and must follow a specific
format. First, info is a list of axis descriptions:`
info = [axis1, axis2, axis3, ...]
Each axis description is a dict which may contain:
- "name": the name of the axis
- "values": a list or 1D ndarray of values, one per index in the axis
- "cols": a list of column descriptions
[col1, col2, col3, ...] - "units": the units associated with the numbers listed in "values"
All of these parameters are optional. A column description, likewise, is a dict which may contain:
- "name": the name of the column
- "units": the units for all values under this column
In the case where meta information is to apply to the entire array, (for example, if the entire array uses the same units) simply add an extra axis description to the end of the info list. All dicts may contain any extra information you want.
For example, the data set depicted above would look like:
MetaArray((3, 6, 3), dtype=float, info=[
    {"name": "Signal", "cols": [
        {"name": "Voltage 0", "units": "V"},
        {"name": "Voltage 1", "units": "V"},
        {"name": "Current 0", "units": "A"}
    ]
     },
    {"name": "Time", "units": "msec", "values": [0.0, 0.1, 0.2, 0.3, 0.4, 0.5]},
    {"name": "Trial"},
    {"note": "Just some extra info"}
]
Accessing Data
Data can be accessed through a variety of methods:
- Standard indexing -- You may always just index the array exactly as you would any ndarray
- Named axes -- If you don't remember the order of axes, you may specify the axis to be indexed or sliced like this:
data["AxisName": index]
data["AxisName": slice(...)]
Note that since this syntax hijacks the original slice mechanism, you must specify a slice using slice() if you want to use named axes.
- Column selection--If you don't remember the index of a column you wish to select, you may substitute the column's name for the index number. Lists of column names are also acceptable. For example:
data["AxisName": "ColumnName"]
data["ColumnName"]  # Works only if the named column exists for this axis
data[["ColumnName1", "ColumnName2"]]
- Boolean selection--works as you might normally expect, for example:
sel = data["ColumnName", 0, 0] > 0.2
data[sel]
- Access axis values using MetaArray.axisValues(), or .xvals() for short.
- Access axis units using .axisUnits(), column units using .columnUnits()
- Access any other parameter directly through the info list with .infoCopy()
File I/O
data.write('fileName')
newData = MetaArray(file='fileName')
Performance Tips
MetaArray is a subclass of ndarray which overrides the __getitem__ and __setitem__ methods. Since these methods must
alter the structure of the meta information for each access, they are quite slow compared to the native methods. As a
result, many builtin functions will run very slowly when operating on a MetaArray. It is recommended, therefore, that
you recast your arrays before performing these operations like this:
data = MetaArray(...)
data.mean()  # very slow
data.view(ndarray).mean()  # native speed
Plotting
MetaArray supports interactive visualization through pyqtgraph. To use plotting features, install the optional plotting dependencies:
pip install MetaArray[plotting]
Basic Plotting
The MetaArrayPlotWidget provides automatic visualization of 2D MetaArray data:
from MetaArray import MetaArray
from MetaArray.plotting import MetaArrayPlotWidget
from pyqtgraph.Qt import QtWidgets
import numpy as np

# Create sample data
data = np.random.randn(100, 3)
info = [
    {"name": "Time", "units": "s", "values": np.linspace(0, 1.0, 100)},
    {
        "name": "Signal",
        "cols": [
            {"name": "Voltage 0", "units": "V"},
            {"name": "Voltage 1", "units": "V"},
            {"name": "Current 0", "units": "A"}
        ]
    }
]
ma = MetaArray(data, info=info)

# Create and display plot widget
app = QtWidgets.QApplication([])
widget = MetaArrayPlotWidget()
widget.plot(ma)
widget.show()
app.exec()
Features
- Automatic multi-plot layout: Each column in your MetaArray is displayed as a separate subplot
- Axis labels from metadata: Plot labels and units are automatically extracted from the array info
- Scrollable plots: When you have many subplots, the widget provides scroll bars for easy navigation
- Configurable minimum height: Use
setMinimumPlotHeight()to control the minimum height for each subplot
widget = MetaArrayPlotWidget()
widget.setMinimumPlotHeight(100)  # Set minimum height in pixels
widget.plot(ma)
Plot Customization
You can pass standard pyqtgraph plotting arguments to customize the appearance:
# Plot with custom pen color and symbols
widget.plot(ma, pen='r', symbol='o', symbolSize=5)
Using MetaArrayPlotItem Directly
For more control, you can use MetaArrayPlotItem directly within your own pyqtgraph layouts:
from MetaArray.plotting import MetaArrayPlotItem
import pyqtgraph as pg

win = pg.GraphicsLayoutWidget()
plot_item = MetaArrayPlotItem()
win.setCentralItem(plot_item)
plot_item.plot(ma)
win.show()
More Examples
A 2D array of altitude values for a topographical map might look like
info = [
    {'name': 'lat', 'title': 'Latitude'},
    {'name': 'lon', 'title': 'Longitude'},
    {'title': 'Altitude', 'units': 'm'}
]
In this case, every value in the array represents the altitude in feet at the lat, lon position represented by the array index. All of the following return the value at lat=10, lon=5:
array[10, 5]
array['lon': 5, 'lat': 10]
array['lat': 10][5]
Now suppose we want to combine this data with another array of equal dimensions that represents the average rainfall for each location. We could easily store these as two separate arrays or combine them into a 3D array with this description:
info = [
    {
        'name': 'vals',
        'cols': [
            {'name': 'altitude', 'units': 'm'},
            {'name': 'rainfall', 'units': 'cm/year'},
        ],
    },
    {'name': 'lat', 'title': 'Latitude'},
    {'name': 'lon', 'title': 'Longitude'},
]
We can now access the altitude values with array[0] or array['altitude'], and the rainfall values with array[1]
or array['rainfall']. All of the following return the rainfall value at lat=10, lon=5:
array[1, 10, 5]
array['lon': 5, 'lat': 10, 'val': 'rainfall']
array['rainfall', 'lon': 5, 'lat': 10]
Notice that in the second example, there is no need for an extra (4th) axis description since the actual values are described (name and units) in the column info for the first axis.
Contact
Luke Campagnola - [firstname][lastname]@gmail.com
Changelog
2.2.2
- Add pyqtgraph plotting widgets for MetaArray visualization
- Fix class inheritance bug in MultiPlotItem
- Add comprehensive test suite for plotting functionality
- Add plotting documentation to README
2.2.0
- Support for abs and other unary operations.
- Bugfix to handle modern numpy
2.1.1
Fix writeable HDF5.
2.1.0
Force hdf5 format when writing unless USE_HDF5 is explicitly set to False.
2.0.3
Fixes install dependency (thanks @spahlimi).
2.0.0
Initial independent release.
2 maintainers


Metadata
2 maintainers
Release files for MetaArray 2.2.2
For a detailed explanation of source distributions (sdists) and built distributions (wheels), please see the package formats documentation.
Source distribution (sdist)
| File | Size | Uploaded | |
|---|---|---|---|
| metaarray-2.2.2.tar.gz | 58.0 kB | Details |
Built distribution (wheel)
| File | Interpreter | ABI | Platform | Reset |
|---|---|---|---|---|
| metaarray-2.2.2-py3-none-any.whl | Python 3 | none | any | Details |
Total release size: 76.8 kB
Release files / metaarray-2.2.2.tar.gz
| Download URL | metaarray-2.2.2.tar.gz |
|---|---|
| Size | 58.0 kB |
| Tags | Source |
|
SHA-256 checksum How to use checksums |
4674feb2cad719d7692330676647b3e971ab7fffec3fa7ec5520eb9b5b4edaa3
|
|
BLAKE2b-256 checksum How to use checksums |
f450709c17d26940c6a9067cec005fd0a88036c97c426ae2ad7b4ac49c4abeae
|
| Upload date | |
|
Uploaded using Trusted Publishing? What is trusted publishing? |
No |
| Uploaded via |
twine/6.2.0 CPython/3.12.12
|
Release files / metaarray-2.2.2-py3-none-any.whl
| Download URL | metaarray-2.2.2-py3-none-any.whl |
|---|---|
| Size | 18.8 kB |
| Tags | Python 3 |
|
SHA-256 checksum How to use checksums |
a6f0a1a47523812dd67398e4df3fcc70da6514ea910b9de77f0dfe95401f5454
|
|
BLAKE2b-256 checksum How to use checksums |
f71ddf894dceaa7ae58bfd27f98cd7d1c6268973871a720d65b97b4060450ad1
|
| Upload date | |
|
Uploaded using Trusted Publishing? What is trusted publishing? |
No |
| Uploaded via |
twine/6.2.0 CPython/3.12.12
|














