Create a graph out of packet captures.

Project description
PcapGraph
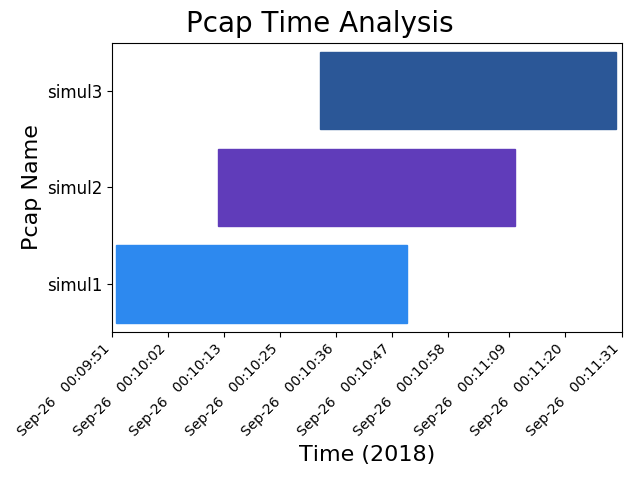
Creates bar graphs out of packet capture timestamps.
Platforms
Linux, Macos, Windows
Description
- Assists with flow-based troubleshooting where there are at least 2 pcaps. See Usage for detailed use cases and options.
- Create a horizontal bar graph to visualize when pcaps were taken.
- Use set operations to find patterns among multiple packet captures in ways that Wireshark is not able to.
- If an output format is not specified, the default behavior is to print to stdout and send a matplotlib graph to the screen (thus the name).
Official Documentation can be found at Read the Docs.
License
Apache 2.0. See LICENSE for more details.
Acknowledgements
Praise be Stack Overflow!
Release history Release notifications | RSS feed


Download files
Download the file for your platform. If you're not sure which to choose, learn more about installing packages.
Source Distribution
PcapGraph-1.3.0.tar.gz
(24.6 kB
view details)
File details
Details for the file PcapGraph-1.3.0.tar.gz.
File metadata
- Download URL: PcapGraph-1.3.0.tar.gz
- Upload date:
- Size: 24.6 kB
- Tags: Source
- Uploaded using Trusted Publishing? No
- Uploaded via: twine/1.12.1 pkginfo/1.4.2 requests/2.19.1 setuptools/40.2.0 requests-toolbelt/0.8.0 tqdm/4.26.0 CPython/3.5.2
File hashes
| Algorithm | Hash digest | |
|---|---|---|
| SHA256 |
a8318969bd1fe8c79c3c689179f84ad791e5dfff199155fcf5e0a9934a9e940f
|
|
| MD5 |
2b799063c5990c77865ca3d4177b0362
|
|
| BLAKE2b-256 |
8d5388f417739555ff5c486fa02744d8c7a0ab89c34fc9baca237b4e6cd92a16
|


