A cool plotting module in Python

Project description
PyCoolPlot
A cool plotting module in Python
What is this?
This is a plotting module in Python.
Ref:
Requirements
-
Python 3.6.x or higher
-
matplotlib
-
numpy
-
pandas
Download
Using pip
$ pip install PyCoolPlot
PyPI page:
Manual install
-
Install Python 3.6.x.
-
Clone or download as zip this repository.
-
import pycoolplot.py
How to use
The sample code might be helpful:
import
If you use pip to install PyCoolPlot, you can import it like:
from pycoolplot import pycoolplot
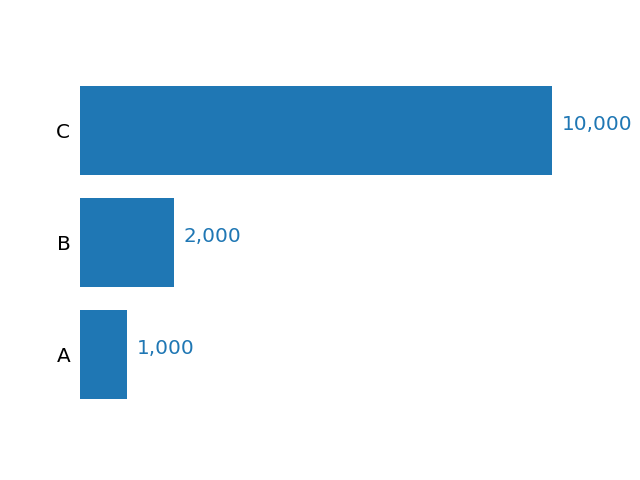
Horizontal bar plot
You can plot a beautiful horizontal bar plot like:
data = [1000, 2000, 10000]
index = ["A", "B", "C"]
pycoolplot.horizontal_bar(index, data)
pycoolplot.plt.show()
You will see:
If you want a rate bar plot, you can set rate_graph is True like:
data = [1000, 2000, 10000]
index = ["A", "B", "C"]
pycoolplot.horizontal_bar(index, data, rate_graph=True)
pycoolplot.plt.show()
You will see:

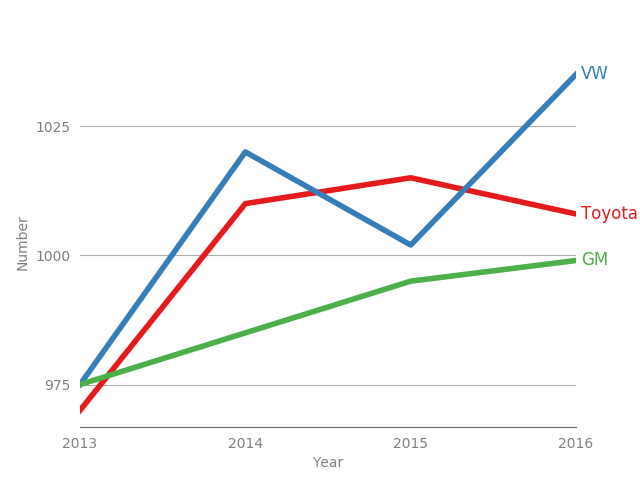
Line graph
You can plot a beautiful line graph like:
data2 = [[970, 1010, 1015, 1008],
         [975, 1020, 1002, 1035],
         [975, 985, 995, 999]]
index2 = ['Toyota', 'VW', 'GM']
columns = [2013, 2014, 2015, 2016]
ylabel = "Number"
xlabel = "Year"
pycoolplot.line_graph(data2, index2, columns, xlabel,
                      ylabel, xtick=1, ytick=25)
pycoolplot.plt.show()
You can get:
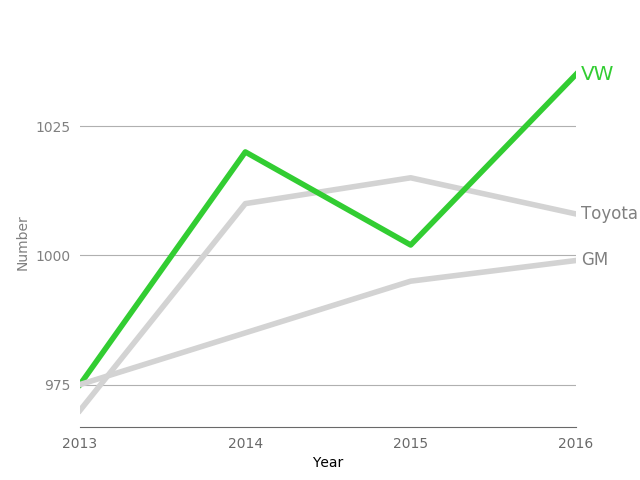
If you want to focus a line, you can set focus_id like:
data2 = [[970, 1010, 1015, 1008],
        [975, 1020, 1002, 1035],
        [975, 985, 995, 999]]
index2 = ['Toyota', 'VW', 'GM']
columns = [2013, 2014, 2015, 2016]
ylabel = "Number"
xlabel = "Year"
focus_id = 1  # the index of focusing line, in this case Toyota=0, VW=1, GM=2
pycoolplot.line_graph(data2, index2, columns, xlabel,
                      ylabel, xtick=1, ytick=25, focus_id=focus_id)
pycoolplot.plt.show()
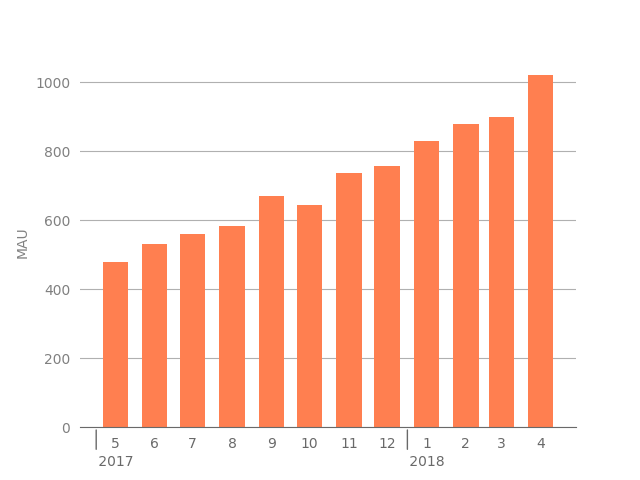
Time bar chart
You can plot a beautiful time series bar chart like:
data = pycoolplot.np.linspace(450, 990, 12) + \
    pycoolplot.np.random.randint(-50, 50, 12)
time_index = pycoolplot.pd.date_range('2017/5', periods=12, freq='MS')
pycoolplot.time_vertical_bar(data, time_index, xlabel="time", ylabel="MAU")
pycoolplot.plt.show()
License
MIT
Author
Release history Release notifications | RSS feed


Download files
Download the file for your platform. If you're not sure which to choose, learn more about installing packages.
Source Distribution
File details
Details for the file PyCoolPlot-0.1.0.tar.gz.
File metadata
- Download URL: PyCoolPlot-0.1.0.tar.gz
- Upload date:
- Size: 5.4 kB
- Tags: Source
- Uploaded using Trusted Publishing? No
- Uploaded via: twine/4.0.1 CPython/3.10.4
File hashes
| Algorithm | Hash digest | |
|---|---|---|
| SHA256 |
b90e6ac43d209fdc78b8c4ab9f9f8a080fd384da97b1105c246996d4cd4349db
|
|
| MD5 |
70a54f241711e2b4ebe06c54bc9b7bb4
|
|
| BLAKE2b-256 |
3e07f93cd6cf00d25310e1f302578a366457073abb958b0026ac3c365b2a9a7c
|


