




PyGnuplot: Python wrapper for Gnuplot
Author: Ben Schneider
Requires:
Gnuplot (http://www.gnuplot.info)
Installation:
Using pip
pip install PyGnuplotUsing conda
conda install -c benschneider pygnuplotUpgrade:
pip install --upgrade PyGnuplotBasic Usage:
from PyGnuplot import gp
figure1 = gp()  # Create a new figure handle
figure2 = gp(r"C:\Program Files\gnuplot\bin\gnuplot.exe")  # Can also specify which gnuplot to use
figure1.a("plot sin(x)")
figure2.a("plot cos(x)")
pi = figure.a("print pi")
Functions available with each figure:
c(command)
pipe a command to gnuplot as if in gnuplot command promt
c('plot sin(x)')save(data, filename=’tmp.dat’)
save arrays into file (filename = ‘tmp.dat’) easily read by Gnuplot
s([X,Y,Z]) # creates tmp.datc('plot "tmp.dat" u 1:2')a(command=’’, vtype=str, timeout=0.05)
asks gnuplot: it sends a command to gnuplot and returns its response This is paricularly handy when using gnuplots fitting features vtype can be used to change the return format timeout is the time to wait for a response
a('print pi') # returns the value of pia('print pi; print pi') # returns 2 times the value of pir(vtype=str, timeout=0.05)
reads the gnuplot return buffer until its empty
plot(data, filename=’tmp.dat’)
Plot some data. Sends plot instructions and the data to Gnuplot
plot([x,y])plot_b(data, v1=’d’, v2=’%double’)
Similar to plot: Sends plot instructions and the data to Gnuplot However it sends them in binary format, which can be beneficial when the dealing with larger quanities of numbers
p(filename=’tmp.ps’, width=14, height=9, fontsize=12, term=’x11’)
Create postscript file (overwrites existing)
p('myfile.ps')pdf(filename=’tmp.pdf’, width=14, height=9, fontsize=12, term=’x11’)
Create a pdf file (overwrites existing)
pdf('myfile.pdf')quit()
Closes windows,then gnuplot, then the pipe
Setup terminal
This script will use the same default terminal that gnuplot used (it reads the GPVAL_TERM value when gnuplot starts up) it can still be modified by the ‘default_term’ variable:
from PyGnuplot import gp
fig1 = gp()
fig1.default_term = 'wxt'
New features:
fit2d(data, func=’y(x)=a + b*x’, via=’a,b’, limit=1e-9)
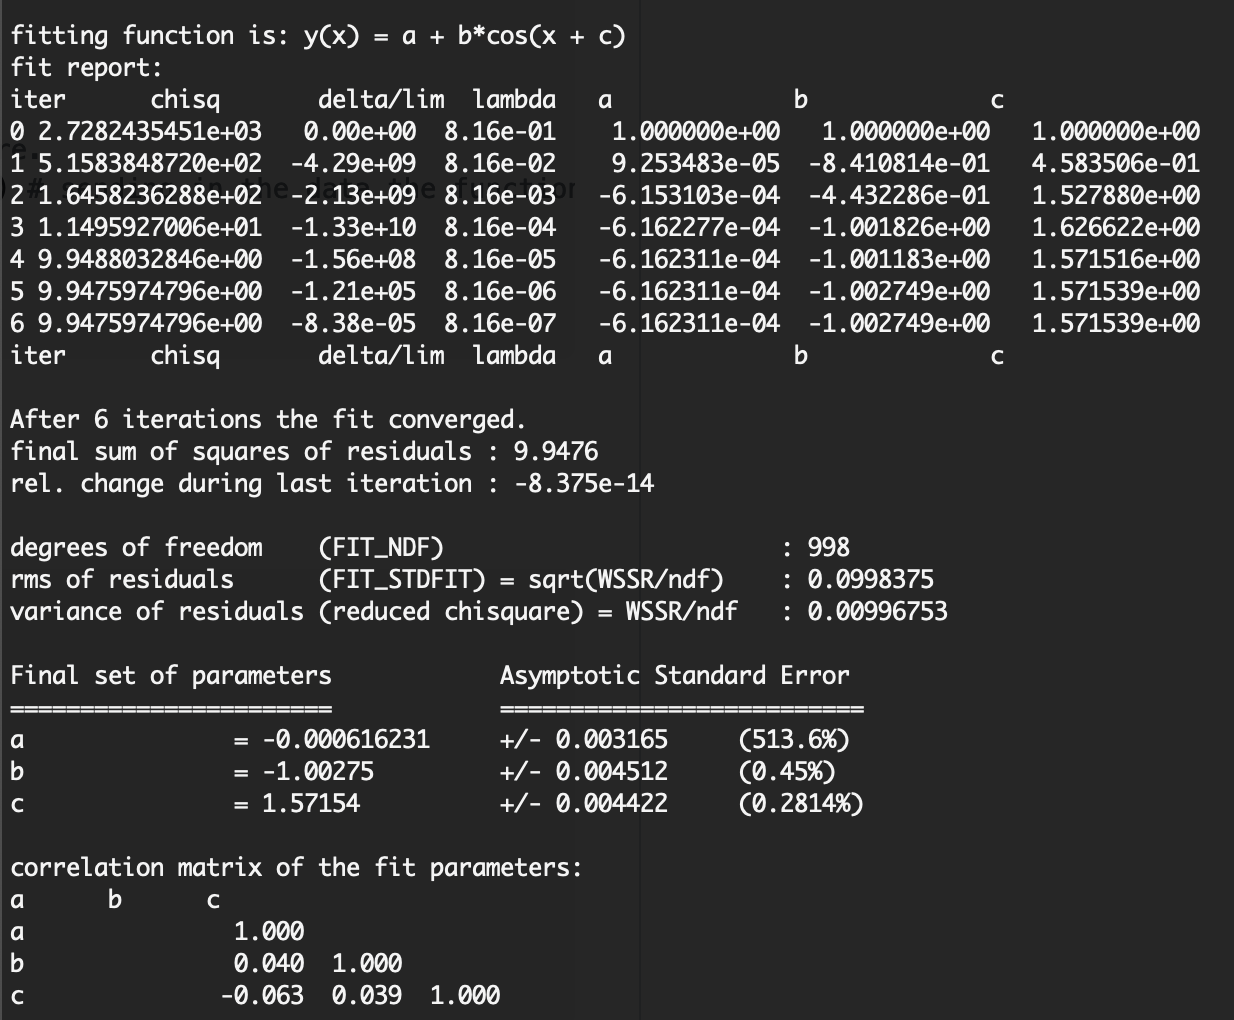
Quickly Fit a simple 2-D data set and return the fitting results. This uses the new ask function “a()” Here we gather the fitting info from gnuplot
and:
fit(self, data, func=’y(x)=a + b*x’, via=’a,b’, limit=1e-9, filename=’tmp.dat’, wait=1)
Allows for sligtly more complex fitting, filename: stores data first into a temporary file default: tmp.dat wait: define a waiting time in sec for gnuplot to finish its fitting default: 1sec
import numpy as np
f1 = gp()
x = np.linspace(0, 20, 1001)
yn = np.random.randn(1001)/10
y = np.sin(x)
data = [x, y+yn]
func = 'y(x) = a + b*cos(x + c)'  # define a fitting function here.
(a, b, c), report = f1.fit2d(data, func, via='a,b,c', limit=1e-9) # sending in the data the function used to fit and the variables that are to be found.
f1.save(data, "tmp.dat")
f1.a('plot "tmp.dat" w lp')
f1.a('replot y(x)')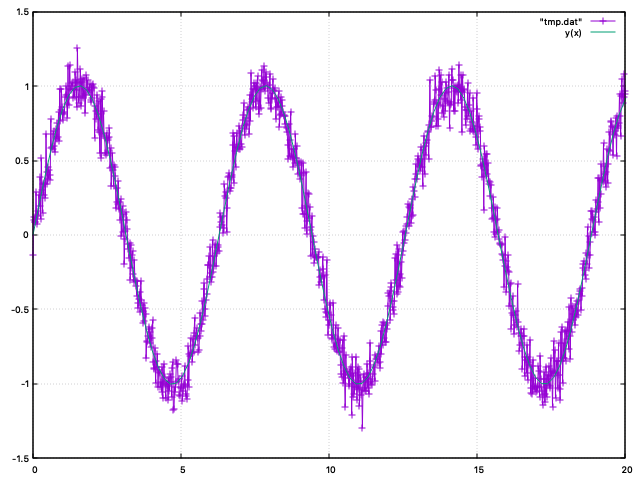
|
|
Examples:
1 Example code
from PyGnuplot import gp
import numpy as np
X = np.arange(10)
Y = np.sin(X/(2*np.pi))
Z = Y**2.0
fig1 = gp()
fig1.save([X,Y,Z])
fig1.c('plot "tmp.dat" u 1:2 w lp)
fig1.c('replot "tmp.dat" u 1:3' w lp)
fig1.p('myfigure.ps')
2 Example file
python example.py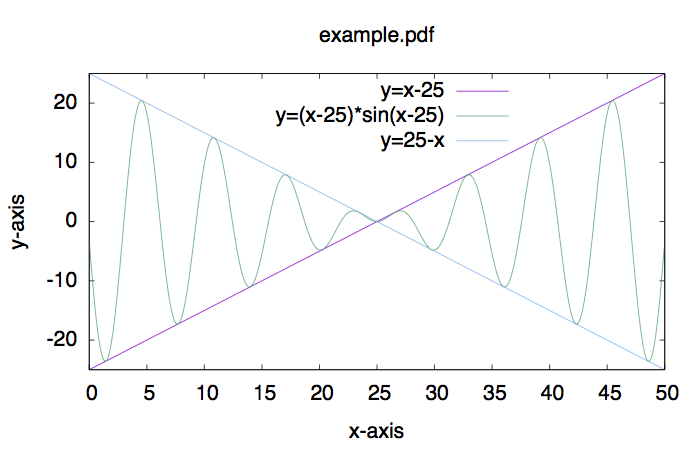
|
1 maintainer

Metadata
1 maintainer
Release files for PyGnuplot 0.12.3
For a detailed explanation of source distributions (sdists) and built distributions (wheels), please see the package formats documentation.
Source distribution (sdist)
| File | Size | Uploaded | |
|---|---|---|---|
| PyGnuplot-0.12.3.tar.gz | 7.0 kB | Details |
Built distribution (wheel)
| File | Interpreter | ABI | Platform | Reset |
|---|---|---|---|---|
| PyGnuplot-0.12.3-py3-none-any.whl | Python 3 | none | any | Details |
Total release size: 14.0 kB
Release files / PyGnuplot-0.12.3.tar.gz
| Download URL | PyGnuplot-0.12.3.tar.gz |
|---|---|
| Size | 7.0 kB |
| Tags | Source |
|
SHA-256 checksum How to use checksums |
a39be2599a4a13da85fcc62b600fc2c0c7d8f50301b6e3faf417fbdb5060484c
|
|
BLAKE2b-256 checksum How to use checksums |
13d9152e142aed8bbd03438a1b833b1c3e0078301b5707e074a208133e02d87e
|
| Upload date | |
|
Uploaded using Trusted Publishing? What is trusted publishing? |
No |
| Uploaded via |
twine/4.0.1 CPython/3.10.6
|
Release files / PyGnuplot-0.12.3-py3-none-any.whl
| Download URL | PyGnuplot-0.12.3-py3-none-any.whl |
|---|---|
| Size | 7.0 kB |
| Tags | Python 3 |
|
SHA-256 checksum How to use checksums |
059b58421436b77512be2c1bb13b9423bce0f48f0107e11444e0fccba3dc6787
|
|
BLAKE2b-256 checksum How to use checksums |
59b055af234b0b9aa3a39bdbd10f3d0c92cfe4ecb13204291390252c6a63e9a5
|
| Upload date | |
|
Uploaded using Trusted Publishing? What is trusted publishing? |
No |
| Uploaded via |
twine/4.0.1 CPython/3.10.6
|














