Quickly draw segmentation dataset

Project description
PyplotAnnotation
Introduction
The goal of the library is to create a software for quick annotation. More specifically, it is used for the generation of a segmentation dataset. The application shows images in a pyplot window and asks the user to choose a class, choose points to draw a polygon, and validate.
The application support up to nine classes, multiple polygons per label, and multiple labels per class.
Requirements
- matplotlib
- pillow
- fire
How to use
The command line
To run the application, write the following command to the cmd:
python PyplotAnnotation {arg1} {arg2} {arg3}
- {arg1} describes the path of the picture to segment, as recognized by glob. The default value is "*.png", which correspond to the .png in the current working directory.
- {arg2} is the name of the folder in which the input of the dataset will be written.
- {arg3} is the name of the folder in which the output of the dataset (the masks) will be written.
Example:
python -m PyplotAnnotation.PyplotAnnotation *.png inputs masks
Legal actions
The application follows a quite simple automaton:
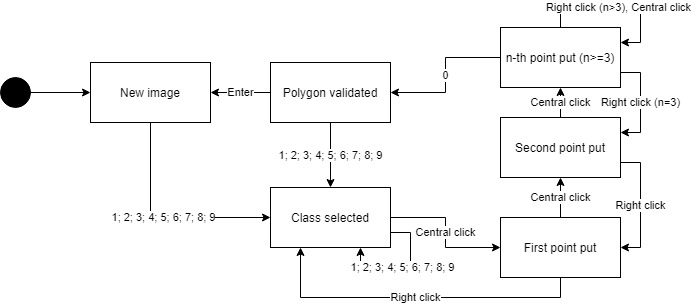
New image state (initial state)
Actions performed on entering the state
- A new picture is plotted.
- The current polygons are initialized to a void list.
If coming from Polygon validated:
- Save the picture inside the input_folder.
- Save the masks (one per used class) to the mask_folder.
If these files already exist, they will be overwritten.
Leaving the state
| Input | State |
|---|---|
| 1, 2, 3, 4, 5, 6, 7, 8, 9 | Class selected |
Class selected state
Actions performed on entering the state
- The class of the current polygon is set to the input used to access this state.
Leaving the state
| Input | State |
|---|---|
| 1, 2, 3, 4, 5, 6, 7, 8, 9 | Class selected |
| Central click | First point put |
First point put state
Actions performed on entering the state
If coming from Class selected:
- A point is added to the polygon.
- The point is plotted on the picture.
If coming from Second point put:
- The second point is removed.
- The line between the second and first point is removed.
Leaving the state
| Input | State |
|---|---|
| Central click | Second point put |
| Right click | Class selected |
Second point put state
Actions performed on entering the state
If coming from First point put:
- A point is added to the polygon.
- The point is plotted on the picture.
- A line between the first and second point is plotted.
If coming from n-th point put:
- The third point is removed.
- The line between the third and second point is removed.
Leaving the state
| Input | State |
|---|---|
| Central click | n-th point put |
| Right click | First point put |
n-th point put state
Actions performed on entering the state
If coming with a central click:
- A point is added to the polygon.
- The point is plotted on the picture.
- A line between the two last point is plotted.
- If coming from Second point put, set n at 3
- If coming from n-th point put, set n at n+1
If coming with a right click:
- The last point is removed.
- The line between the last and second last point is removed.
- Set n at n-1.
Leaving the state
| Input | State |
|---|---|
| 0 | Polygon validated |
| Central click | n-th point put |
| Right click | n-th point put |
| Right click | Second point put |
When using "Right click" : if n is three, go to "Second point put"-state, else go to "n-th point put".
Polygon validated state
Actions performed on entering the state
The current polygon is saved (now, it cannot be modified). A new polygon is initialized.
Leaving the state
| Input | State |
|---|---|
| Enter | New image |
| 1, 2, 3, 4, 5, 6, 7, 8, 9 | Class selected |
Format of the output
After the acceptation of each picture, multiple files are created.
- First, a new image is generated in the input_folder, with the same name as the picture except that the extension is forced to be .png.
- Second, the mask files are generated. Localised in the mask_folder, one of them as the same name as the same name as the input : this is the concatenation of each mask. Other files are created, one by class used. For each mask, the background is set at 0 while the mask is set at 255. Of course, the masks only have one canal each.
Examples
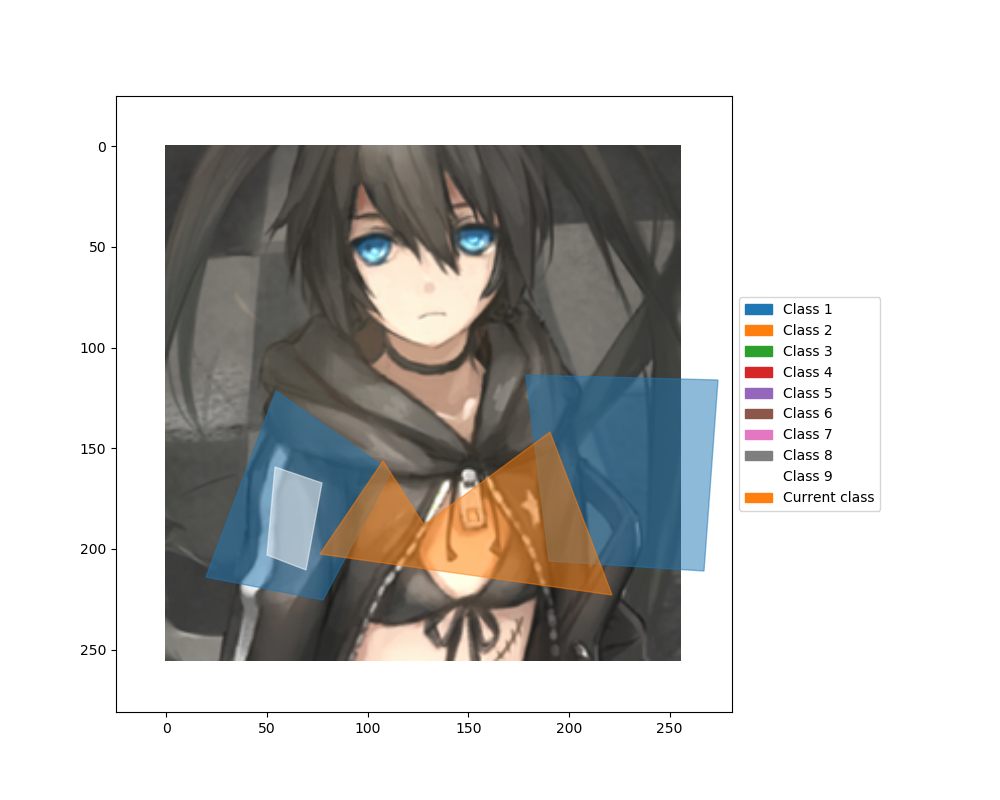
Credit for xiao_qiang (#pixiv1754781) for drawing the picture we use in example.
So, here is the figure plotted by the program. You can see the polygons created for the classes 1, 2 and 9. The 9-th class act as a eraser of any other layer. On the side, the legend contains the color of each class and the currently selectionned class.
Multiple polygons can be draw for a single label. You can use multiple labels on a single images, and also put points outside the picture.
In the mask_folder, the following files are created.
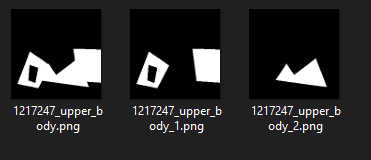
The first one is the concatenation of each class. The two other the segmentation of the classes 1 and 2. The class 9 has no file of his own but the mask of the first class is altered by the erasion of a part.
Release history Release notifications | RSS feed


Download files
Download the file for your platform. If you're not sure which to choose, learn more about installing packages.
Source Distribution
File details
Details for the file PyplotAnnotation-1.1.1.tar.gz.
File metadata
- Download URL: PyplotAnnotation-1.1.1.tar.gz
- Upload date:
- Size: 18.4 kB
- Tags: Source
- Uploaded using Trusted Publishing? No
- Uploaded via: twine/4.0.1 CPython/3.9.7
File hashes
| Algorithm | Hash digest | |
|---|---|---|
| SHA256 |
40b50910a621f8e3438529472299694ce91433e35d796ccd0254619b87a52931
|
|
| MD5 |
57d3555e468089da0cd9b87bc221b1e8
|
|
| BLAKE2b-256 |
5c27e9bc0d6a44f9077cd40ea55b63445f0e2d45f086d02151c7f5763b613133
|


