Tool for plotting visualizations from Pandas DataFrame

Project description
VizPack
VizPack is a Visualization package with necessary tools for plotting visualizations from Pandas DataFrame
Data Visualization
- To install the VizPack project, run this command in your terminal:
$ pip install VizPack
- Import the Visualization Class from the vizpack module, for visualizing pandas DataFrame
>>> from VizPack.vizpack import Viz_Func
- Initialize a variable to work with the Viz_Func object
>>> viz = Viz_Func()

========== Welcome to the Visualization Tool kit ==========
- Checking for Documentation
>>> help(viz)
- Examples of Valid use
Extensively Analysed here
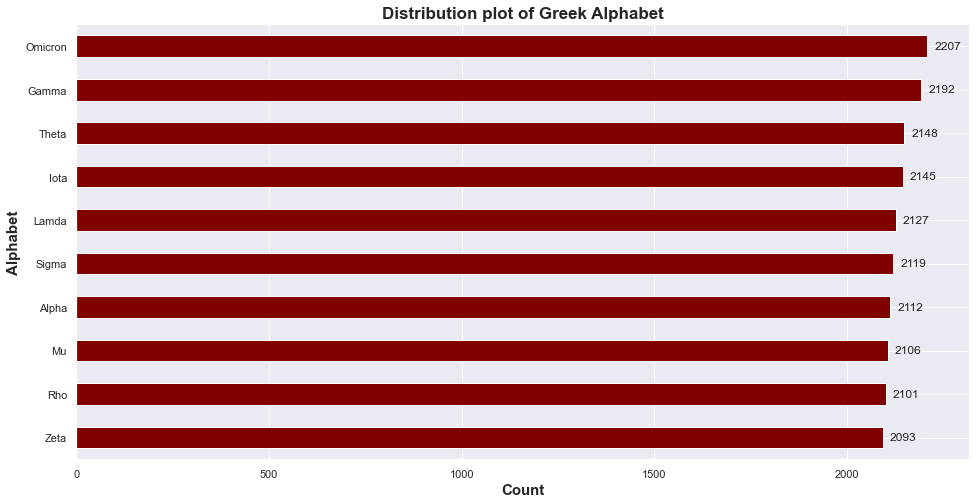
# Labelling the plot
>>> viz.label_plot(
                    title ='Distribution plot of Greek Alphabet',
                    x = 'Count',
                    y ='Alphabet')

# Plotting the Bars
>>> plots = viz.plot_bar(
                         dataset = df,
                         limit = 10,
                         column ='C',
                         horizontal = True,
                         figsize = (16,8),
                         color = 'maroon')

#Anotating the Bars
>>> viz.annot_bar(plots, horizontal = True)
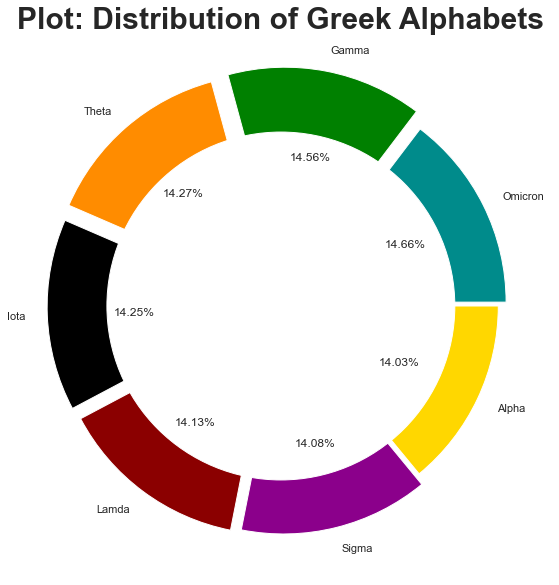
viz.plot_donut(dataset = df,
               limit = 7,
               column = 'C',
               title = 'Plot: Distribution of Greek Alphabets',
               shadow = False,
               colors = False,
               explode = False, background = 'white'
               )
Release history Release notifications | RSS feed


Download files
Download the file for your platform. If you're not sure which to choose, learn more about installing packages.
Source Distribution
VizPack-1.0.2.tar.gz
(4.3 kB
view details)
File details
Details for the file VizPack-1.0.2.tar.gz.
File metadata
- Download URL: VizPack-1.0.2.tar.gz
- Upload date:
- Size: 4.3 kB
- Tags: Source
- Uploaded using Trusted Publishing? No
- Uploaded via: twine/3.7.1 importlib_metadata/4.10.0 pkginfo/1.8.2 requests/2.26.0 requests-toolbelt/0.9.1 tqdm/4.62.3 CPython/3.9.9
File hashes
| Algorithm | Hash digest | |
|---|---|---|
| SHA256 |
79c4435f306227f71c90ee0d038a09a61ce321fc57826d665ffb0b1f6726b638
|
|
| MD5 |
5c229f24b91aaba13dcb99bceda2a17e
|
|
| BLAKE2b-256 |
d53d2eaad4aeea05e35e66e8b75add6205809bd367672f9a01934994f2c9a94c
|


