Python library for creating and drawing graphs and taking advantage of graph properties

Project description
Abstract 🕸️
Abstract is a Python library designed for creating and visualizing graphs, enabling users to leverage various graph properties effectively.
Installation
To install the library, simply run:
pip install abstract
Graph
Introduction
In computer science, a graph is an abstract data type that implements the concepts of undirected and directed graphs from mathematics, specifically within the field of graph theory. [1]
A graph data structure consists of a finite (and potentially mutable) set of vertices (or nodes) and a set of unordered pairs of these vertices for undirected graphs, or ordered pairs for directed graphs. These pairs are referred to as edges, arcs, or lines in undirected graphs, and as arrows, directed edges, directed arcs, or directed lines in directed graphs. The vertices may be part of the graph structure or may be represented externally by integer indices or references. [1]
Usage
The Graph class allows you to create nodes and edges, as well as visualize the resulting graph. Edges can have direction, indicating parent-child relationships.
To create a new graph, use the Graph() constructor:
from abstract import Graph

graph = Graph(direction='LR')
# The default direction is 'LR'; other options include 'TB', 'BT', and 'RL'.
add_node(...)
The add_node method creates a node in the graph and returns a Node object.
It accepts the following arguments:
name: The name of the new node (should be unique); snake_case is recommended.label(optional): Any string; if omitted, the name will be displayed.value(optional): Can be any object.style(optional): Should be aNodeStyleobject, used only for rendering.if_node_exists(optional): Specifies the action if a node with this name already exists; options are 'warn', 'error', or 'ignore'; the default is 'warn'.
To illustrate how the Graph class works, let's use the Rock, Paper, Scissors, Lizard, Spock game. The following list shows the order in which an object in the game defeats the object to its right and is defeated by the object to its left. Note that there are only five objects, which are repeated to demonstrate all possible pairs.
node_list = [
    'scissors', 'paper', 'rock', 'lizard', 'Spock', 'scissors',
    'lizard', 'paper', 'Spock', 'rock', 'scissors'
]
Now, let's create nodes with the same names:
# Create a set to avoid duplicates
for node in set(node_list):
    graph.add_node(name=node)

graph.display(direction='TB')  # The left-right direction is too tall.
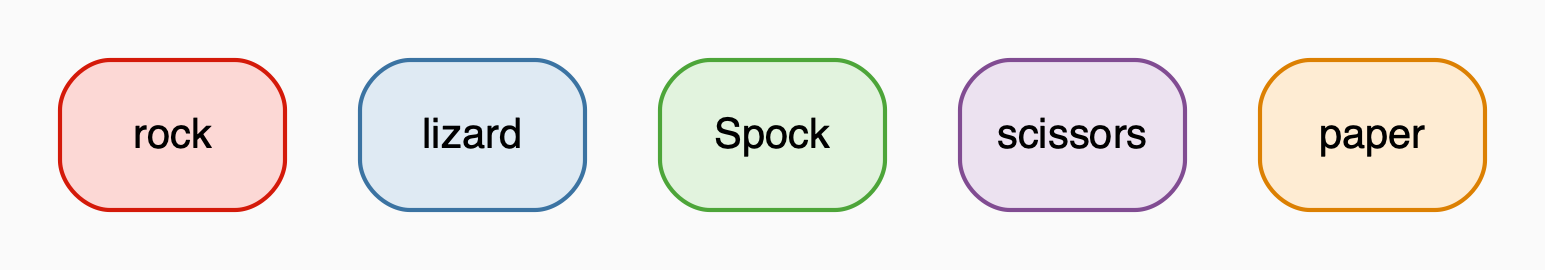
Note: By default, the Graph uses the colour theme from the colouration library for root nodes and determines the colour of other nodes based on the directionality of edges. In the above example, without any edges, all nodes are considered roots.
connect(...) (Add an Edge)
The connect method creates an edge from a start node to an end node. The start and end arguments can be either the names of nodes or the Node objects themselves.
for i in range(len(node_list) - 1):
    graph.connect(start=node_list[i], end=node_list[i + 1])
graph.display(direction='LR')  # The top-bottom direction is too tall.
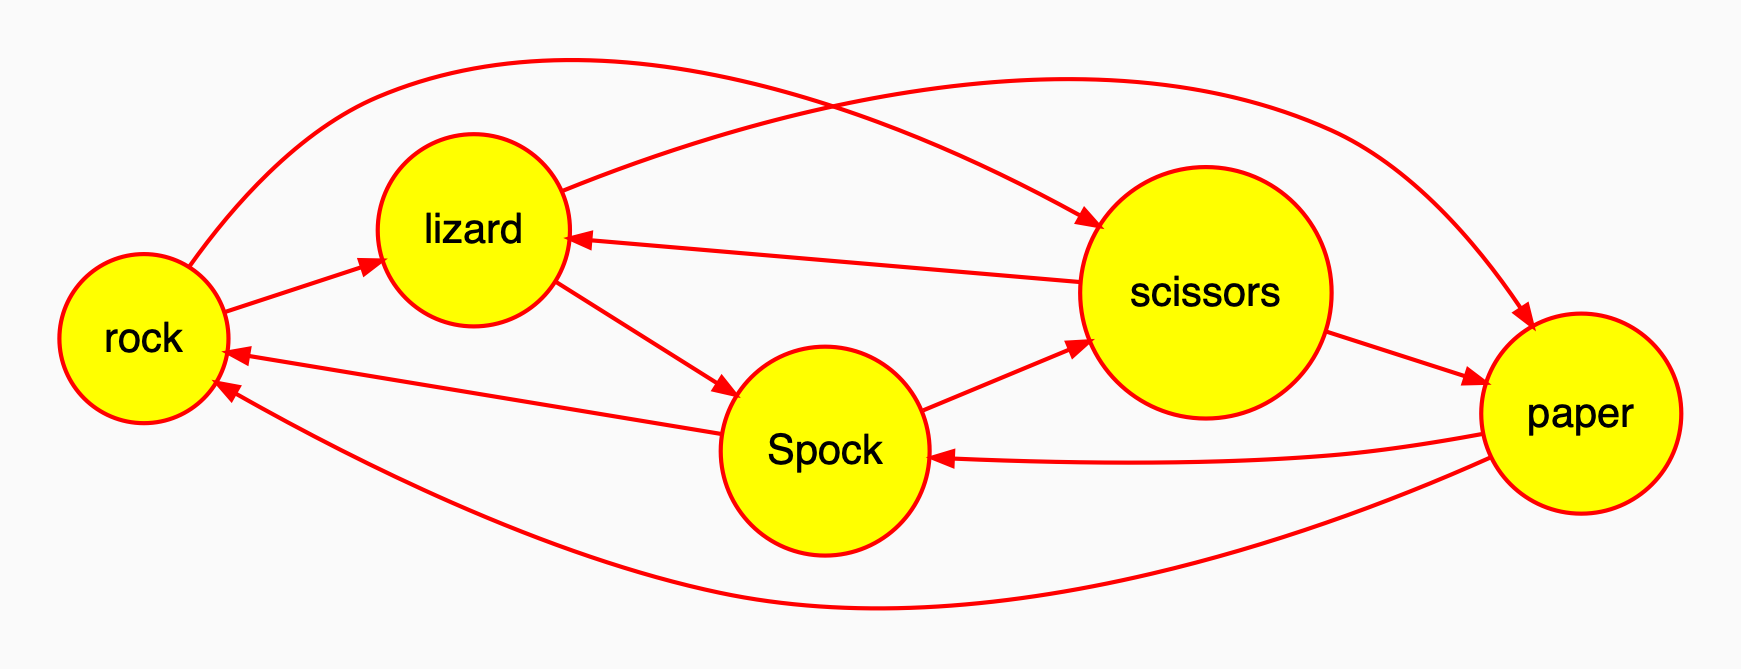
Note: Nodes that form a loop are coloured differently (red circles with yellow interiors).
get_node
To retrieve a node from the graph, use the get_node method, which returns a Node object.
rock = graph.get_node('rock')
display(...)
The display method visualizes the graph. If a path is provided, it saves the visualization to an image file, which can be in either pdf or png format. You can also specify the resolution using the dpi argument. The file format is inferred from the path argument.
# Save as a PNG file and view the file
graph.draw(path='my_graph.png', view=True)
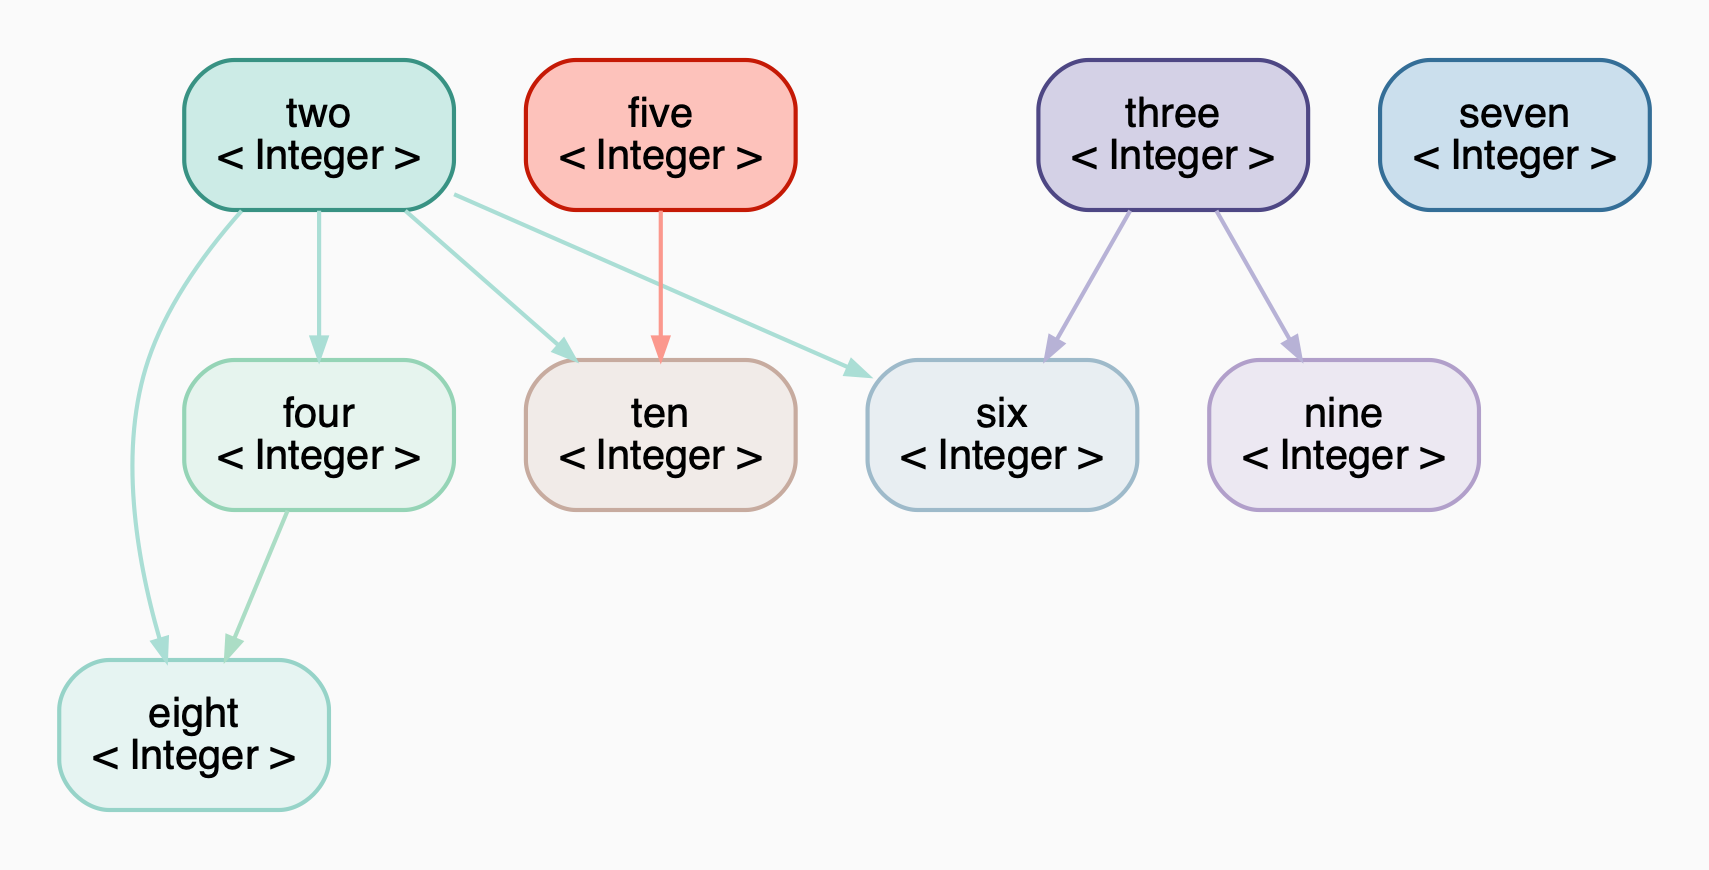
Graph(obj=...)
You can create a graph from any object that has a __graph__() method. Examples of such objects include:
Graphclass from this libraryPensieveclass from the pensieve libraryPageclass from the internet.wikipedia submodule
from pensieve import Pensieve
from abstract import Graph

pensieve = Pensieve()
pensieve['two'] = 2
pensieve['three'] = 3
pensieve['four'] = lambda two: two * two
pensieve['five'] = 5
pensieve['six'] = lambda two, three: two * three
pensieve['seven'] = 7
pensieve['eight'] = lambda two, four: two * four
pensieve['nine'] = lambda three: three * three
pensieve['ten'] = lambda two, five: two * five
graph = Graph(obj=pensieve, direction='TB')  # or Graph(pensieve)
graph.display()
random(...)
The random method creates a random graph.
g1 = Graph.random(num_nodes=8, connection_probability=0.4, seed=6)
g1
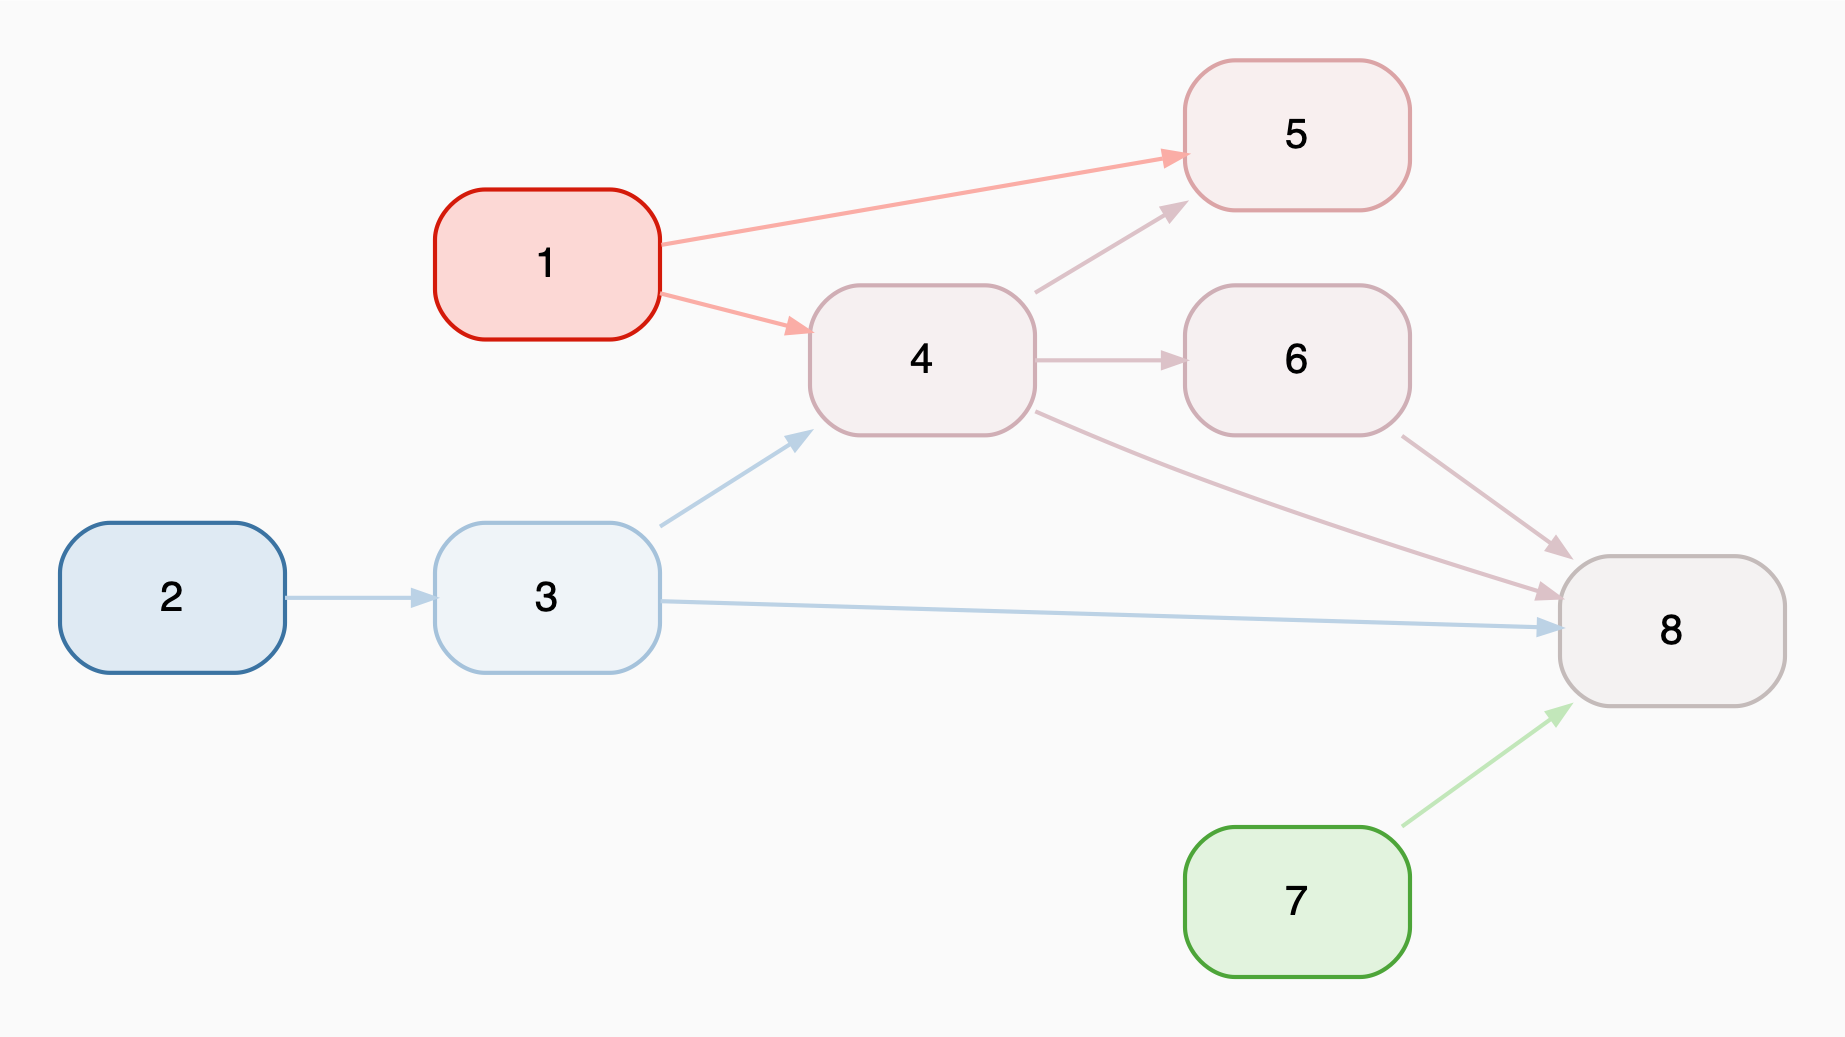
Adding Two Graphs: +
You can easily add two graphs using the + operator. The result will contain the union of nodes and edges from both graphs.
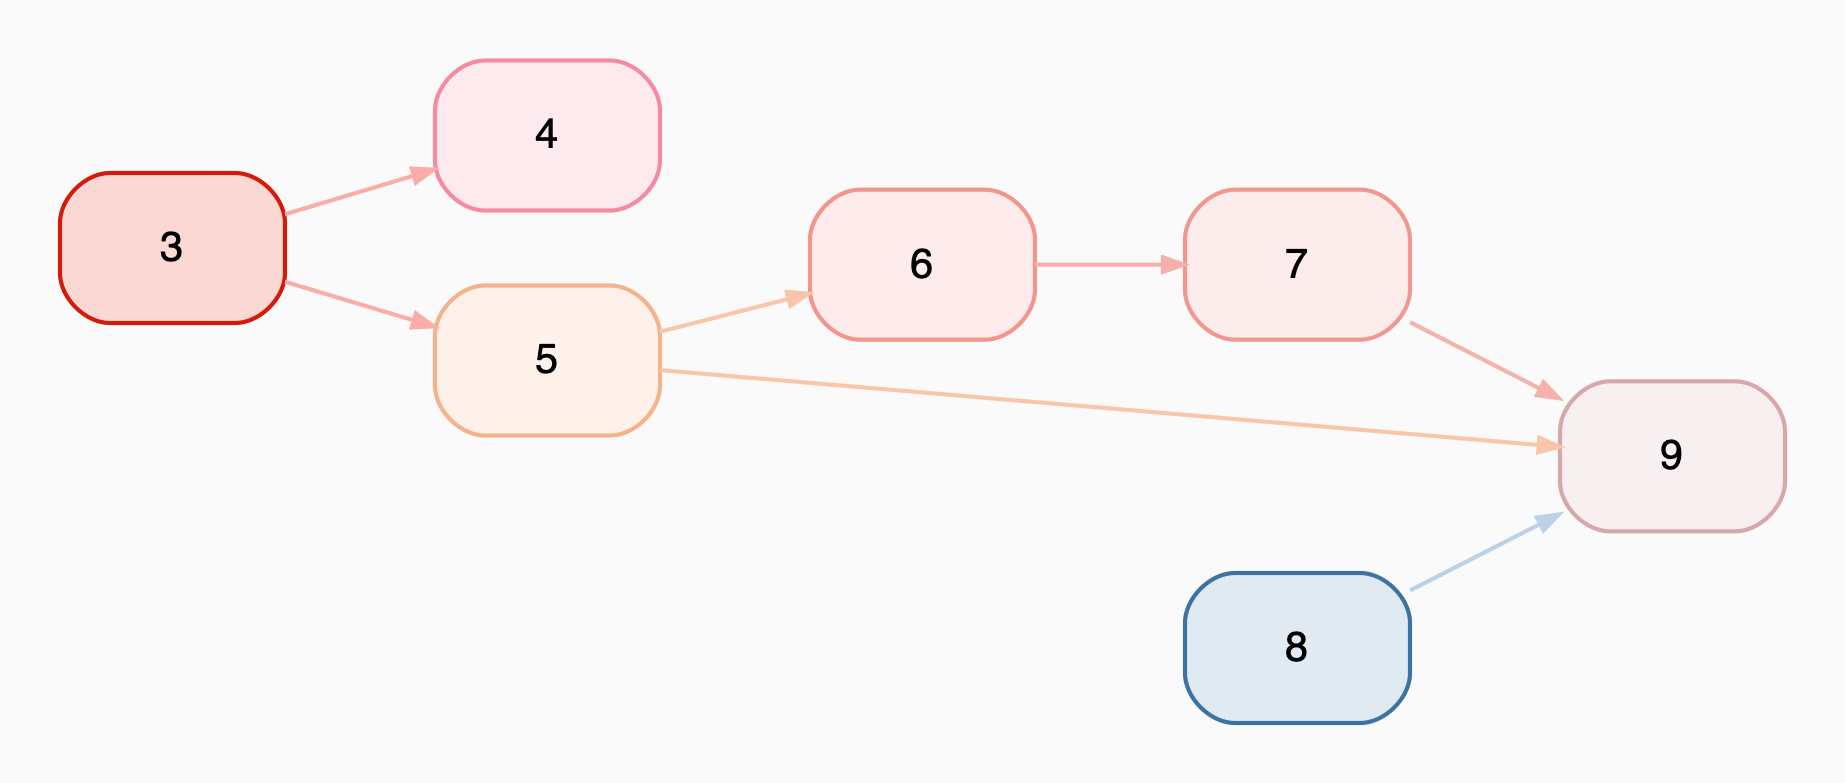
g2 = Graph.random(num_nodes=7, start_index=3, connection_probability=0.4, seed=41)
g2
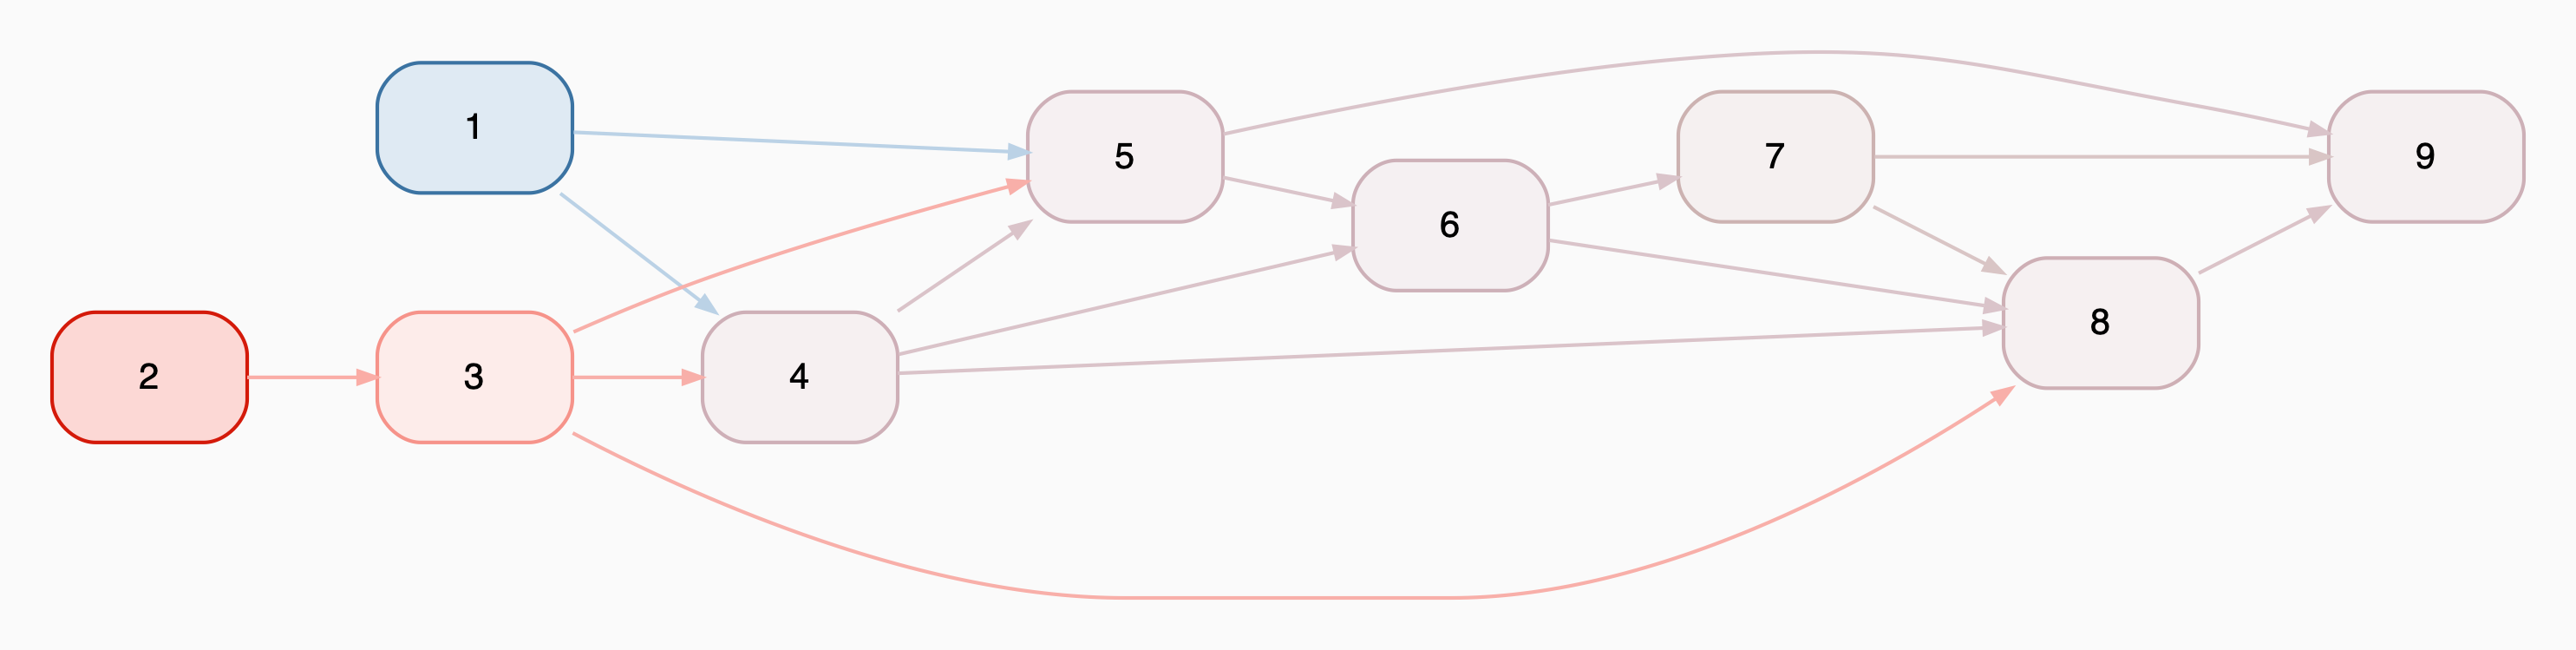
g3 = g1 + g2
g3
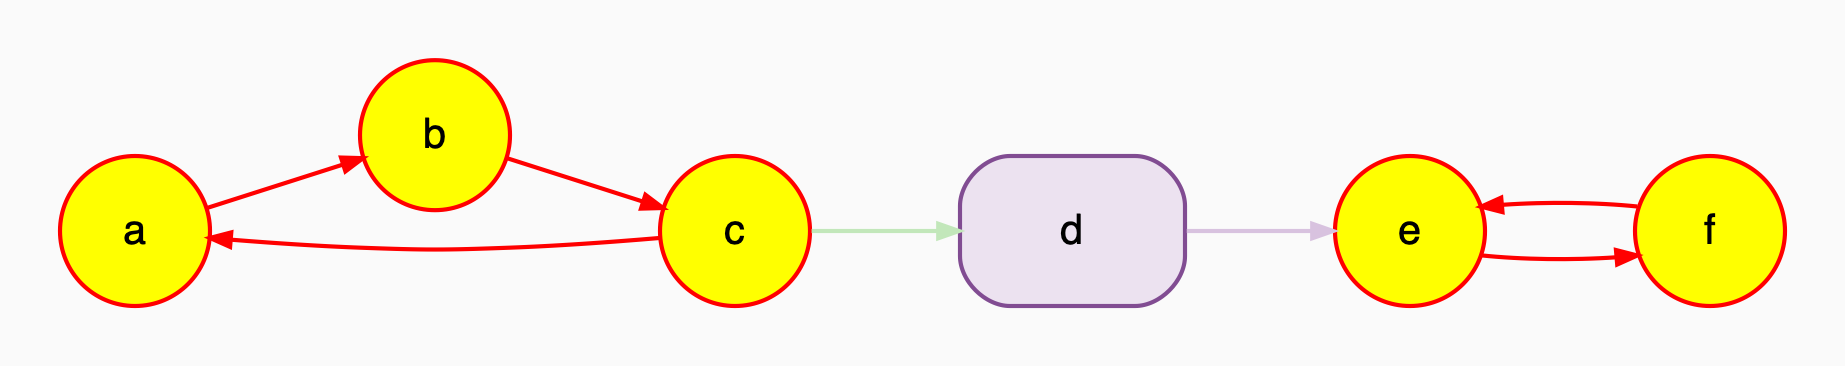
Finding Loops
The is_in_loop method of a node helps identify nodes that form a loop; that is, nodes that have at least one descendant that is also an ancestor.
graph_with_loop = Graph()
for letter in 'abcdef':
    graph_with_loop.add_node(letter)
for start, end in [
    ('a', 'b'), ('b', 'c'), ('c', 'a'), ('c', 'd'), ('d', 'e'), ('e', 'f'), ('f', 'e')
]:
    graph_with_loop.connect(start, end)
graph_with_loop
for node in graph_with_loop.nodes:
    if node.is_in_loop_with(other='a') and node.name != 'a':
        print(node.name, 'is in the same loop as a')
    elif node.is_in_loop():
        print(node.name, 'is in a loop')
    else:
        print(node.name, 'is not in a loop')
Output:
a is in a loop
b is in the same loop as a
c is in the same loop as a
d is not in a loop
e is in a loop
f is in a loop
Future Features
- Create a graph from:
- List of dictionaries
- DataFrame
- Create a new graph by filtering an existing graph
Release history Release notifications | RSS feed


Download files
Download the file for your platform. If you're not sure which to choose, learn more about installing packages.
Source Distribution
Built Distribution
Filter files by name, interpreter, ABI, and platform.
If you're not sure about the file name format, learn more about wheel file names.
Copy a direct link to the current filters
File details
Details for the file abstract-2025.2.17.0.tar.gz.
File metadata
- Download URL: abstract-2025.2.17.0.tar.gz
- Upload date:
- Size: 27.4 kB
- Tags: Source
- Uploaded using Trusted Publishing? No
- Uploaded via: twine/6.1.0 CPython/3.10.15
File hashes
| Algorithm | Hash digest | |
|---|---|---|
| SHA256 |
2e7a789595120aefce951a357fc622899599b7b4cb71500abde92f25f10847cd
|
|
| MD5 |
12e1a8b9bf31093dfae2d95ea9effea5
|
|
| BLAKE2b-256 |
612941cb61cbb14c4bc1944e1370effc2b133a79e3104c38f808722f7d3d0a38
|
File details
Details for the file abstract-2025.2.17.0-py3-none-any.whl.
File metadata
- Download URL: abstract-2025.2.17.0-py3-none-any.whl
- Upload date:
- Size: 31.8 kB
- Tags: Python 3
- Uploaded using Trusted Publishing? No
- Uploaded via: twine/6.1.0 CPython/3.10.15
File hashes
| Algorithm | Hash digest | |
|---|---|---|
| SHA256 |
dc0ba9510e90c59b8a8c23c34fe07990ee256171667b5b703d3dc3073b5e6483
|
|
| MD5 |
a6b3e088ddea13245f7fb7f17c1d6dce
|
|
| BLAKE2b-256 |
3496d309a1e6b993f17fa1b7639dabd0eb43b347610e3704eb4a4bc33bd43e24
|


