Serving interactive charts with images

Project description
Serving interactive charts with images - based on Altair

Project fully supports Google Colab. For more details see examples
Installation
pip install altair-images
How to use
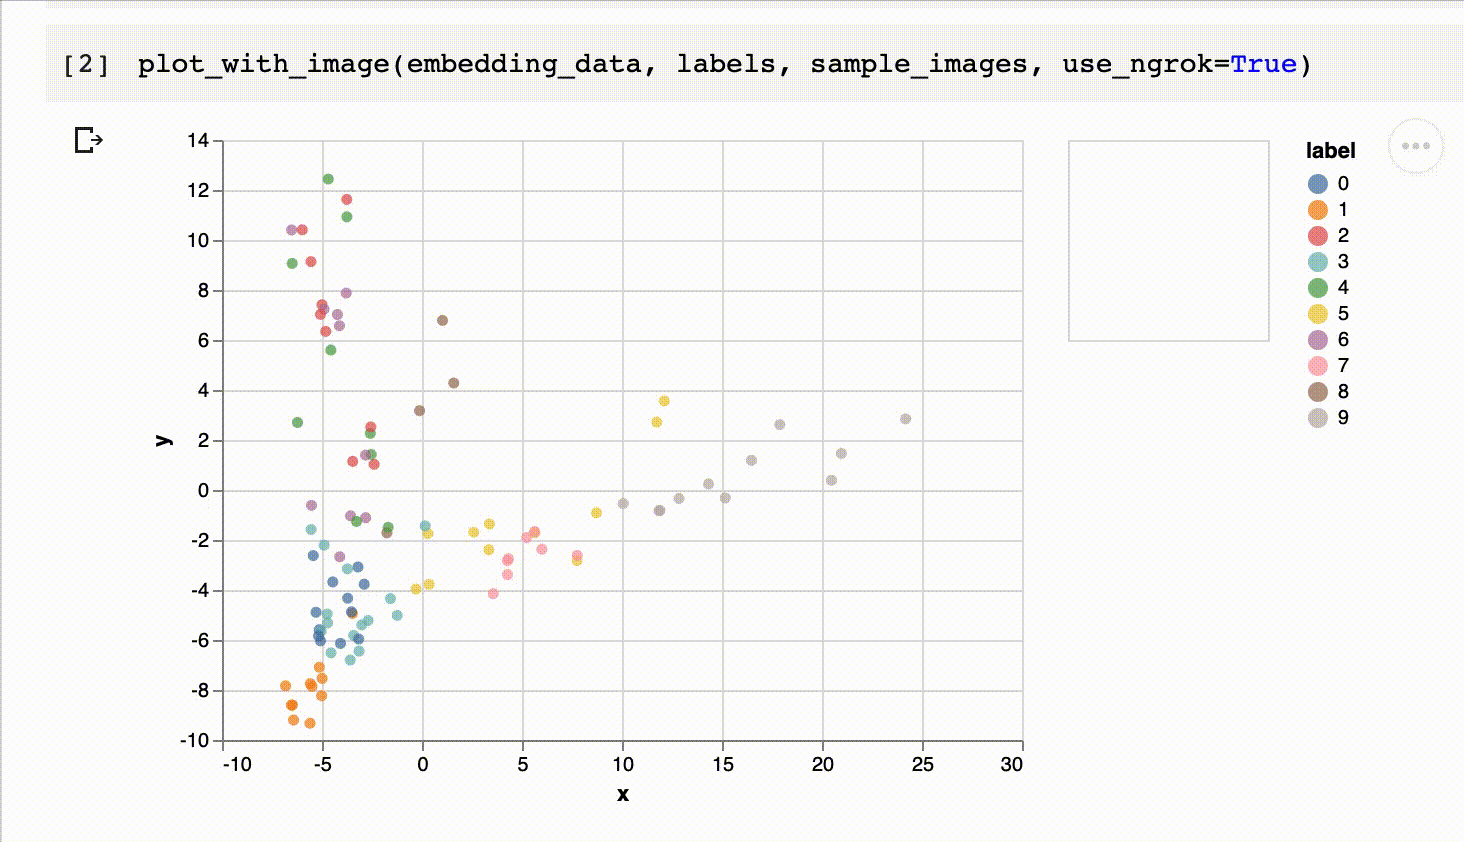
import numpy as np

from altair_images import plot_with_image

embedding_data = np.load('../tests/pca_data_100.npy')
sample_images = np.load('../tests/sample_images_100.npy')
labels = np.load('../tests/sample_labels_100.npy')

plot_with_image(embedding_data, labels, sample_images)
TODO
- Add examples in readme
- Add CI for tagging and publishing new version from master
- Add tests
- Example of line_plot and pictures(speed and frame, weight and body)
Release history Release notifications | RSS feed


Download files
Download the file for your platform. If you're not sure which to choose, learn more about installing packages.
Source Distributions
No source distribution files available for this release.See tutorial on generating distribution archives.
Built Distribution
Filter files by name, interpreter, ABI, and platform.
If you're not sure about the file name format, learn more about wheel file names.
Copy a direct link to the current filters
File details
Details for the file altair_images-0.1.4-py3-none-any.whl.
File metadata
- Download URL: altair_images-0.1.4-py3-none-any.whl
- Upload date:
- Size: 5.2 kB
- Tags: Python 3
- Uploaded using Trusted Publishing? No
- Uploaded via: twine/3.1.1 pkginfo/1.5.0.1 requests/2.23.0 setuptools/41.2.0 requests-toolbelt/0.9.1 tqdm/4.45.0 CPython/3.8.2
File hashes
| Algorithm | Hash digest | |
|---|---|---|
| SHA256 |
9d36b3e6310a1b569c139be9405ef39c3cca70401c644437f1c5d2c6421ee6a2
|
|
| MD5 |
a882b6e59306c771d4f90e9737a5258e
|
|
| BLAKE2b-256 |
b09a09d1849b45e40439d19685e467056198cad1b537b3363343656770c96ad3
|


