Record historical statistics from an API that only offers current numbers.

Project description
api_stats is a Python tool aimed at recording statistics from an API endpoint. For example, the GitHub API gives out a single number of downloads for each release; by running this tool, you can easily graph rolling averages and historical figures.
Quickstart
api_stats loads a “configuration file” that tells it what to fetch and which fields to record. This file is a Python script that will be loaded by api_stats, with a single global stats that acts as the interface with the program. This interface currently offers two functions: record(key, value), and get_json(url).
Here is an example configuration file, that records the number of downloads of each file from GitHub releases:
releases = stats.get_json(
    "https://api.github.com/repos/remram44/api_stats/releases")
for release in releases:
    relname = release.get('tag_name') or release['name']
    for asset in release['assets']:
        stats.record('%s/%s' % (relname, asset['name']),
                     asset['download_count'])
Then you can plot the data, for example using matplotlib:
python -m api_stats.plot -m '^(.+)$' 'api_stats:\g<1>' data.jsonlA more complex example
You might want to use functions to factor the retrieval of data points from a specific source:
def github(repo):
    releases = stats.get_json(
        "https://api.github.com/repos/%s/releases" % repo)
    for release in releases:
        if release['draft']:
            continue
        relname = release.get('tag_name') or release['name']
        for asset in release['assets']:
            stats.record('github/%s/%s/%s' % (repo, relname, asset['name']),
                         asset['download_count'])


github('VisTrails/VisTrails')
github('remram44/api_stats')


def pypi(pkg):
    releases = stats.get_json(
        "https://pypi.python.org/pypi/%s/json" % pkg)['releases']
    for relname, release in releases.items():
        for asset in release:
            stats.record('pypi/%s/%s/%s' % (pkg, relname, asset['filename']),
                         asset['downloads'])


pypi('VisTrails')
pypi('api_stats')
This will record data under pypi/<pkg_name>/<version>/<filename> and github/<owner>/<repo>/<version>/<filename>. You can then plot the data, one figure per project, aggregated by version but adding PyPI and GitHub together, using:
python -m api_stats.plot \
    -m '^pypi/([^/]+)/([^/]+)/.+$' '\g<1>:\g<2>' \
    -m '^github/[^/]+/([^/]+)/v([^/]+)/.+$' '\g<1>:\g<2>' \
    releases.jsonl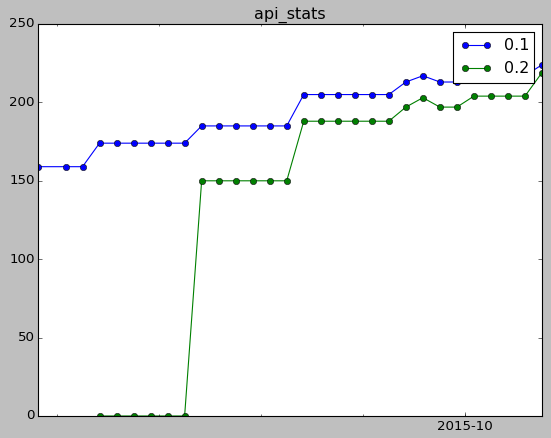
Release history Release notifications | RSS feed


Download files
Download the file for your platform. If you're not sure which to choose, learn more about installing packages.
Source Distribution
Built Distribution
Filter files by name, interpreter, ABI, and platform.
If you're not sure about the file name format, learn more about wheel file names.
Copy a direct link to the current filters
File details
Details for the file api_stats-0.3-1.tar.gz.
File metadata
- Download URL: api_stats-0.3-1.tar.gz
- Upload date:
- Size: 6.4 kB
- Tags: Source
- Uploaded using Trusted Publishing? No
File hashes
| Algorithm | Hash digest | |
|---|---|---|
| SHA256 |
4eed1d6f1ad686615392c13564299966e564a800cf9b6f8c7042e6943aeb399d
|
|
| MD5 |
127715da6bfbecf3bd42510d445b141e
|
|
| BLAKE2b-256 |
a1a884ce1d59361109fc5bdd1c0469848d6e5cc3eb762cde7f52e56efc2184d2
|
File details
Details for the file api_stats-0.3-py2.py3-none-any.whl.
File metadata
- Download URL: api_stats-0.3-py2.py3-none-any.whl
- Upload date:
- Size: 11.3 kB
- Tags: Python 2, Python 3
- Uploaded using Trusted Publishing? No
File hashes
| Algorithm | Hash digest | |
|---|---|---|
| SHA256 |
4d655960e94e696bfa75a462460c9bc74364d8404145fd2843f261e993bdf255
|
|
| MD5 |
0a2648398be355f5b9f46d98aa92cd4d
|
|
| BLAKE2b-256 |
c32e3db2f118e5d1b3f93706186a00b028860392b5786bf049af4b6d22eb87c2
|


