



Full documentation available here: https://ranjanmannige.github.io/backmap/.
Introduction
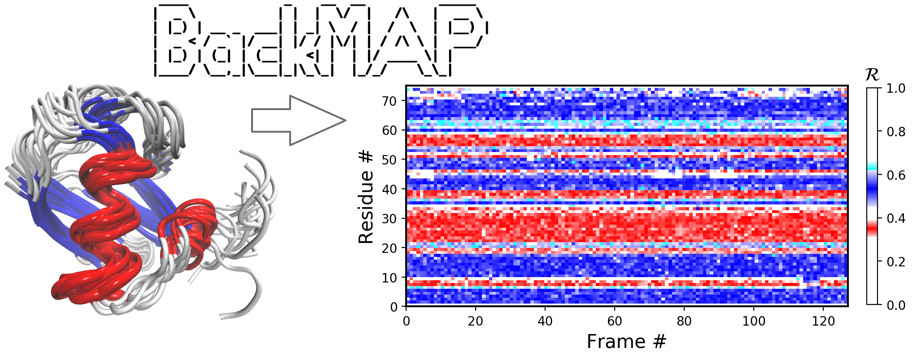
BackMAP is a Python module (and stand-alone tool) that helps with the visualization of large amounts of structural (space-time) backbone data in a single graph. It utilizes a new per-residue backbone metric – the Ramachandran number – to provide easily readable “pictures” (multi-angle pictures or MAPS) of protein conformations, ensembles, and trajectories. Input structures can be either a combined protein databank (PDB) structure file, or a directory of such files, and produces graphs.
Installation
PIP Installation
Running the following at a command prompt (terminal) would get the job done (the ‘-I’ is not necessary, but ensures the latest sub-version is installed):
$ pip install -I backmapGIT Installation
$ git clone https://github.com/ranjanmannige/backmap.git
$ cd backmap
$ pip install .
# For testing
$ pip install pytest
$ pytest
Manual Installation
Manually download the source code (main.zip) from the git repository. Then, same as above:
# In stead of downloading, you can follow the next two commands (tested only on linux)
$ wget https://github.com/ranjanmannige/backmap/archive/refs/heads/main.zip
$ unzip main.zip # Should giv you a directory called "backmap-main"
# The rest is the same as with installing using `git clone`
$ cd backmap-main
$ pip install .
# For testin
$ pip install pytest
$ pytest
Usage
In-script usage
import backmap
print backmap.R(phi=0,psi=0) # Should print '0.5'
For more information about in-script module usage, refer to the manuscript associated with this module.
Standalone usage
After installation, the following commands produce a variety of graphs (exampled below).
$ python -m backmap -pdb ./pdbs/ProteinDatabankStructureFilename.pdb
$ python -m backmap -pdb /directory/containing/pdbs/
Examples
Example 1: A stable protein (1xqq)
The Panels (b) through (f) were created by running the following command within thin the downloaded directory (Panel (a) was created using VMD).
$ python -m backmap -pdb ./tests/pdbs/1xqq.pdbAs evident below, the graphs generated from the protein ensemble 1xqq describes a conformationally stable protein (each graph is detailed below).
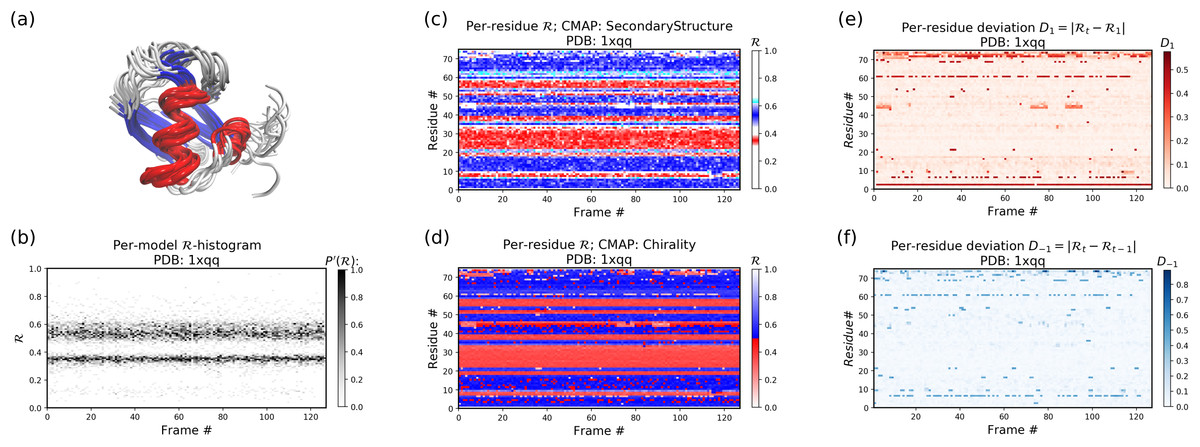
Each column in Panel (b) describes the histogram in Ramachandran number (R) space for a single model/timeframe. These histograms show the presence of both helices (at R ~ 0.34) and sheets (at R ~ 0.52). Additionally, Panels (c) and (d) describe the per-residue conformational plots (colored by two different metrics or CMAPs), which show that most of the protein backbone remains relatively stable (e.g., few fluctuations in state or ‘color’ are evident over the frame #). Finally, Panel (e) describes the extent towards which a single residue’s state has deviated from the first frame, and Panel (f) describes the extent towards which a single residue’s state has deviated from its state in the previous frame. Both these graphs, as expected from Panels (c) and (d), show that this protein is relatively conformationally stable.
Example 2: An intrinsically disordered protein (2fft)
As compared to the conformationally stable protein above, an intrinsically disordered protein (2fft) is much more flexible
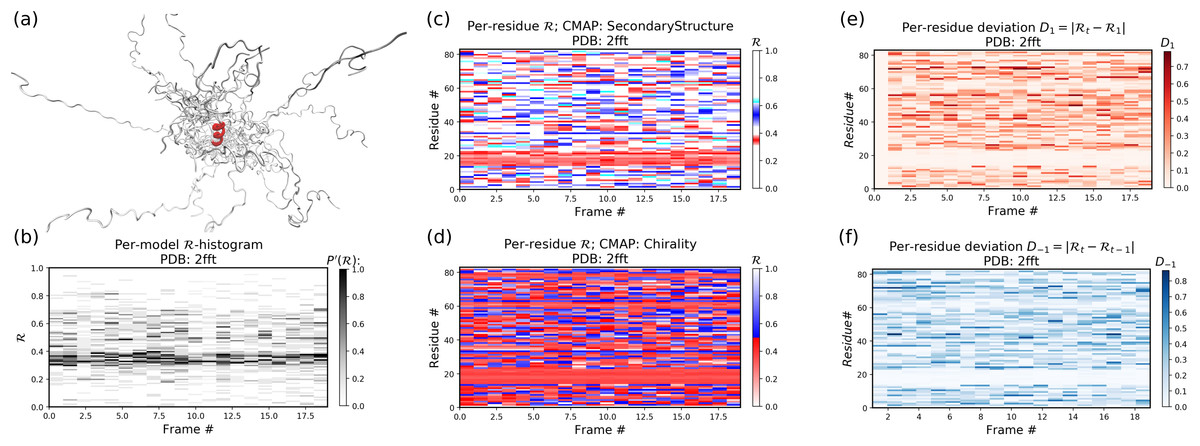
Panel (b) shows that the states accessed per model are diverse and dramatically fluctuate over the entire range of R (this is especially true when compared to a stable protein, see above).
The diverse states occupied by each residue (Panels (c) and (d)) confirm this conformational variation within most residues (Panels (e) and (f) similarly show how most of the residues fluctuate dramatically).
Yet, interestingly, Panels (c) through (f) also show an unusually stable region – residues 15 through 25 – which consistently display the same conformational (alpha-helical) state at R ~ 0.33 (interpreted as the color red in Panel (c)). This trend would be hard to recognize by simply looking at the structure (Panel (a)).
Publications
The Ramachandran number concept is discussed in the following manuscripts (this tool is discussed in the first reference):
Mannige (2018) “The Backmap Python Module: How a Simpler Ramachandran Number Can Simplify the Life of a Protein Simulator” PeerJ 6:e5745 [PeerJ Journal Link].
Mannige, Kundu, Whitelam (2016) “The Ramachandran Number: An Order Parameter for Protein Geometry” PLoS ONE 11(8): e0160023 [PLoS ONE Journal Link].
1 maintainer

Release files for backmap 1.1.0
For a detailed explanation of source distributions (sdists) and built distributions (wheels), please see the package formats documentation.
Source distribution (sdist)
| File | Size | Uploaded | |
|---|---|---|---|
| backmap-1.1.0.tar.gz | 37.3 kB | Details |
Built distribution (wheel)
| File | Interpreter | ABI | Platform | Reset |
|---|---|---|---|---|
| backmap-1.1.0-py3-none-any.whl | Python 3 | none | any | Details |
Total release size: 71.9 kB
Release files / backmap-1.1.0.tar.gz
| Download URL | backmap-1.1.0.tar.gz |
|---|---|
| Size | 37.3 kB |
| Tags | Source |
|
SHA-256 checksum How to use checksums |
6556e26008e04d9e7830cc8256b1874d5cc070343c438fa06c8d0b38f57c5e51
|
|
BLAKE2b-256 checksum How to use checksums |
7ce9a1abd223979fbb1dc4de5f0f69b199d2d2b191a3813c04c3a78f07822349
|
| Upload date | |
|
Uploaded using Trusted Publishing? What is trusted publishing? |
No |
| Uploaded via |
twine/6.2.0 CPython/3.9.23
|
Release files / backmap-1.1.0-py3-none-any.whl
| Download URL | backmap-1.1.0-py3-none-any.whl |
|---|---|
| Size | 34.6 kB |
| Tags | Python 3 |
|
SHA-256 checksum How to use checksums |
23c318cd98d828c04b14677ac6a9236c418cc6397a05ffd12f7fb7203035c452
|
|
BLAKE2b-256 checksum How to use checksums |
6e2fad9ad16d7dabf37c0f270f546bdfd75b0d43b54d84f259f0c57c62ab0e19
|
| Upload date | |
|
Uploaded using Trusted Publishing? What is trusted publishing? |
No |
| Uploaded via |
twine/6.2.0 CPython/3.9.23
|














