Python package for interactive visualization of imaging-based spatial transcriptomics.
Project description
Bella Vista
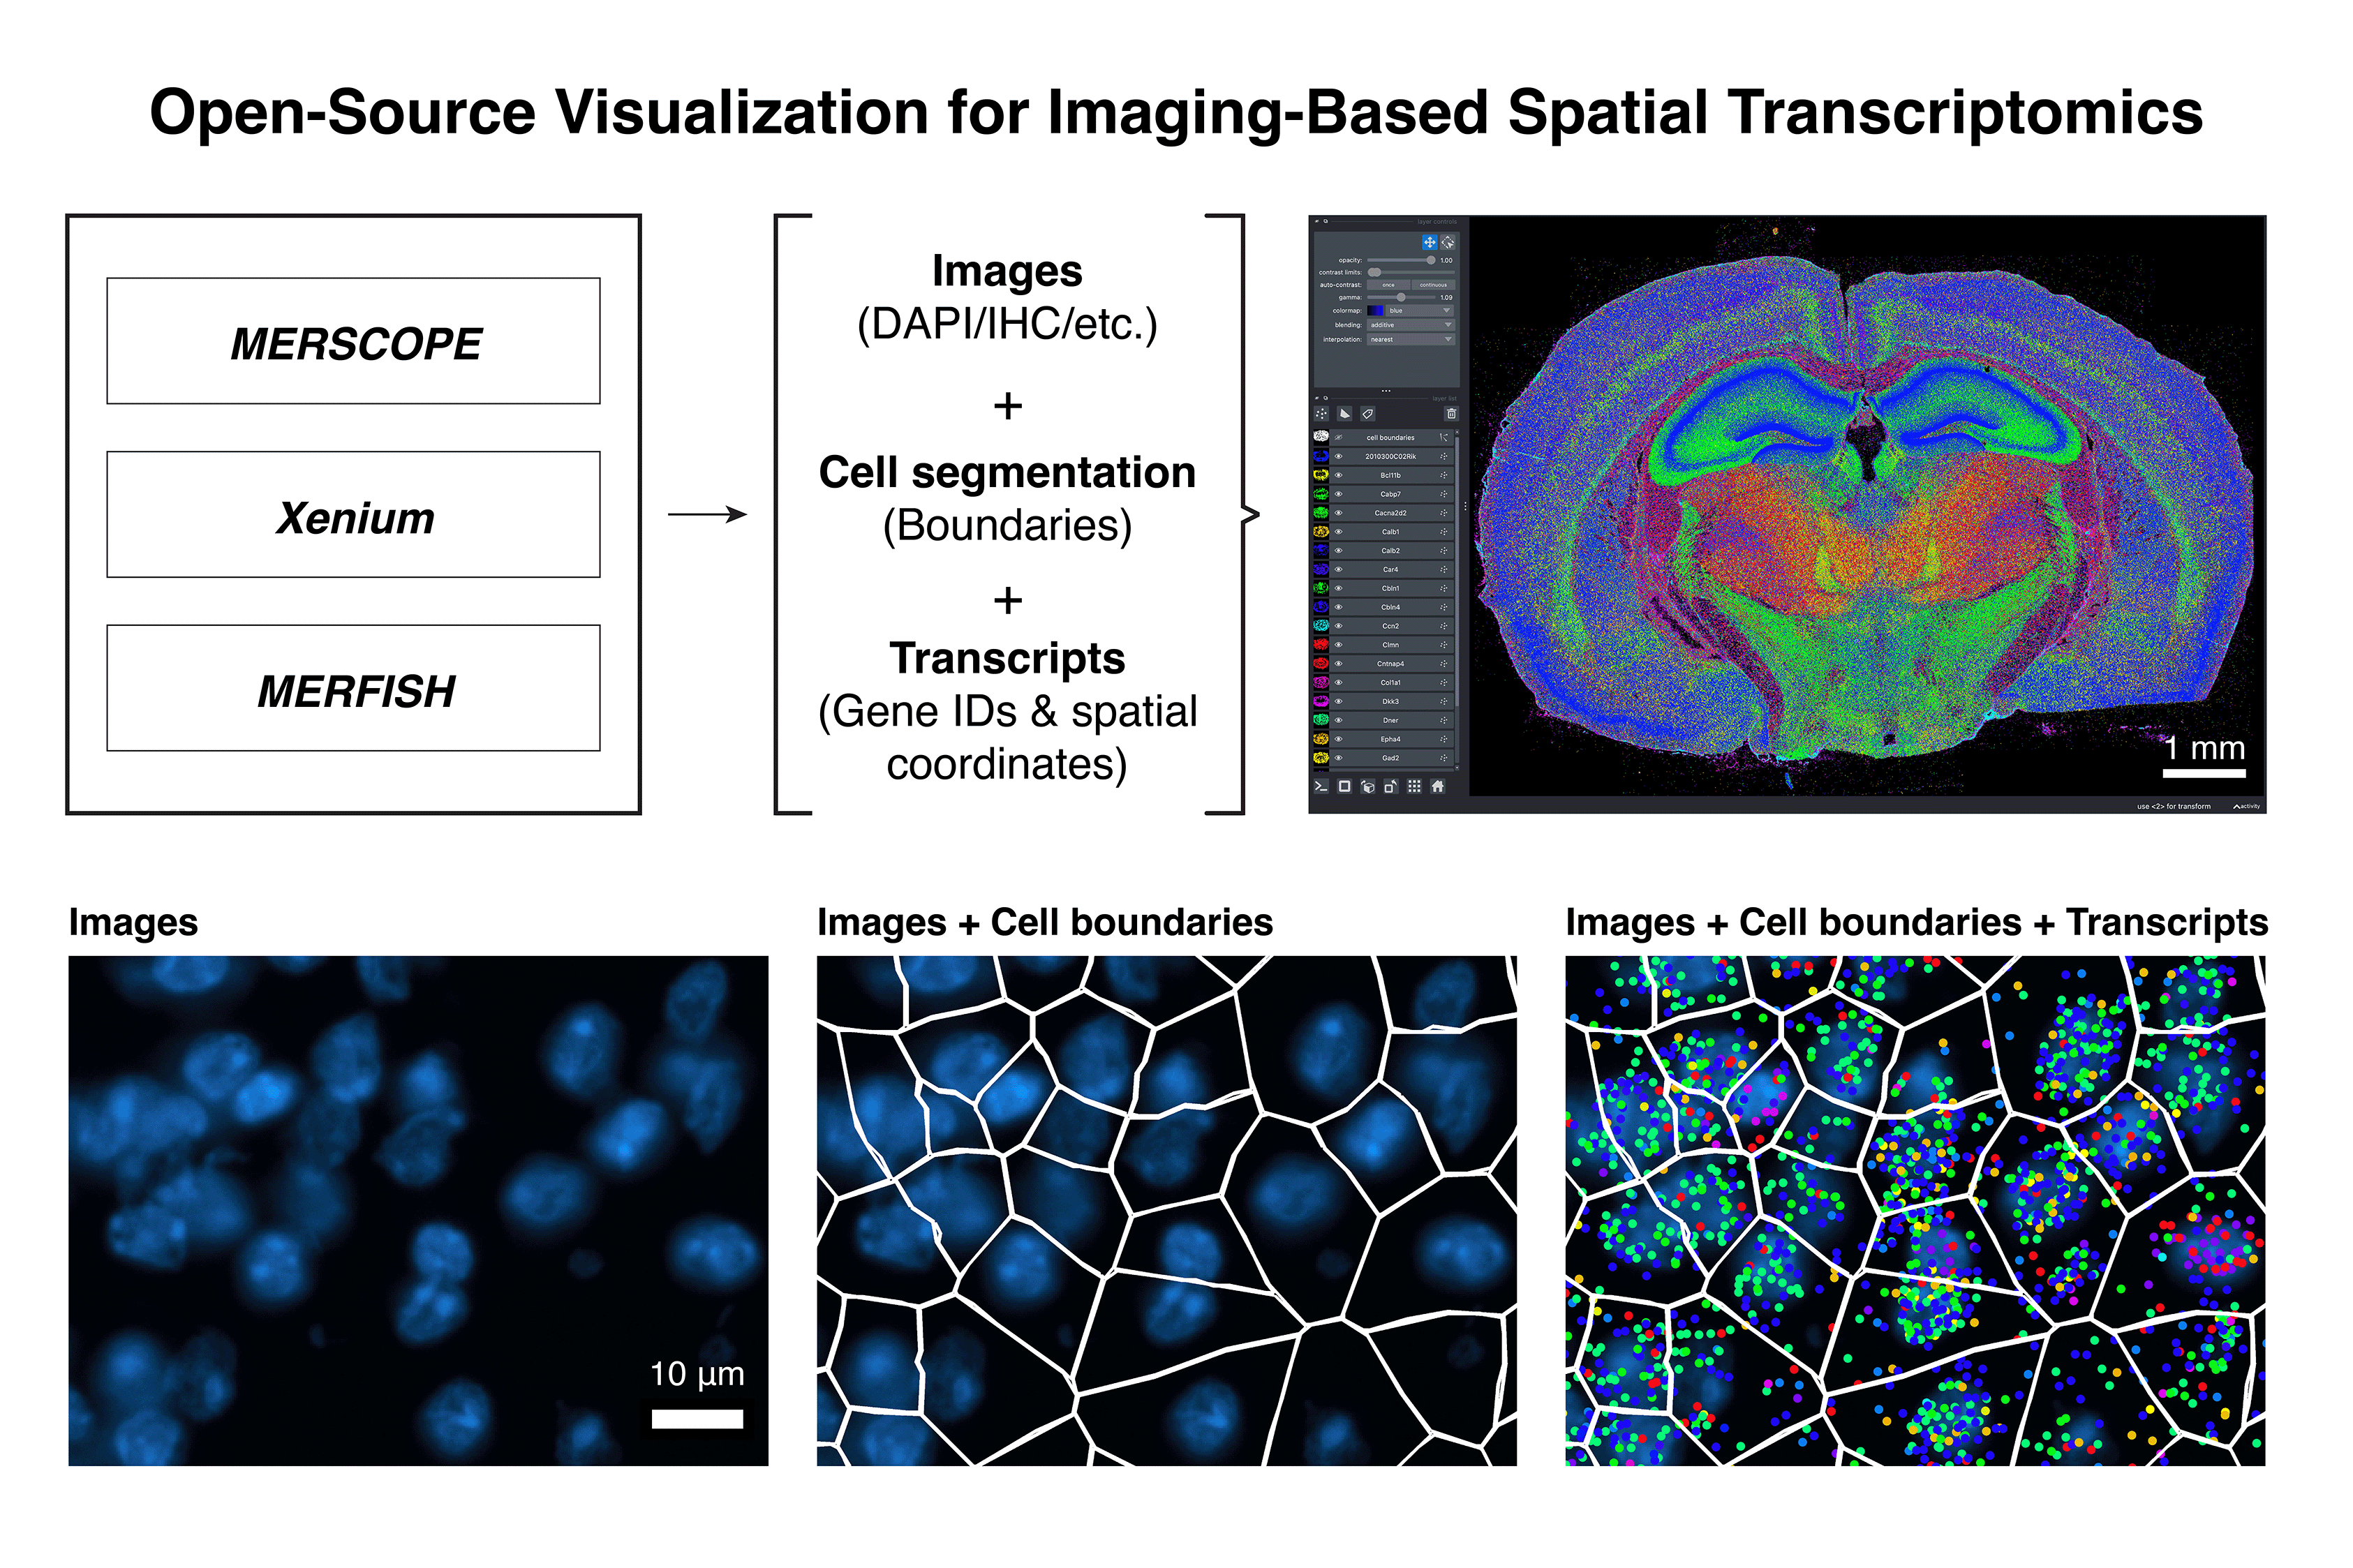
Bella Vista enables visualization of imaging-based spatial transcriptomics data. It is an open-source Python package currently supporting 10x Genomics Xenium, Vizgen MERSCOPE, and custom (home-built) MERFISH datasets, utilizing napari for interactive data exploration. We developed Bella Vista to help the spatial transcriptomics community explore their data and create reproducible paper-ready figures. For more information, see our documentation website.
Installation
The following instructions require that you have Anaconda installed.
- It is recommended to create an Anaconda virtual environment to prevent conflicting package dependencies.
- The package can be installed from PyPI via pip (recommended) or from the GitHub repository.
- Bella Vista requires python 3.9 or above.
Create and activate a new virtual environment:
conda create -n bellavista_env python
conda activate bellavista_env
Install via pip:
pip install bellavista
Quickstart (with sample data)
Below is a short tutorial for loading Bella Vista with sample Xenium data.
-
Download sample data: Xenium mouse brain dataset (Replicate 3)
- To download the dataset, 10x Genomics may ask you to fill out a questionnaire.
- Unzip the downloaded zip file. This will create a folder named "Xenium_V1_FF_Mouse_Brain_MultiSection_3_outs".
- Take note of your local path to this folder, as you will need this path when running Bella Vista.

-
Run Bella Vista from the command line with the Xenium sample data:
- Note: Before running this command, replace "/path/to/" with the actual path to the Xenium sample data folder.
bellavista --xenium-sample /path/to/Xenium_V1_FF_Mouse_Brain_MultiSection_3_outs
NOTE:
It will take a few minutes to create the required data files.
Once successfully loaded, you should see the message `Data Loaded!` in the terminal.
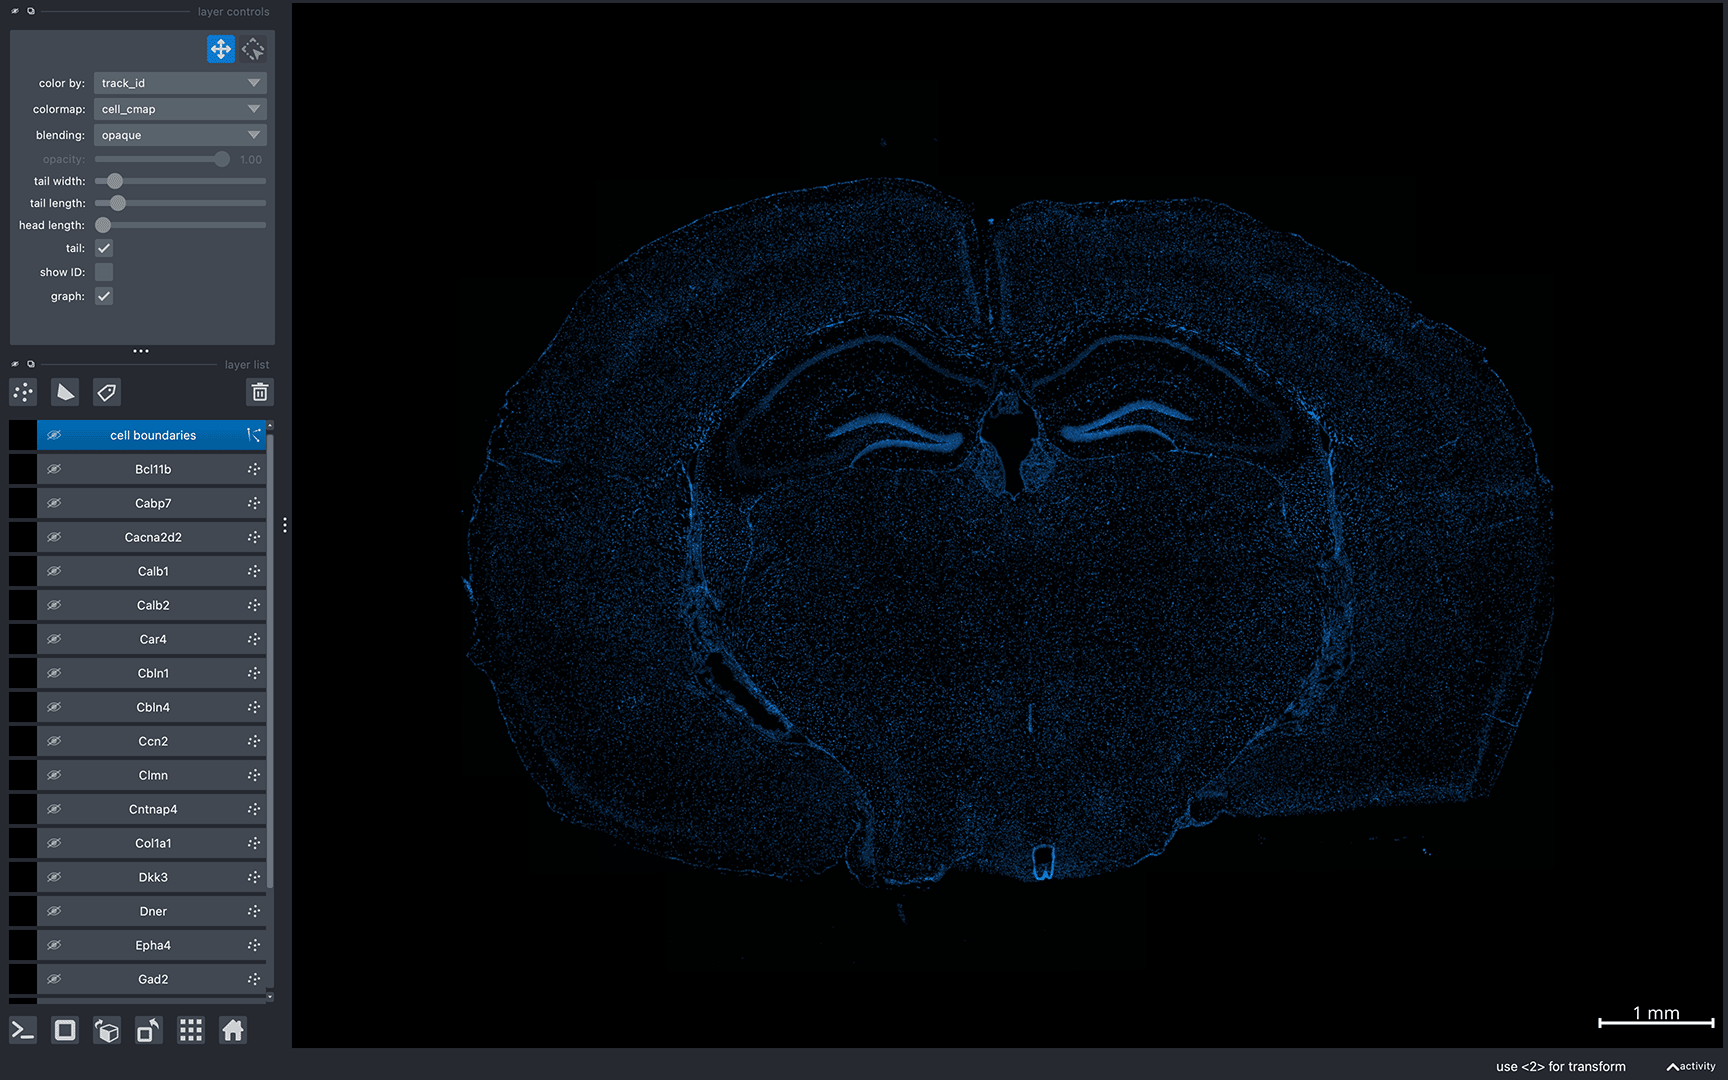
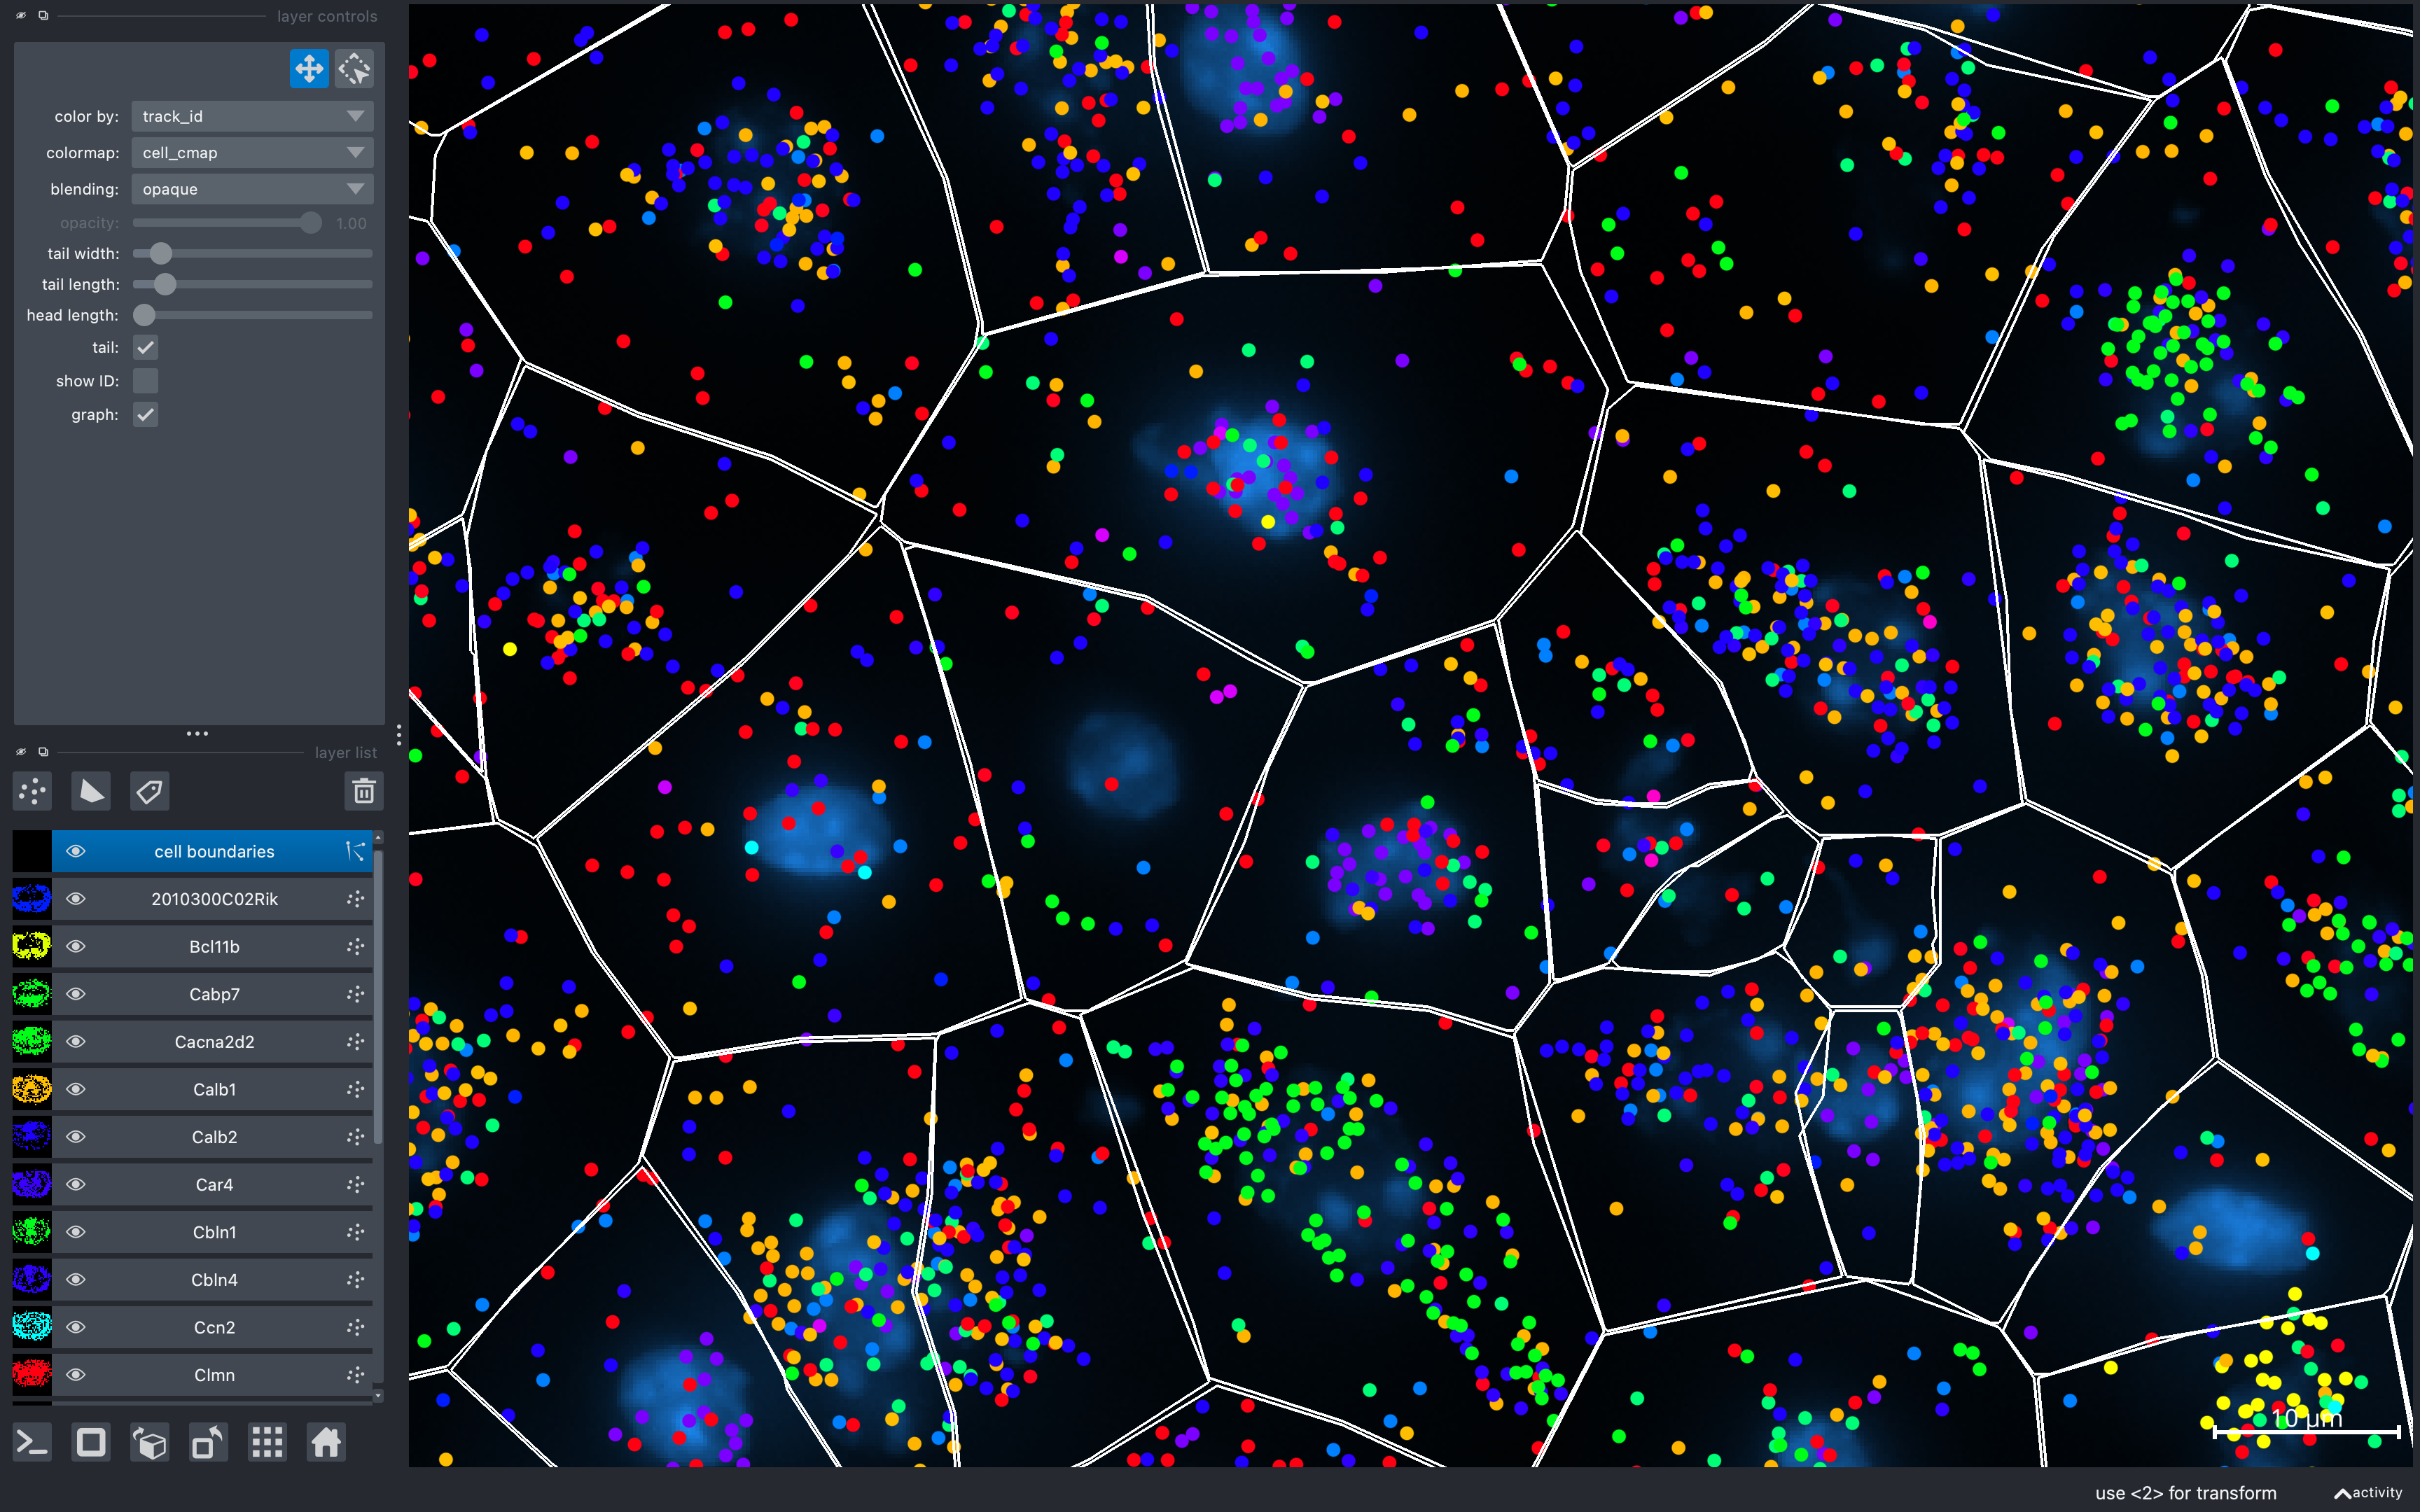
A napari window should appear displaying the data similar to the image below:
TIP:
This is a large dataset, so if the program encounters a memory-related error, try visualizing a smaller subset of the data:
bellavista --xenium-sample-lite /path/to/Xenium_V1_FF_Mouse_Brain_MultiSection_3_outs
Now, you can interactively move around the napari canvas to explore the data!
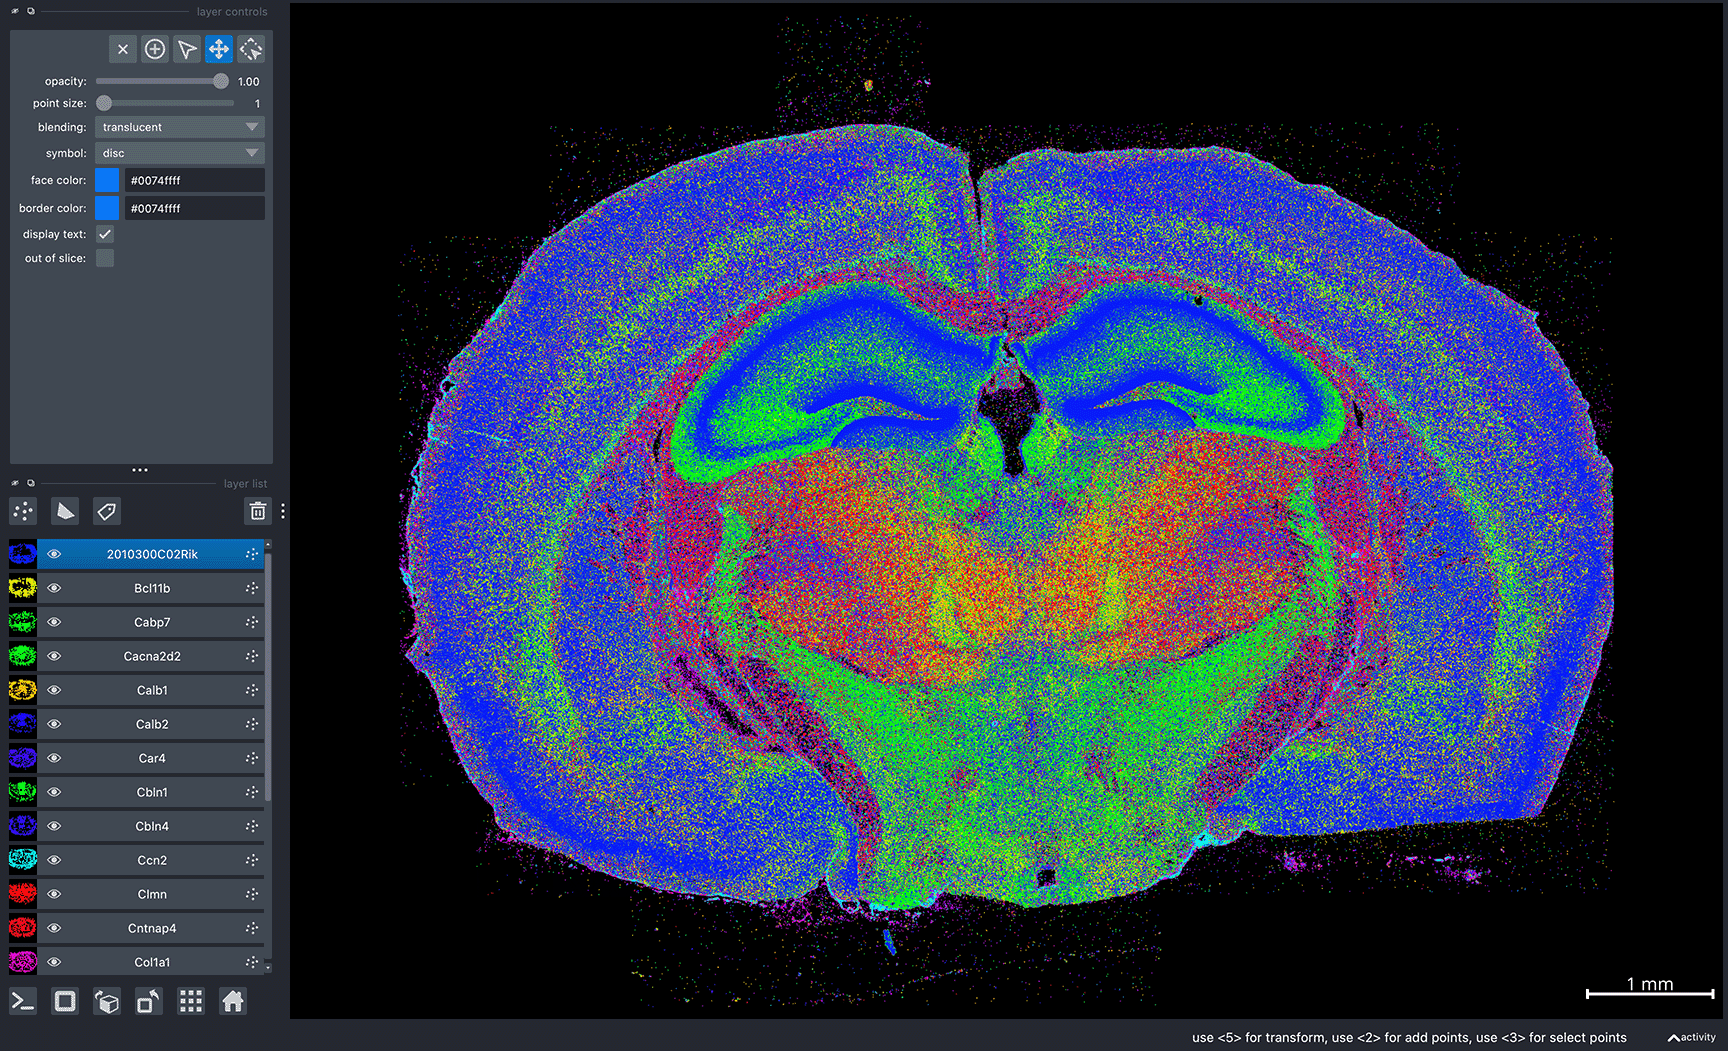
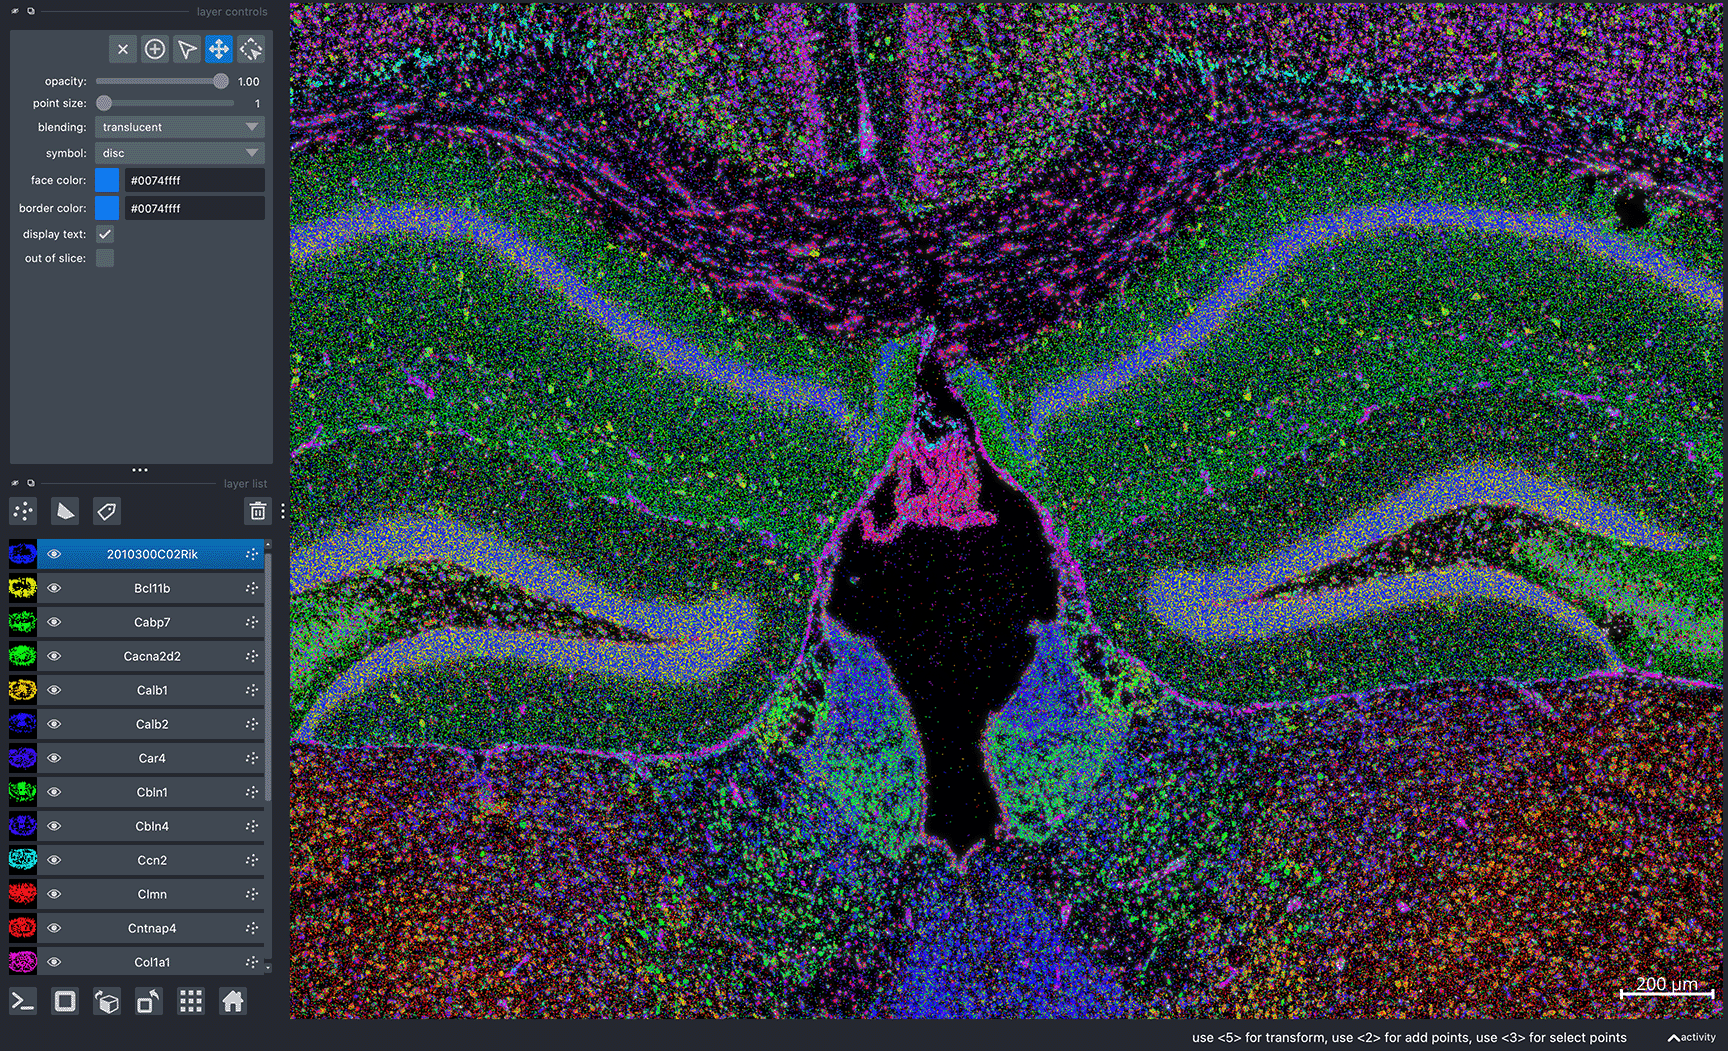
Try zooming in & out, toggling layers on & off to see different spatial patterns:
TIP:
To visualize a single layer, and hide all other layers,
Option/Alt-clickon the visibility button (the eye, to the left of the layer name).Check out our FAQ on the documentation website for more tips!
NOTE:
Gene colors are assigned randomly every time Bella Vista is launched. So, the gene colors displayed in your window will be different from the image above. Refer to our FAQ on the documentation website for information on how to configure gene colors and other customizable visualization options.
To reproduce the same colors every time you launch Bella Vista, refer to the figure guide on the documentation website.
For an exact reproduction of the screenshots above, please refer to the figure guide: Reproducing sample figures (Xenium) on the documentation website.
To run Bella Vista with your own data, refer to the tutorials on the documentation website.
Project details
Release history Release notifications | RSS feed
Download files
Download the file for your platform. If you're not sure which to choose, learn more about installing packages.
Source Distribution
Built Distribution
File details
Details for the file bellavista-0.0.2.tar.gz.
File metadata
- Download URL: bellavista-0.0.2.tar.gz
- Upload date:
- Size: 30.0 kB
- Tags: Source
- Uploaded using Trusted Publishing? No
- Uploaded via: twine/5.1.1 CPython/3.12.4
File hashes
| Algorithm | Hash digest | |
|---|---|---|
| SHA256 | 0a4de77de774a16e476f9857fd463becfcbb3cc8129681c84abd9cb627dc0bd2 |
|
| MD5 | 17ecf20c1978ff82fea49490a77cd6fe |
|
| BLAKE2b-256 | 16d0ec819e8b34e42b9ba219629ee346b33906d501b8200559e179bc51690f38 |
File details
Details for the file bellavista-0.0.2-py3-none-any.whl.
File metadata
- Download URL: bellavista-0.0.2-py3-none-any.whl
- Upload date:
- Size: 37.8 kB
- Tags: Python 3
- Uploaded using Trusted Publishing? No
- Uploaded via: twine/5.1.1 CPython/3.12.4
File hashes
| Algorithm | Hash digest | |
|---|---|---|
| SHA256 | 23c5adf19042074db7c32e50ef0c99a3ac89a74fb7f79cca9b1d6e1efc3874f7 |
|
| MD5 | 9192866580065e3bf987424336fb79e5 |
|
| BLAKE2b-256 | 5611abf184917d76ff32043006c16adcf51569a276af093243bd82cc26c23948 |


