
Monitor Process Resources Usage
Examples
We showed several examples below. Please note that all output are tabularized for demonstration purpose.
Example 1: simple command.
$> monitor.py sleep 2
pid     ppid    utime  stime  rtime         rss     vms      maxRss  maxVms   avgRss    avgVms     cwd                                cmd
133692  133675  0.0    0.0    1.9368159771  774144  6066176  774144  6066176  774144.0  6066176.0  /home/zhanxw/mycode/bench/scripts  sleep 2
Example 2: complex shell commands with sampling interval equaling to 0.1 second
This example will use shell to start 3 processes: sleep 2, sleep 4 and seq 1000000. You can see bench can monitor all 4 processes all together.
$> monitor.py sh -c 'sleep 2 & sleep 4 & seq 1000000 >/dev/null & wait'
pid     ppid    utime  stime  rtime            rss     vms      maxRss  maxVms   avgRss    avgVms     cwd                                cmd
135004  134985  0.0    0.0    3.9532430172     798720  4558848  798720  4558848  798720.0  4558848.0  /home/zhanxw/mycode/bench/scripts  sh -c sleep 2 & sleep 4 & seq 10000000 >/dev/null & wait
135006  135004  0.0    0.0    3.95348381996    655360  6066176  655360  6066176  655360.0  6066176.0  /home/zhanxw/mycode/bench/scripts  sleep 4
135005  135004  0.0    0.0    1.83160495758    774144  6066176  774144  6066176  774144.0  6066176.0  /home/zhanxw/mycode/bench/scripts  sleep 2
135007  135004  0.05   0.0    0.0599648952484  720896  6090752  720896  6090752  720896.0  6090752.0  /home/zhanxw/mycode/bench/scripts  seq 10000000
Example 3: generate performance metrics to external file
Here we used a small program, burnCpu. It will keep CPU running for several seconds. Its source code is under src/.
The option -t will enable outputting traces. That means at several time stops, performance metrics of each processes will be outputted to the standard error as well as a separate comma-separated file, $prefix.trace.csv.
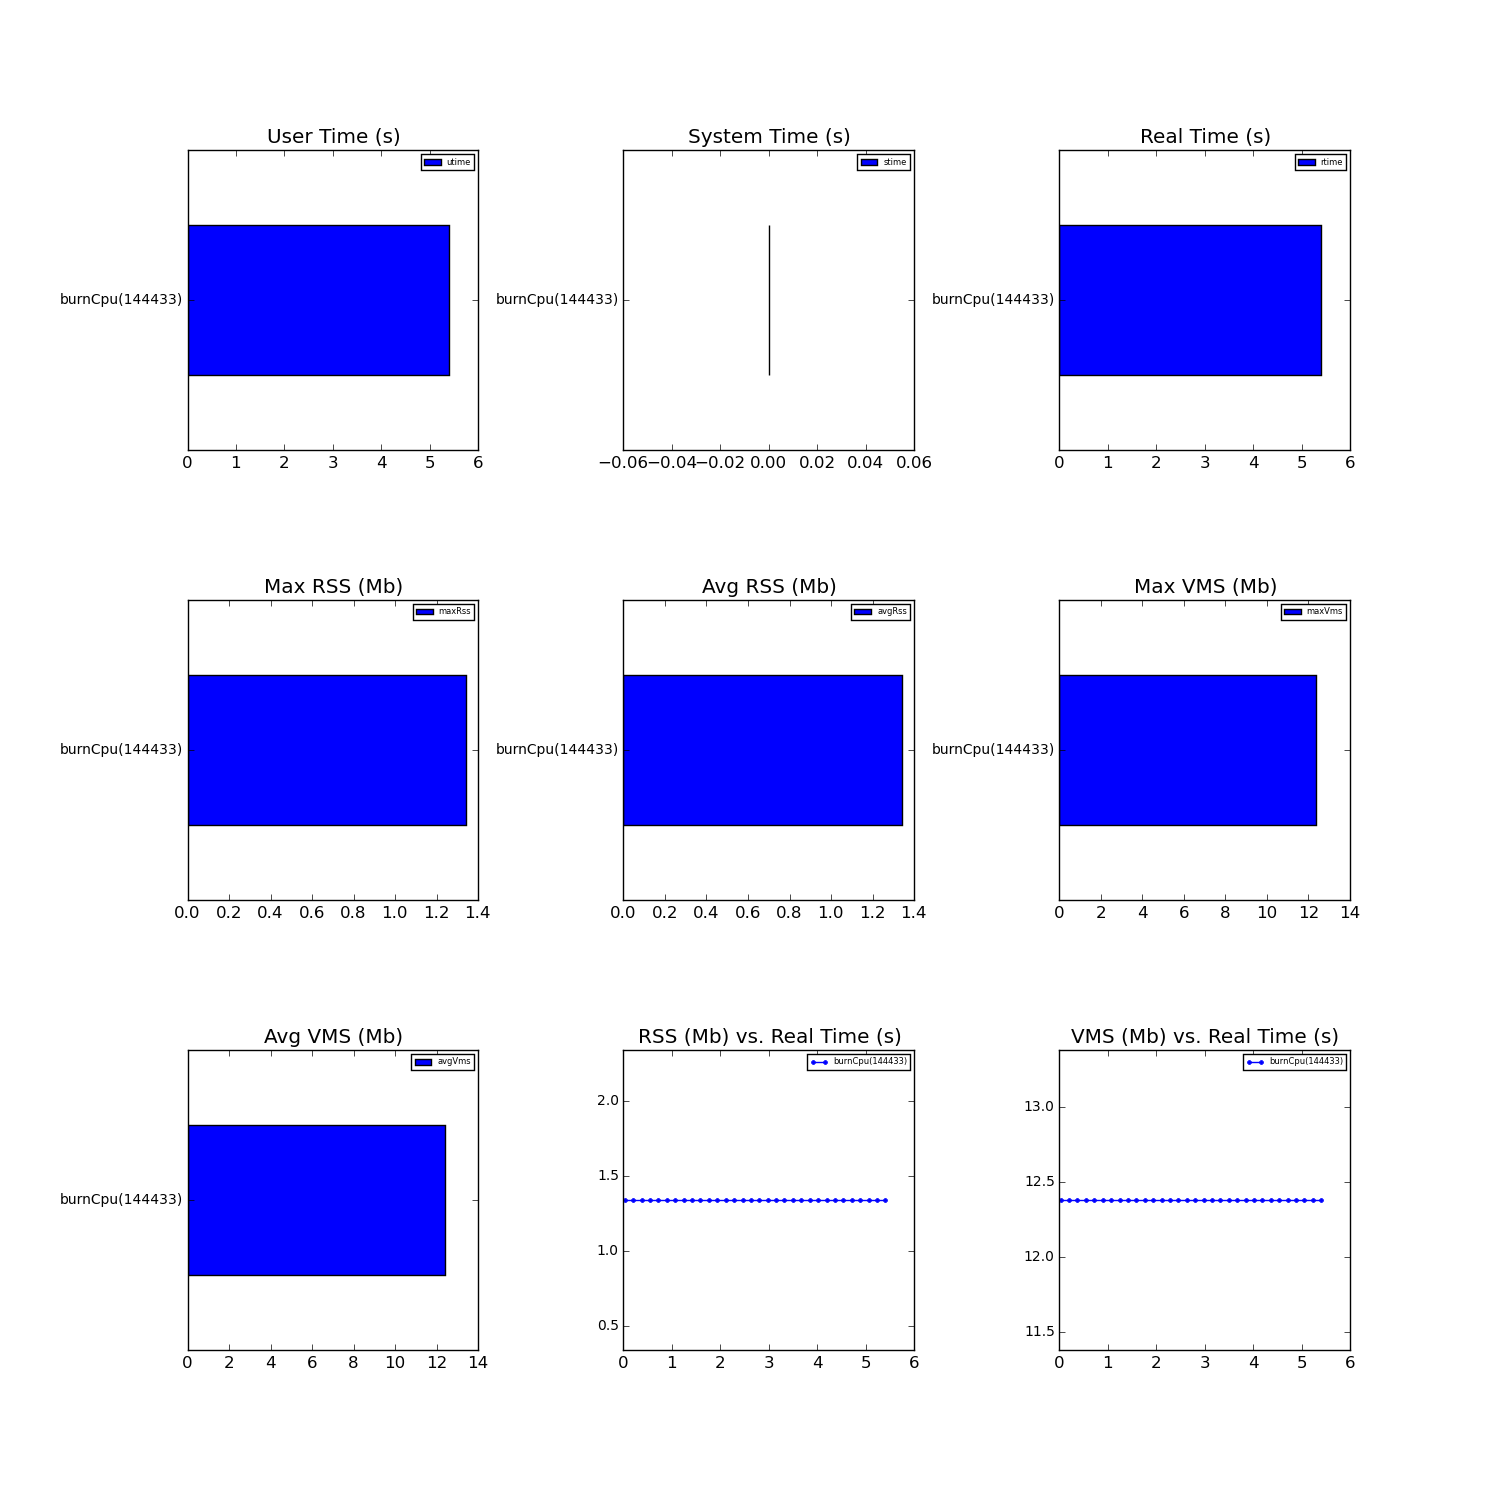
The option -g will generate a graph which contains several sub-figures, including timings for each processes, memory consumption for each processes, and memory consumption over the processing running time.
The option -o will specify the output prefix. The default value will be bench, meaning, you will get bench.csv. You can overwrite this value by using -o option.
$> monitor.py -t -g -o burnCpu ./burnCpu
pid     ppid    utime  stime  rtime            rss      vms       cwd                                cmd
135471  135454  0.04   0.0    0.0441780090332  1449984  12984320  /home/zhanxw/mycode/bench/scripts  ../src/burnCpu
135471  135454  0.2    0.0    0.205282926559   1449984  12984320  /home/zhanxw/mycode/bench/scripts  ../src/burnCpu
135471  135454  0.38   0.0    0.381079912186   1449984  12984320  /home/zhanxw/mycode/bench/scripts  ../src/burnCpu
...
Additional result are stored in burnCpu.csv, burnCpu.trace.csv in the Comma-separated format (CSV).
burnCpu.csv file content
pid,ppid,utime,stime,rtime,rss,vms,maxRss,maxVms,avgRss,avgVms,cwd,cmd
144433,144416,5.4,0.0,5.40555810928,1404928,12984320,1404928,12984320,1404928.0,12984320.0,/home/zhanxw/mycode/bench/scripts,../src/burnCpu
burnCpu.trace.csv file content
pid,ppid,utime,stime,rtime,rss,vms,cwd,cmd
144433,144416,0.03,0.0,0.0423669815063,1404928,12984320,/home/zhanxw/mycode/bench/scripts,../src/burnCpu
144433,144416,0.19,0.0,0.20046210289,1404928,12984320,/home/zhanxw/mycode/bench/scripts,../src/burnCpu
144433,144416,0.36,0.0,0.373480081558,1404928,12984320,/home/zhanxw/mycode/bench/scripts,../src/burnCpu
...
When -g optioned is specified, bench will generate several performance metrics in the file burnCpu.trace.csv:
Notes
Contact
1 maintainer

Metadata
1 maintainer
Release files for bench 2.8
For a detailed explanation of source distributions (sdists) and built distributions (wheels), please see the package formats documentation.
Source distribution (sdist)
| File | Size | Uploaded | |
|---|---|---|---|
| bench-2.8.tar.gz | 6.3 kB | Details |
Release files / bench-2.8.tar.gz
| Download URL | bench-2.8.tar.gz |
|---|---|
| Size | 6.3 kB |
| Tags | Source |
|
SHA-256 checksum How to use checksums |
c0c7641227a4edf57be9fc9801656019131b5450fa262c77b3af11d443c09cbc
|
|
BLAKE2b-256 checksum How to use checksums |
f4bd0283ce34822f314db788236358c9d22bf29602d3e3db3576175c4524ab37
|
| Upload date | |
|
Uploaded using Trusted Publishing? What is trusted publishing? |
No |














