Engaging visualisations, made easy.

Project description

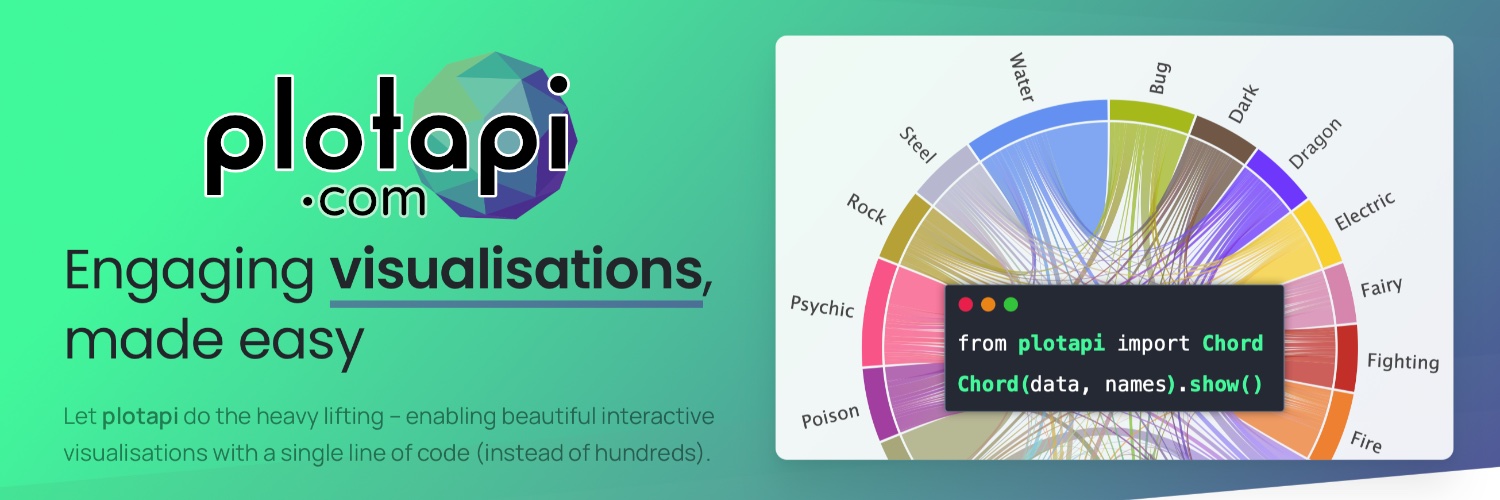
Engaging visualisations, made easy.


Key Features • Get Access • Installation • Usage • License
Key Features
- PlotAPI Chord - Illustrate inter-relationships between data.
- PlotAPI Sankey - Illustrate the flow from one set of values to another.
- PlotAPI Terminus - Illustrate distributing something out amongst recipients.
- PlotAPI Bar Fight - A beautiful take on the classic Bar Chart Race.
- PlotAPI Pie Fight - A beautiful take on the classic Pie Chart Race.
- PlotAPI Heat Map - Beautiful and interactive heat maps.
- PlotAPI Line Fight - A beautiful take on the classic Line Chart Race.
- PlotAPI Pareto Front - Illustrate non-dominated (Pareto) fronts over time.
- Upcoming Visualisations - Access to new visualisations as they are introduced.
- Supports Most Programming Languages - Get started with any language able to make HTTP requests.
- First-Class Python Support - Get started with pip install plotapi
- Jupyter Lab/Notebook + Google Colab Support - Super-charge your notebooks with inline visualisations.
- Beautiful Themes & Fonts - Select from pre-made beautiful themes, or add your own.
- Share or Embed Interactive HTML - Download and embed your interactive visualisations.
- Render to PDF, SVG, or PNG - Generate high-quality output ready for print.
- Record Animation to Video - Create social media-ready animated visualisations.
Get Access
Visit the website to get access to PlotAPI.
Installation
Get up and running with Python with the following command.
pip install plotapi
Usage
Example - Chord Pro
Created with PlotAPI
Chord(matrix, names).show()
The data
matrix = [
    [0, 5, 6, 4, 7, 4],
    [5, 0, 5, 4, 6, 5],
    [6, 5, 0, 4, 5, 5],
    [4, 4, 4, 0, 5, 5],
    [7, 6, 5, 5, 0, 4],
    [4, 5, 5, 5, 4, 0],
]

names = ["Action", "Adventure", "Comedy", "Drama", "Fantasy", "Thriller"]
Example - Sankey Pro
Created with PlotAPI
Sankey(links).show()
The data
links = [
    {"source":"Salary", "target":"Me", "value": 40000},
    {"source":"Freelance", "target":"Me", "value": 10000},
    {"source":"Dividends", "target":"Me", "value": 6000},

    {"source":"Me", "target":"Rent", "value": 1100*12},
    {"source":"Me", "target":"Food", "value": 300*12},
    {"source":"Me", "target":"Magazine Subscription", "value": 2000},
    {"source":"Me", "target":"Personal Tax", "value": 6000},
    {"source":"Me", "target":"Investments", "value": 30000},

    {"source":"Investments", "target":"Facebook", "value": 8000},
    {"source":"Investments", "target":"Amazon", "value": 7000},
    {"source":"Investments", "target":"Apple", "value": 6000},
    {"source":"Investments", "target":"Netflix", "value": 5000},
    {"source":"Investments", "target":"Google", "value": 4000},
]
License
MIT
Prefer not to code? Try PlotPanel.com

plotapi.com · GitHub @shahinrostami · Twitter @shahinrostami · A Polyra innovation
Release history Release notifications | RSS feed


Download files
Download the file for your platform. If you're not sure which to choose, learn more about installing packages.
Source Distribution
chord-6.0.1.tar.gz
(4.7 kB
view details)
Built Distribution
Filter files by name, interpreter, ABI, and platform.
If you're not sure about the file name format, learn more about wheel file names.
Copy a direct link to the current filters
chord-6.0.1-py3-none-any.whl
(7.0 kB
view details)
File details
Details for the file chord-6.0.1.tar.gz.
File metadata
- Download URL: chord-6.0.1.tar.gz
- Upload date:
- Size: 4.7 kB
- Tags: Source
- Uploaded using Trusted Publishing? No
- Uploaded via: twine/3.2.0 pkginfo/1.6.1 requests/2.25.0 setuptools/50.3.2.post20201201 requests-toolbelt/0.9.1 tqdm/4.54.0 CPython/3.9.0
File hashes
| Algorithm | Hash digest | |
|---|---|---|
| SHA256 |
f0f91d14d9c753cfa26e437f79582f7f43a12b45b813e0e299308d5f70ba13d7
|
|
| MD5 |
f6539ffbd4ba5107a35640e32de2ac55
|
|
| BLAKE2b-256 |
d032f62a499180545a987c34303333d41556c3aaf7b5f4278bba5df86cb0ce12
|
File details
Details for the file chord-6.0.1-py3-none-any.whl.
File metadata
- Download URL: chord-6.0.1-py3-none-any.whl
- Upload date:
- Size: 7.0 kB
- Tags: Python 3
- Uploaded using Trusted Publishing? No
- Uploaded via: twine/3.2.0 pkginfo/1.6.1 requests/2.25.0 setuptools/50.3.2.post20201201 requests-toolbelt/0.9.1 tqdm/4.54.0 CPython/3.9.0
File hashes
| Algorithm | Hash digest | |
|---|---|---|
| SHA256 |
bf54de0e99381c524c57fae36521c2eb84c8c74e62823db5e7d5c9ea6c20c53a
|
|
| MD5 |
a9ea1894d37c56e321f6fb0726844179
|
|
| BLAKE2b-256 |
9837e9521906a3ce157181e36d3033414369b11c314e0360d3dd79cee849c1e4
|


