Powerful and lightweight package to identify tissue compartments in spatial transcriptomics datasets.

Project description


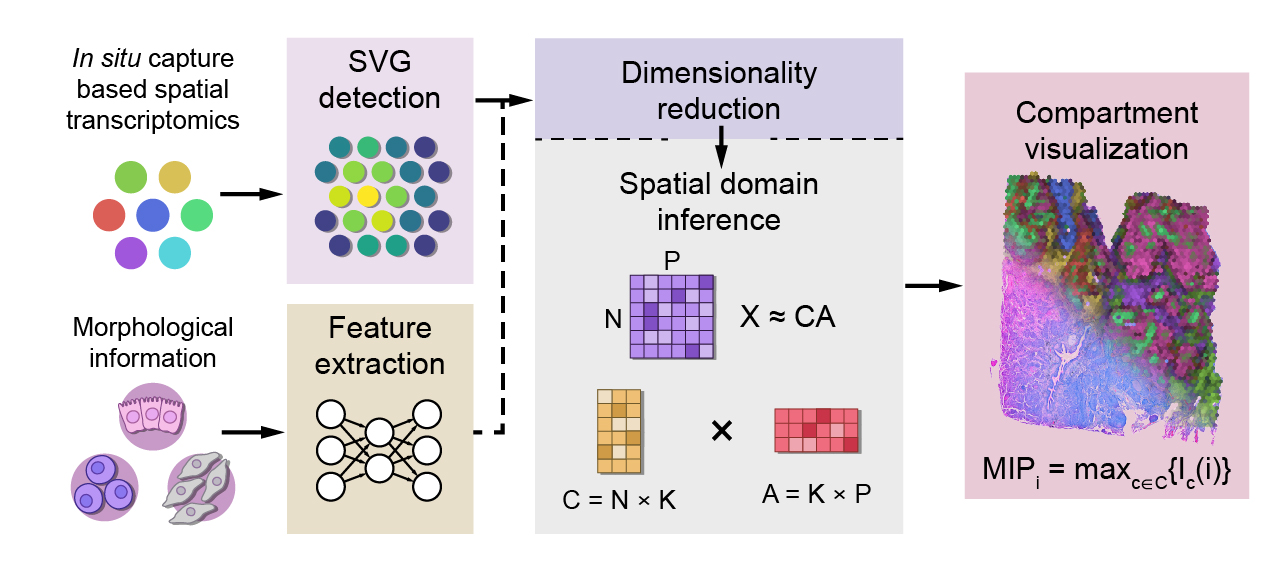
chrysalis is a powerful and lightweight method designed to identify and visualise tissue compartments in spatial
transcriptomics datasets, all without the need for external references.
chrysalis achieves this by identifying spatially variable genes (SVGs) through spatial autocorrelation.
It then employs dimensionality reduction and archetypal analysis to locate extremal points in the low-dimensional
feature space, which represent pure tissue compartments.
Each observation (i.e. capture spot) in the gene expression matrix is subsequently represented as a proportion of these
distinct compartments.
chrysalis features a unique approach based on maximum intensity projection, allowing the simultaneous visualization
of diverse tissue compartments.
Moreover, it seamlessly integrates into scanpy based pipelines.
If you like chrysalis, consider citing our preprint.
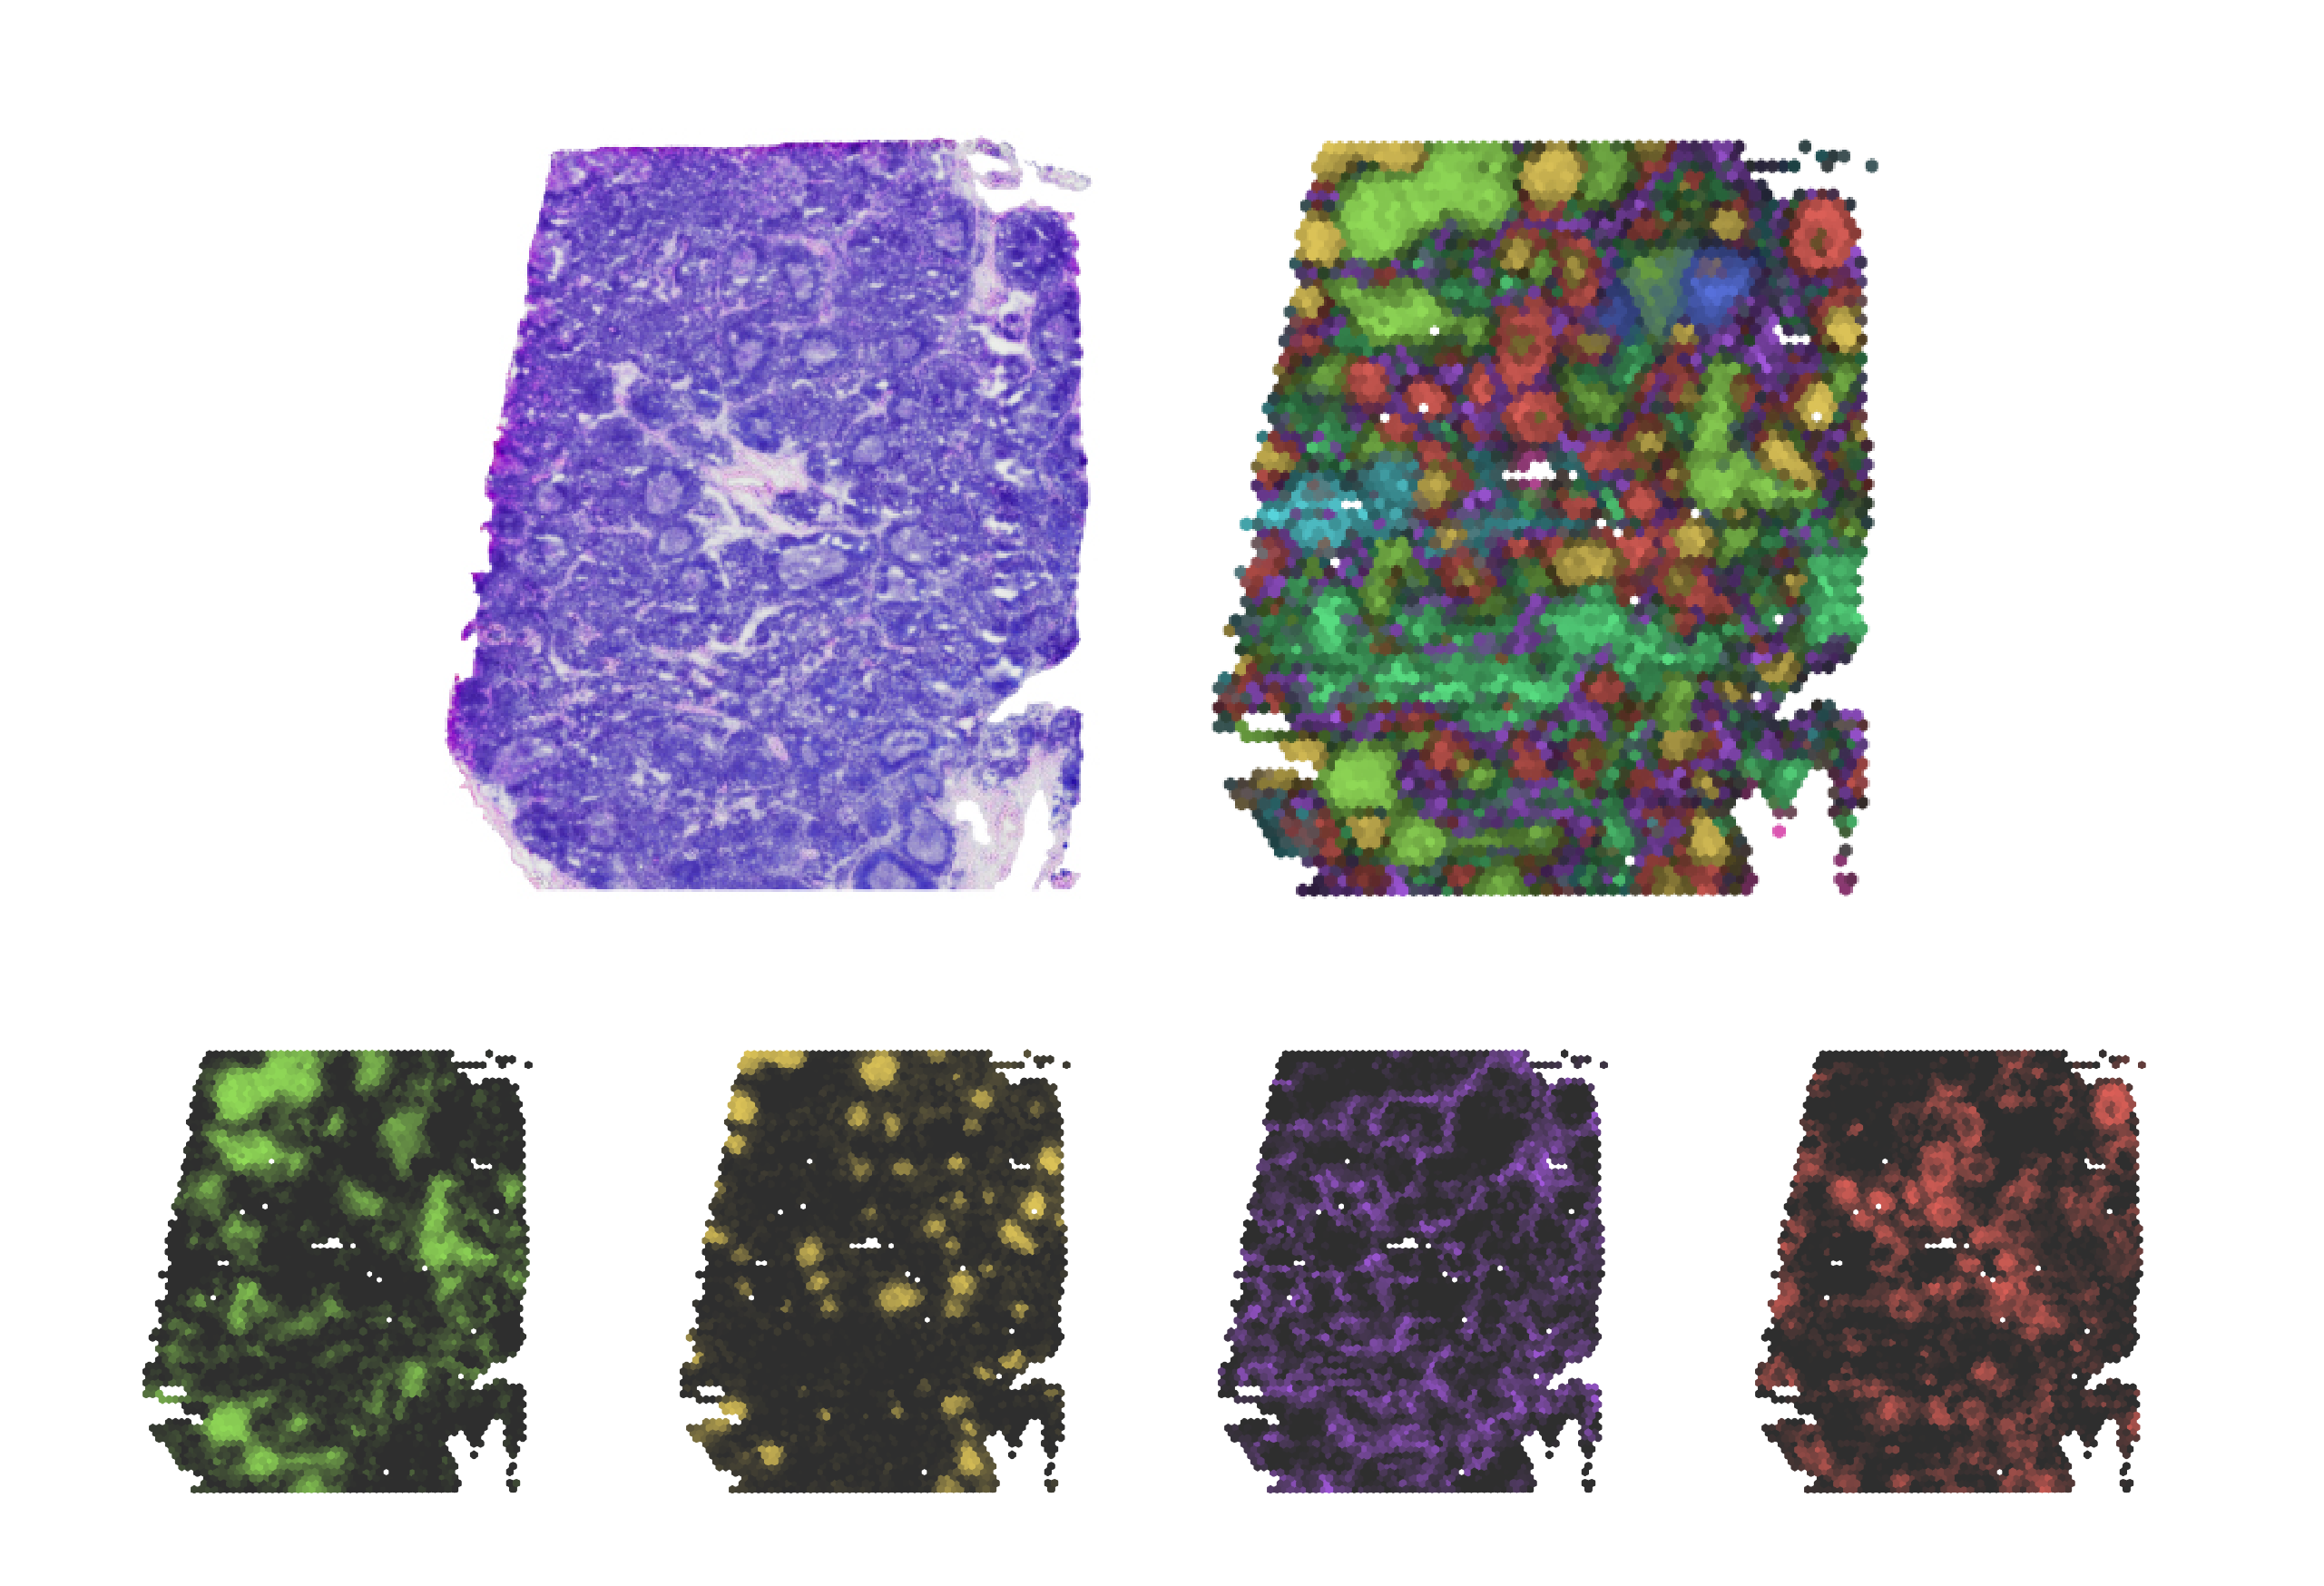
chrysalis can define distinct tissue compartments and cellular niches with specific gene expression signatures,
highlighted with specific colors. For instance, in the V1_Human_Lymph_Node dataset, chrysalis identifies
various regions, such as germinal centers (yellow), B cell follicles (dark orange), and T cell compartments
(lime). You can find more examples in the gallery section.
Package
chrysalis can be used with any pre-existing anndata snapshot of 10X Visium, Slide-seqV2 and Stereo-seq datasets
generated with scanpy, and on new samples without the need of preprocessing. It is designed to be as lightweight as
possible, however currently it relies on libpysal for its fast implementation of Moran's I.
chrysalis requires the following packages:
- numpy
- pandas
- matplotlib
- scanpy
- pysal
- archetypes
- scikit_learn
- scipy
- tqdm
- seaborn
To install chrysalis:
pip install chrysalis-st
Documentation, Tutorials and API details
User documentation is available on: https://chrysalis.readthedocs.io/
Basic tutorials covering the main functionality of chrysalis are available on the documentation site.
- first step-by-step tutorial: https://chrysalis.readthedocs.io/en/latest/tutorials/lymph_node_tutorial.html
Usage
import chrysalis as ch
import scanpy as sc
import matplotlib.pyplot as plt

adata = sc.datasets.visium_sge(sample_id='V1_Human_Lymph_Node')

sc.pp.calculate_qc_metrics(adata, inplace=True)
sc.pp.filter_cells(adata, min_counts=6000)
sc.pp.filter_genes(adata, min_cells=10)

ch.detect_svgs(adata)

sc.pp.normalize_total(adata, inplace=True)
sc.pp.log1p(adata)

ch.pca(adata)

ch.aa(adata, n_pcs=20, n_archetypes=8)

ch.plot(adata)
plt.show()
Reference
Chrysalis: decoding tissue compartments in spatial transcriptomics with archetypal analysis
Demeter Turos, Jelica Vasiljevic, Kerstin Hahn, Sven Rottenberg, Alberto Valdeolivas
doi: https://doi.org/10.1101/2023.08.17.553606
Release history Release notifications | RSS feed


Download files
Download the file for your platform. If you're not sure which to choose, learn more about installing packages.
Source Distribution
Built Distribution
Filter files by name, interpreter, ABI, and platform.
If you're not sure about the file name format, learn more about wheel file names.
Copy a direct link to the current filters
File details
Details for the file chrysalis_st-0.2.0.tar.gz.
File metadata
- Download URL: chrysalis_st-0.2.0.tar.gz
- Upload date:
- Size: 16.9 kB
- Tags: Source
- Uploaded using Trusted Publishing? No
- Uploaded via: twine/4.0.2 CPython/3.8.13
File hashes
| Algorithm | Hash digest | |
|---|---|---|
| SHA256 |
c9f83fe788e52c3686c52df5a17be81fb4710551b491f4bda5e3c8ef6ebd55ef
|
|
| MD5 |
81bb94b527d40d5c09d65d7d0b13b01c
|
|
| BLAKE2b-256 |
d508ed838b32baf68c563e89c02696f27b9381ddafdbb11ce7cc8deba5687efe
|
File details
Details for the file chrysalis_st-0.2.0-py3-none-any.whl.
File metadata
- Download URL: chrysalis_st-0.2.0-py3-none-any.whl
- Upload date:
- Size: 19.7 kB
- Tags: Python 3
- Uploaded using Trusted Publishing? No
- Uploaded via: twine/4.0.2 CPython/3.8.13
File hashes
| Algorithm | Hash digest | |
|---|---|---|
| SHA256 |
5ee7754a9817191b5226901fad1cbebc84e78a5989c7d801ba7eb227b65946d9
|
|
| MD5 |
4d0799d2e4726615b2ff9c7a2d87c61b
|
|
| BLAKE2b-256 |
06add81f1f3869458e61915b1bf632734086a99eea86cd16295edc6b93fed281
|


