A monitoring tool for machine learning systems that focus on data drift

Project description


Introduction to CinnaMon
CinnaMon is a Python library which allows to monitor data drift on a machine learning system. It provides tools to study data drift between two datasets, especially to detect, explain, and correct data drift.
⚡️ Quickstart
As a quick example, let’s illustrate the use of CinnaMon on the breast cancer data where we voluntarily introduce some data drift.
Setup the data and build a model
>>> import pandas as pd
>>> from sklearn import datasets
>>> from sklearn.model_selection import train_test_split
>>> from xgboost import XGBClassifier

# load breast cancer data
>>> dataset = datasets.load_breast_cancer()
>>> X = pd.DataFrame(dataset.data, columns = dataset.feature_names)
>>> y = dataset.target

# split data in train and valid dataset
>>> X_train, X_valid, y_train, y_valid = train_test_split(X, y, test_size=0.3, random_state=2021)

# introduce some data drift in valid by filtering with 'worst symmetry' feature
>>> y_valid = y_valid[X_valid['worst symmetry'].values > 0.3]
>>> X_valid = X_valid.loc[X_valid['worst symmetry'].values > 0.3, :].copy()

# fit a XGBClassifier on the training data
>>> clf = XGBClassifier(use_label_encoder=False)
>>> clf.fit(X=X_train, y=y_train, verbose=10)
Initialize ModelDriftExplainer and fit on train and validation data
>>> import cinnamon
>>> from cinnamon.drift import ModelDriftExplainer

# initialize a drift explainer with the built XGBClassifier and fit it on train
# and valid data
>>> drift_explainer = ModelDriftExplainer(model=clf)
>>> drift_explainer.fit(X1=X_train, X2=X_valid, y1=y_train, y2=y_valid)
Detect data drift by looking at main graphs and metrics
# Distribution of logit predictions
>>> cinnamon.plot_prediction_drift(drift_explainer, bins=15)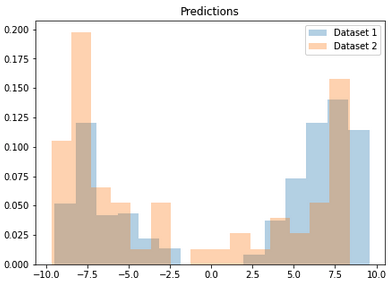
We can see on this graph that because of the data drift we introduced in validation data the distribution of predictions are different (they do not overlap well). We can also compute the corresponding drift metrics:
# Corresponding metrics
>>> drift_explainer.get_prediction_drift()
[{'mean_difference': -3.643428434667366,
'wasserstein': 3.643428434667366,
'kolmogorov_smirnov': KstestResult(statistic=0.2913775225333014, pvalue=0.00013914094110123454)}]
Comparing the distributions of predictions for two datasets is one of the main indicator we use in order to detect data drift. The two other indicators are:
distribution of the target (see get_target_drift)
performance metrics (see get_performance_metrics_drift)
Explain data drift by computing the drift importances
Drift importances can be thought as equivalent of feature importances but in terms of data drift.
# plot drift importances
>>> cinnamon.plot_tree_based_drift_importances(drift_explainer, n=7)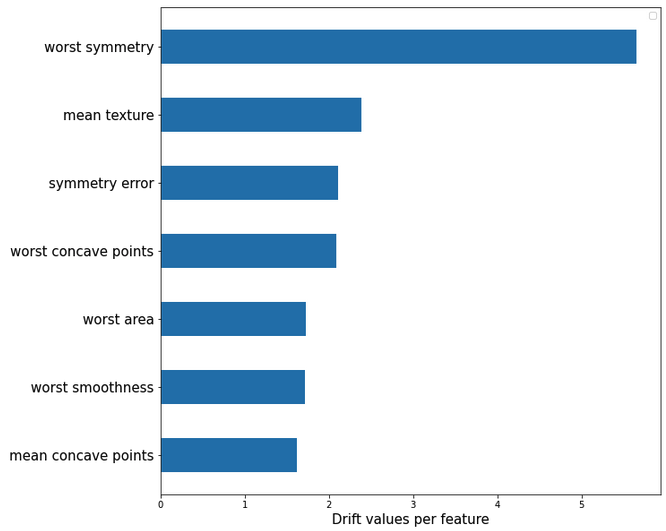
Here the feature worst symmetry is rightly identified as the one which contributes the most to the data drift.
More
See “notes” below to explore all the functionalities of CinnaMon.
🛠 Installation
CinnaMon is intended to work with Python 3.7 or above. Installation can be done with pip:
$ pip install cinnamon🔗 Notes
CinnaMon documentation
The two main classes of CinnaMon are ModelDriftExplainer and AdversarialDriftExplainer
CinnaMon supports both model specific and model agnostic methods for the computation of drift importances. More information here.
CinnaMon can be used with any model or ML pipeline thanks to model agnostic mode.
See notebooks in the examples/ directory to have an overview of all functionalities. Notably:
These two notebooks also go deeper into the topic of how to correct data drift, making use of AdversarialDriftExplainer
See also the slide presentation of the CinnaMon library. And the video presentation.
👍 Contributing
Check out the contribution section.
📝 License
CinnaMon is free and open-source software licensed under the MIT.


Download files
Download the file for your platform. If you're not sure which to choose, learn more about installing packages.
Source Distribution
Built Distribution
Filter files by name, interpreter, ABI, and platform.
If you're not sure about the file name format, learn more about wheel file names.
Copy a direct link to the current filters
File details
Details for the file cinnamon-0.2.1.tar.gz.
File metadata
- Download URL: cinnamon-0.2.1.tar.gz
- Upload date:
- Size: 72.4 kB
- Tags: Source
- Uploaded using Trusted Publishing? No
- Uploaded via: twine/4.0.2 CPython/3.9.12
File hashes
| Algorithm | Hash digest | |
|---|---|---|
| SHA256 |
ad1da6ac65c78fd737395e2e4bfdbcbd2c3847ea9d3f866f1ae37fcdc47b9e80
|
|
| MD5 |
bc150f3c2372ef1afc4215f987839cf3
|
|
| BLAKE2b-256 |
1f5f4ea6e216f0c65fb47617c3857a32301048ef9131919ab44506f05b4846da
|
File details
Details for the file cinnamon-0.2.1-py3-none-any.whl.
File metadata
- Download URL: cinnamon-0.2.1-py3-none-any.whl
- Upload date:
- Size: 85.8 kB
- Tags: Python 3
- Uploaded using Trusted Publishing? No
- Uploaded via: twine/4.0.2 CPython/3.9.12
File hashes
| Algorithm | Hash digest | |
|---|---|---|
| SHA256 |
270a06ed40f02b63b44aad9f0115afdcb2e7c3475be85cbe0fadfb82f7e1e7ed
|
|
| MD5 |
7a029f2d6b03adef587242277e8e5385
|
|
| BLAKE2b-256 |
d7107150cb9b910ff00099af9ca6143d440a31c50467afe15e08d0d1246763cb
|


