Package used for cleaning, restructuring, logging, and plotting of financial data retrieved from the Twelve Data API.

Project description
The claydates Package
The claydates package serves to clean and restructure financial data retrieved from the Twelve Data API. Secondarily, it allows for the user to nicely plot time series data using numerous cleaning and restructuring methodologies. Additionally, it provides the user with the option to store information on data quality during usage, which may later provide insight into changes in data quality over time for certain tickers.
The program is comprised of 4 main classes:
    1.  SingleTickerProcessor
            - Used for gathering and cleaning time series data.
            - Determines where there might be any missing dates coming in from the API call.
            - Also can be used for logging the quality of data received from the API call to a CSV file, to be reviewed at a later date.
            - Also used to iteratively construct one or more time series objects of the SingleTickerProcessor class.
            - It is the parent class of the SingleTickerPlotter class, which is the parent of the multiTickerPlotter class.

    2.  SingleTickerPlotter
            - Used for plotting time series data.
            - Also can be used for logging the quality of data received from the API call to a csv file, to be reviewed at a later date.
            - It is also used to iteratively construct one or more time series objects of the SingleTickerPlotter class.
            - It is the child class of SingleTickerProcessor, and the parent class of multiTickerPlotter.

    3.  MultiTickerProcessor
            - Used for gathering and processing time series data for one or more ticker symbols.
            - Creates a list of SingleTickerProcessor class objects, and then organizes data in accordance with the various arguments passed or not-passed to methods belonging to the SingleTickerProcessor class.
            - Also can be used for logging the quality of data received from the API call to a CSV file, to be reviewed at a later date.
            - It is the parent class of MultiTickerPlotter.

    4.  MultiTickerPlotter
            - Used for gathering and processing time series data for one or more ticker symbols.
            - Creates a list of SingleTickerPlotter class objects, and then organizes data in accordance with the various arguments passed or not passed to the various methods belonging to the SingleTickerPlotter class.
            - Also can be used for logging the quality of data received from the API call to a CSV file, to be reviewed at a later date.
            - It is the child class of MultiTickerProcessor and SingleTickerPlotter.
Directory Tree
                                claydatesRootDirectory
                                │   README.md
                                │   setup.py
                                │   requirements.txt
                                │   LICENSE
                                │   .gitignore
                                │
                                └───claydates
                                │   │   __init__.py
                                │   │
                                │   └───processors
                                │   │       __init__.py
                                │   │       singleTickerProcessor.py
                                │   │       multiTickerProcessor.py
                                │   │
                                │   └───plotters
                                │   │       __init__.py
                                │   │       singleTickerPlotter.py
                                │   │       multiTickerPlotter.py
                                │   │
                                │   └───datasets
                                │   │       currencyPairs.txt
                                │   │       exampleSet.csv
                                │   │       key.txt
                                │   │       missingDataLog.csv
                                │   │
                                │   └───examples
                                │           __init__.py
                                │           examplesSingleTickerProcessor.py
                                │           examplesMultiTickerProcessor.py
                                │           examplesSingleTickerPlotter.py
                                │           examplesMultiTickerPlotter.py
                                │
                                └───tests
                                        __init__.py
                                        testSingleTickerProcessor.py
                                        testMultiTickerProcessor.py
                                        testSingleTickerPlotter.py
                                        testMultiTickerPlotter.py
Quick Usage Examples
For additional descriptions of arguments and methods, refer to the examples folder, which further details each quick usage example provided here.
SingleTickerProcessor
1.) from claydates import SingleTickerProcessor

    1a.) singleTickerProcessor = SingleTickerProcessor('QQQ', '1min', 1170)
    1b.) singleTickerPlotter = SingleTickerPlotter(tickerSymbol = 'QQQ', tickInterval = '1min', numberOfUnits = 1170,
                                          percentageChange = True, timeZone = 'America/New_York', quoteCurrency = 'USD',
                                          logMissingData = True, mockResponse = False, spacingFactor = 14,
                                          seriesType = 'Close', scalerRange = (0,1), binningFactor = 10
                                          figureSize = [14.275,9.525], labelsize = 16, color = 'black')
2.) from claydates import SingleTickerProcessor

    2a.) singleTickerPlotter.datetimeHandler('missingDataIncludedInFrame')
    2b.) singleTickerPlotter.datetimeHandler('missingPercentage')
    2c.) singleTickerPlotter.datetimeHandler('lagTime')
3.) from claydates import SingleTickerProcessor

    3a.) singleTickerProcessor.unalteredFrameGetter()
MultiTickerProcessor
1.) from claydates import MultiTickerProcessor

    1a.) multiTickerProcessor = MultiTickerProcessor(['QQQ','SPY','IWM','DIA'], '1min', 390)
    1b.) multiTickerProcessor = MultiTickerProcessor(tickerSymbols = ['QQQ','SPY','IWM','DIA'], tickInterval = '1min', numberOfUnits = 1170,
                                                     percentageChange = True, timeZone = 'America/New_York', quoteCurrency = 'USD',
                                                     logMissingData = True, mockResponse = False)
2.) from claydates import MultiTickerProcessor
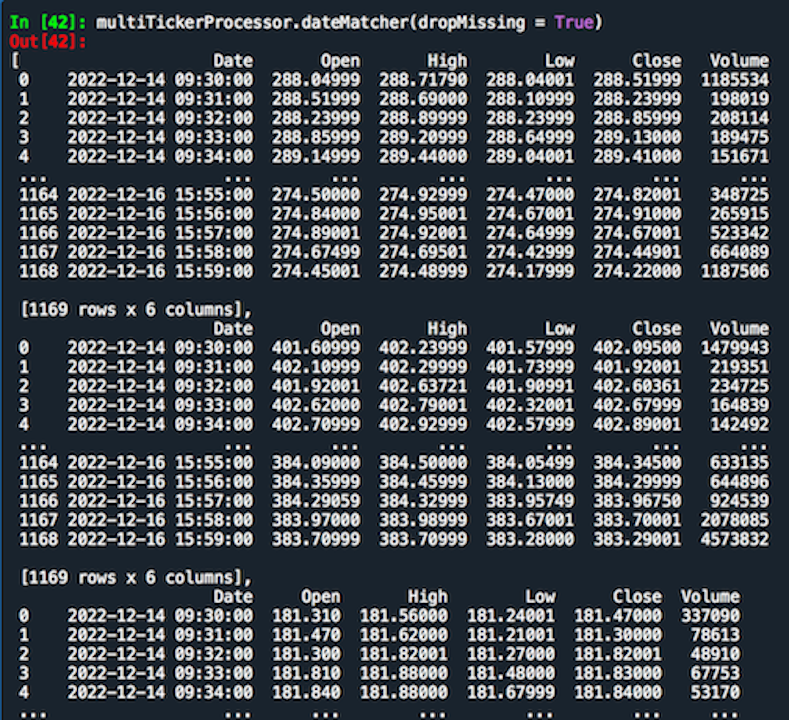
2a.) multiTickerProcessor.dateMatcher(dropMissing = True)
3.) from claydates import MultiTickerProcessor

    3a.) multiTickerProcessor.unalteredFrames(dataType = 'pandas')
4.) from claydates import MultiTickerProcessor

    4a.) multiTickerProcessor.missingUnitsIncluded(dataType = 'pandas', interpolationMethod = None, matchDates = False)
5.) from claydates import MultiTickerProcessor

    5a.) multiTickerProcessor.missingUnitsExcluded(dataType = 'pandas', matchDates = True)
6.) from claydates import MultiTickerProcessor

    6a.) multiTickerProcessor.missingPercentages(onlyPrint = True)
SingleTickerPlotter
1.) from claydates import SingleTickerPlotter

    1a.) singleTickerPlotter = SingleTickerPlotter('QQQ', '1min', 1170)
    1b.) singleTickerPlotter = SingleTickerPlotter(tickerSymbol = 'QQQ', tickInterval = '1min', numberOfUnits = 1170,
                                                   percentageChange = True, timeZone = 'America/New_York', quoteCurrency = 'USD',
                                                   logMissingData = True, mockResponse = False, spacingFactor = 14,
                                                   seriesType = 'Close', scalerRange = (0,1), binningFactor = 10,
                                                   figureSize = [14.275,9.525], labelsize = 16, color = 'black')
2.) from claydates import SingleTickerPlotter

    2a.) singleTickerPlotter.datetimeHandler('missingDataIncludedInFrame')
    2b.) singleTickerPlotter.datetimeHandler('missingDataIncludedInFrame')
    2c.) singleTickerPlotter.datetimeHandler('missingDataIncludedInFrame')
3.) from claydates import SingleTickerPlotter

    3a.) singleTickerPlotter.unalteredFrameGetter()
4.) from claydates import SingleTickerPlotter

    4a.) singleTickerPlotter.standardSinglePlot()
5.) from claydates import SingleTickerPlotter

    5a.) singleTickerPlotter.missingDataPlot()
6.) from claydates import SingleTickerPlotter

    6a.) singleTickerPlotter.interpolatedSinglePlot(methodology = 'linear')
    6b.) singleTickerPlotter.interpolatedSinglePlot(methodology = 'cubic')
7.) from claydates import SingleTickerPlotter
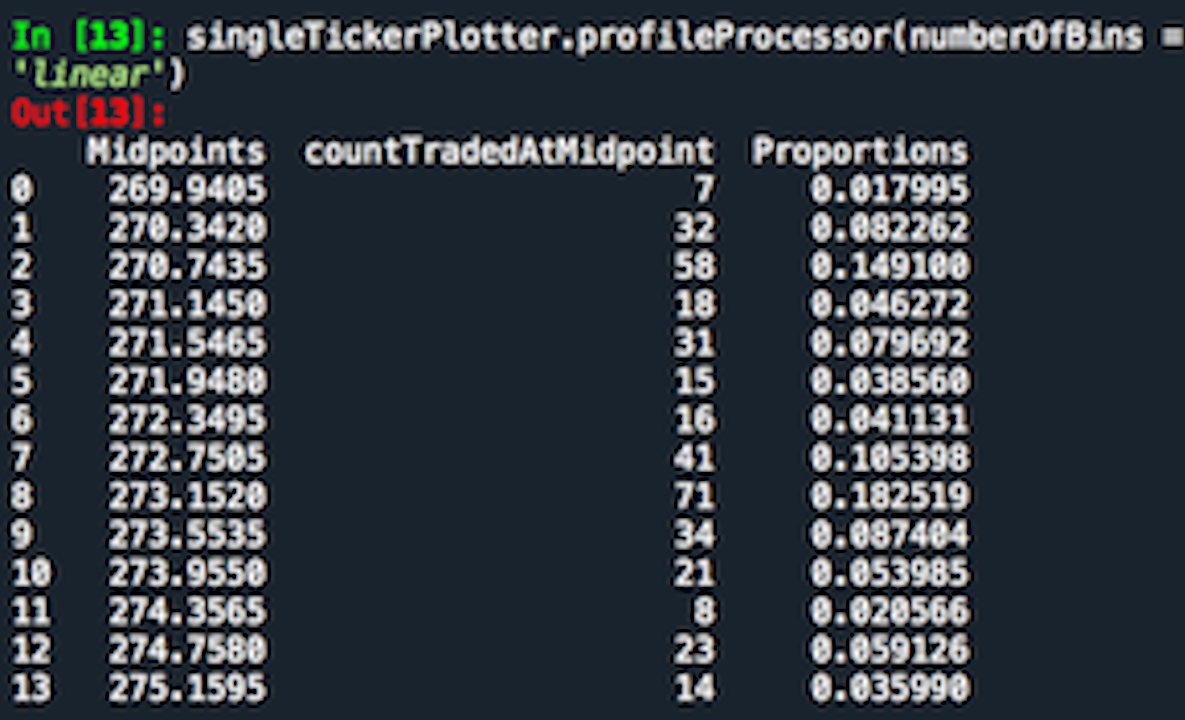
7a.) singleTickerPlotter.profileProcessor(numberOfBins = 10, methodology = 'count', interpolation = 'linear')
8.) from claydates import SingleTickerPlotter

    8a.) singleTickerPlotter.singleProfilePlot(seriesType = 'standard', binningType = 'standard', methodology = 'price',
                                      numberOfBins = None, scaledX = True, scaledY = False, interpolation = None)
9.) from claydates import SingleTickerPlotter

    9a.) singleTickerPlotter.externalWindowSinglePlot()
10.) from claydates import SingleTickerPlotter
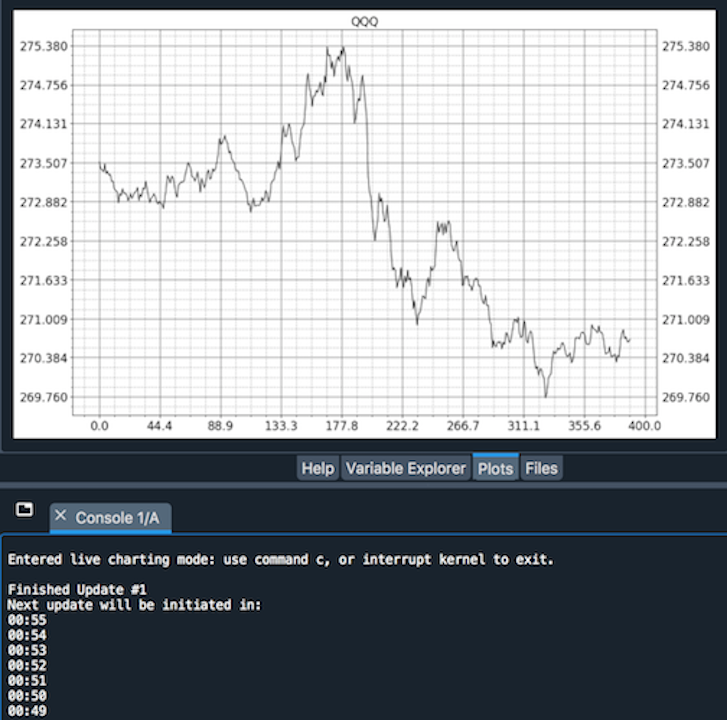
10a.) singleTickerPlotter.liveSinglePlot(numberOfUpdates = 14400, interactiveExternalWindow = False, secondsToSleep = 55)
MultiTickerPlotter
1.) from claydates import MultiTickerPlotter

    1a.) multiTickerPlotter = MultiTickerPlotter(['QQQ','SPY','IWM','DIA'], '1min', 390)
    1b.) multiTickerPlotter = MultiTickerPlotter(tickerSymbols = ['QQQ','SPY','IWM','DIA'], tickInterval = '1min', numberOfUnits = 1170,
                                                 percentageChange = True, timeZone = 'America/New_York', quoteCurrency = 'USD',
                                                 logMissingData = True, mockResponse = False, spacingFactor = 14,
                                                 seriesType = 'Close', scalerRange = (0,1), binningFactor = 10,
                                                 figureSize = [14.275,9.525], labelsize = 16, color = 'black')
2.) from claydates import MultiTickerPlotter
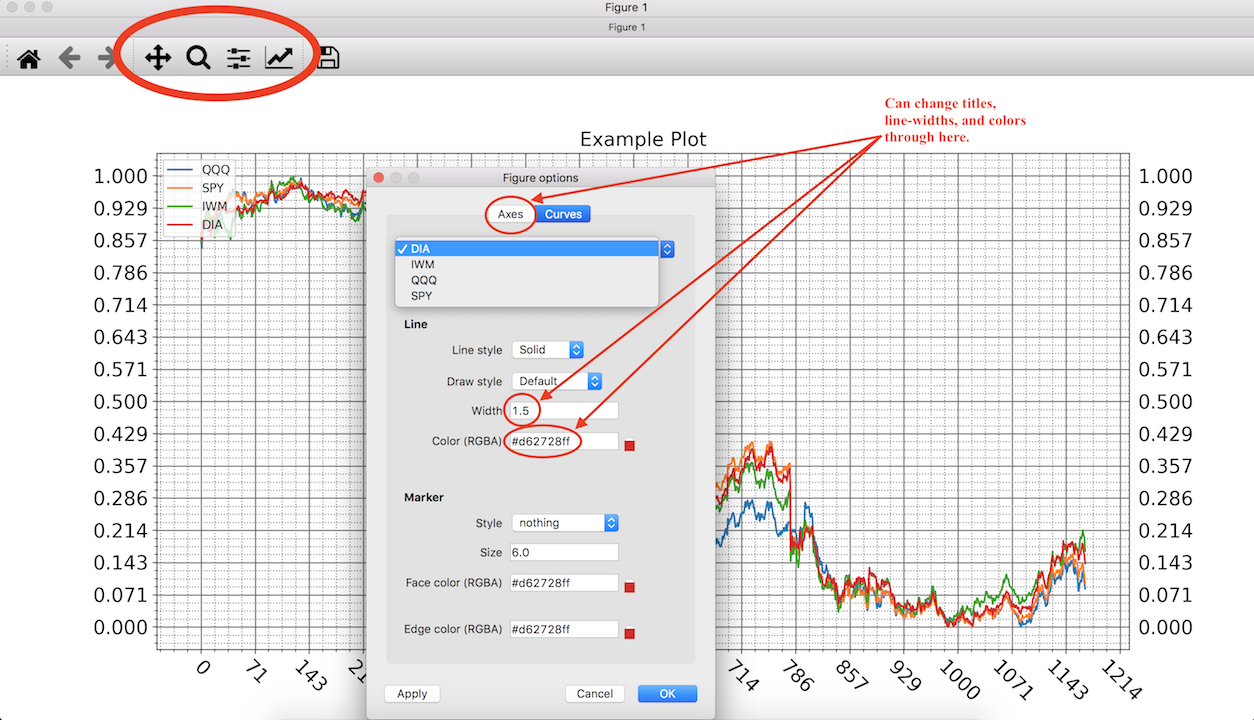
2a.) multiTickerPlotter.standardMultiPlot(method = multiTickerPlotter.missingUnitsExcluded, matchDates = True, interpolationMethod = None,
interactiveExternalWindow = False, scaled = True, plotTitle = 'Example Plot')
3.) from claydates import MultiTickerPlotter

    3a.) multiTickerPlotter.cyclePlot(method = multiTickerPlotter.missingUnitsExcluded, matchDates = True, interpolationMethod = None,
                                      interactiveExternalWindow = False, scaled = True, secondsToPauseFor = 15)
4.) from claydates import MultiTickerPlotter
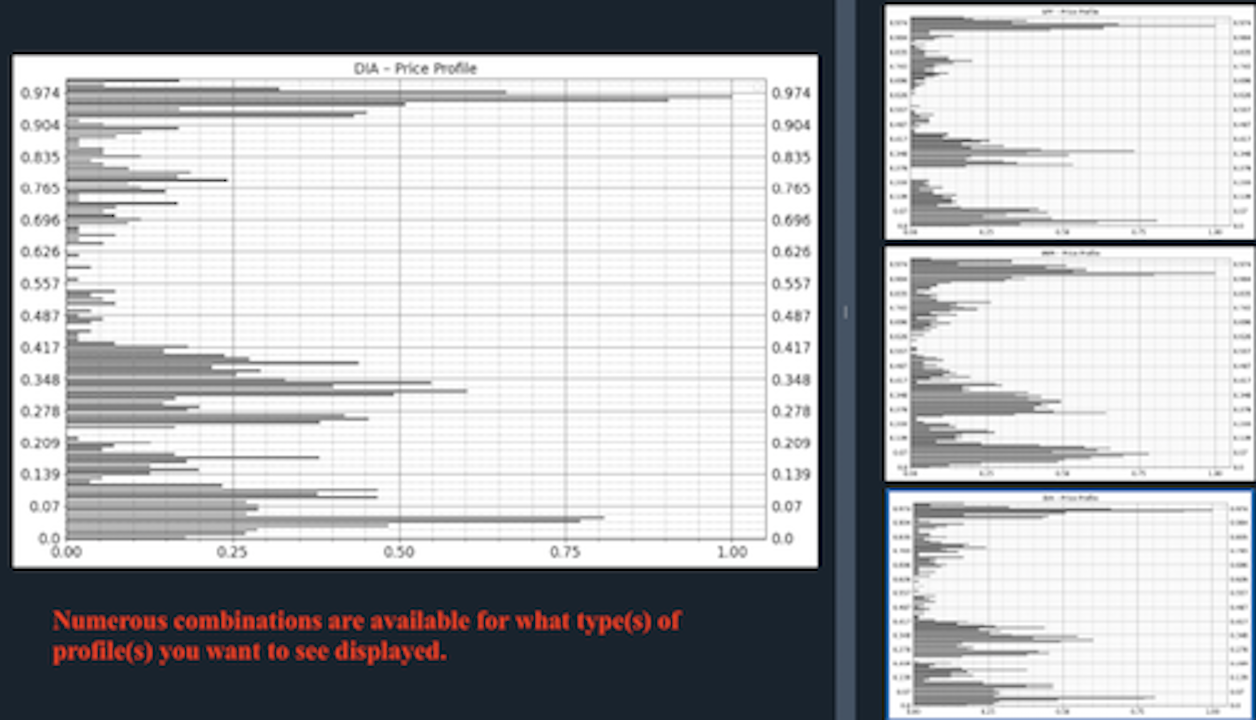
4a.) multiTickerPlotter.profileCyclerPlot('standard','standard', methodology = 'price', numberOfBins = None,
scaledX = True, scaledY = True, interpolation = None)
5.) from claydates import MultiTickerPlotter

    5a.) multiTickerPlotter.multipleExternalWindowsPlot(method = multiTickerPlotter.missingUnitsExcluded, matchDates = True, interpolationMethod = None,
                                                        interactiveExternalWindow = False, scaled = True)
6.) from claydates import MultiTickerPlotter

    6a.) multiTickerPlotter.liveMultiPlot(method = multiTickerPlotter.missingUnitsExcluded, matchDates = True, interpolationMethod = None,
                                          interactiveExternalWindow = False, scaled = True, numberOfUpdates = 14400, secondsToSleepFor = 55)
History
version 1.0.6.
- Something went wrong with the datasets folder in versions 1.0.4. and 1.0.5. Fixed this.
- December, 2022.
- https://pypi.org/project/claydates/1.0.6/
version 1.0.5.
- Removed Table of Contents.
- December, 2022.
- https://pypi.org/project/claydates/1.0.5/
version 1.0.4.
- Added Table of Contents.
- Fixed typo in singleTickerProcessor.py.
- December, 2022.
- https://pypi.org/project/claydates/1.0.4/
version 1.0.3.
- Fixed typo in README.md.
- December, 2022.
- https://pypi.org/project/claydates/1.0.3/
version 1.0.2.
- Added datasets folder to install.
- December, 2022.
- https://pypi.org/project/claydates/1.0.2/
version 1.0.1.
- Fixed installation issue.
- December, 2022.
- https://pypi.org/project/claydates/1.0.1/
version 1.0.0.
- Developed and published.
- December, 2022.
- https://pypi.org/project/claydates/1.0.0/
Gallery


Download files
Download the file for your platform. If you're not sure which to choose, learn more about installing packages.
Source Distribution
Built Distribution
Filter files by name, interpreter, ABI, and platform.
If you're not sure about the file name format, learn more about wheel file names.
Copy a direct link to the current filters
File details
Details for the file claydates-1.0.6.tar.gz.
File metadata
- Download URL: claydates-1.0.6.tar.gz
- Upload date:
- Size: 28.2 kB
- Tags: Source
- Uploaded using Trusted Publishing? No
- Uploaded via: twine/4.0.2 CPython/3.9.15
File hashes
| Algorithm | Hash digest | |
|---|---|---|
| SHA256 |
d3fae21034753aca514f5745040411d79f7af0f93f722d3f978f22b7ab1d3340
|
|
| MD5 |
d95cef21070081b314743ca360ce2808
|
|
| BLAKE2b-256 |
b7c000b443552deec669619cc8f74682e9476b44df2a7d412030433e6619d074
|
File details
Details for the file claydates-1.0.6-py3-none-any.whl.
File metadata
- Download URL: claydates-1.0.6-py3-none-any.whl
- Upload date:
- Size: 37.8 kB
- Tags: Python 3
- Uploaded using Trusted Publishing? No
- Uploaded via: twine/4.0.2 CPython/3.9.15
File hashes
| Algorithm | Hash digest | |
|---|---|---|
| SHA256 |
184304587f7f020d18a164b99454efaa3cdf63ebcc10400ea9330edd7f75e21d
|
|
| MD5 |
f051bd5e051450a17ca596cc9a8b5fd7
|
|
| BLAKE2b-256 |
00e277b84f620151a5bb953130858f2b393b7fe5a674b8fd3c583b7a63305589
|


