Got a spectra? Use this to find what is the observed colour.

Project description
coloured_spectra
Got a spectra? Use this to find the observed colour!
Works great when applied to a single spectra. Using this for hyperspectral though... this Python implementation is too slow to be practical. (Can be magnitudes faster if coded in Julia)
Documentation site: https://yiweimao.github.io/coloured_spectra/
Blog post: https://yiweimao.github.io/blog/colour_of_spectra/
Install
pip install coloured-spectra
Examples
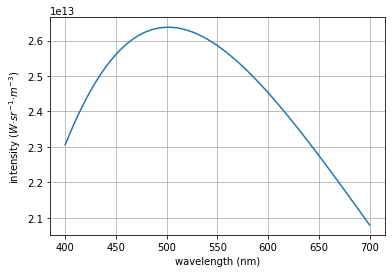
Find the observed colour of a blackbody at 6500 K.
from coloured_spectra.coloured_spectra import *
import numpy as np
import pickle
import matplotlib.pyplot as plt
import cv2
/Users/eway/.pyenv/versions/3.8.3/lib/python3.8/site-packages/pandas/compat/__init__.py:97: UserWarning: Could not import the lzma module. Your installed Python is incomplete. Attempting to use lzma compression will result in a RuntimeError.
  warnings.warn(msg)
bb = Blackbody(5778)
bb.plot()
def show_blackbody_colour(T_K):
    bb = Blackbody(T_K,np.linspace(380,750))

    sRGB = spectra2sRGB(bb.λ_nm,bb.B_λT)

    # Due to normalisation choices, the brightness can change depending on the spectra
    # show the colour at max brightness
    HSV = cv2.cvtColor(np.reshape(sRGB,(1,1,3)), cv2.COLOR_RGB2HSV_FULL)
    HSV[0,0,2] = 255
    RGB = cv2.cvtColor(HSV, cv2.COLOR_HSV2RGB_FULL)

    plot_colour(RGB)
This approximates the colour of the Sun with a blackbody temperature of 5778 K.
show_blackbody_colour(5778)

show_blackbody_colour(11000) # what about the star Rigel?

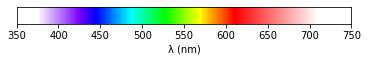
If you have a hyperspectral line, you can colour it in by the observed colour. For this, the invisible UV and NIR is painted white on top of a black background. This look up table spectrum is:
plot_hsv_LUT_spectrum()
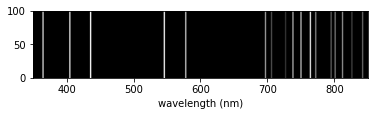
lines_nm = [254,436,546,764,405,365,578,750,738,697,812,772,912,801,842,795,706,826,852,727] # approx sorted by emission strength
img = np.zeros((100,1000))
wavelengths = np.linspace(350,850,1000)

strength = 1.
for line in lines_nm:
    indx = np.sum(wavelengths<line)
    if indx > 0 and indx < 1000:
        img[:,indx-2:indx+2] = strength
        strength -= 0.05

plt.imshow(img,cmap="gray",extent=[np.min(wavelengths),np.max(wavelengths),0,np.shape(img)[0]])
plt.xlabel("wavelength (nm)")
Text(0.5, 0, 'wavelength (nm)')
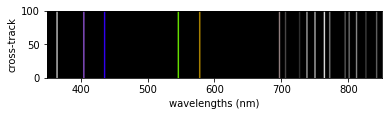
You can see the emission lines have been coloured.
colour_hyperspectral_line(wavelengths,img)
100%|██████████| 100/100 [00:01<00:00, 57.32it/s]
You can also return a column of observed colour given a hyperspectral line. It's just very slow.
hyperspec_line2colour(wavelengths,img)
100%|██████████| 100/100 [00:03<00:00, 31.57it/s]
You may want to colour in a band of a multispectral or hyperspectral datacube according to the central wavelength.

Release history Release notifications | RSS feed


Download files
Download the file for your platform. If you're not sure which to choose, learn more about installing packages.
Source Distribution
Built Distribution
Filter files by name, interpreter, ABI, and platform.
If you're not sure about the file name format, learn more about wheel file names.
Copy a direct link to the current filters
File details
Details for the file coloured_spectra-0.0.11.tar.gz.
File metadata
- Download URL: coloured_spectra-0.0.11.tar.gz
- Upload date:
- Size: 2.6 MB
- Tags: Source
- Uploaded using Trusted Publishing? No
- Uploaded via: twine/3.2.0 pkginfo/1.5.0.1 requests/2.24.0 setuptools/41.2.0 requests-toolbelt/0.9.1 tqdm/4.47.0 CPython/3.8.3
File hashes
| Algorithm | Hash digest | |
|---|---|---|
| SHA256 |
047d05c22de141ab9e199cbb0ade145337fa171db23c49a755e8badf2809a63f
|
|
| MD5 |
ca7c2330139c32962e19ae394b0a8f85
|
|
| BLAKE2b-256 |
6bfb9f2c929635acec9b44500e351bfb436c6864f9e763fcd3552f3015b7ea7b
|
File details
Details for the file coloured_spectra-0.0.11-py3-none-any.whl.
File metadata
- Download URL: coloured_spectra-0.0.11-py3-none-any.whl
- Upload date:
- Size: 12.0 kB
- Tags: Python 3
- Uploaded using Trusted Publishing? No
- Uploaded via: twine/3.2.0 pkginfo/1.5.0.1 requests/2.24.0 setuptools/41.2.0 requests-toolbelt/0.9.1 tqdm/4.47.0 CPython/3.8.3
File hashes
| Algorithm | Hash digest | |
|---|---|---|
| SHA256 |
36193f6f6f5c6a35d01fc50b1da63c09e75336bbec34c3726d081928e7546761
|
|
| MD5 |
5a35facb60549f0e28f03c2697c395d6
|
|
| BLAKE2b-256 |
1e56f8b9a534e6d6faedab66cf2f968d4d03362a978b3a88e3f9a59a4bb3d924
|


