Covid-Surge is a utility for computing and comparing mortality surge periods of communities afflicted by the COVID-19 virus pandemic.

Project description
Covid-surge
COVID-19 mortality surge period calculation for communities afflicted by the corona virus SARS-CoV-2.
- University of Massachusetts Lowell
- Dept. of Chemical Engineering (Nuclear Program)
- Prof. Valmor F. de Almeida (valmor_dealmeida@uml.edu)


Preprint: How Long is the Worst Part of the COVID-19 Mortality Surge?
| ----------------------------------------------------|WORLD|--------------------------------------------------------- |
 |
| Data source. |
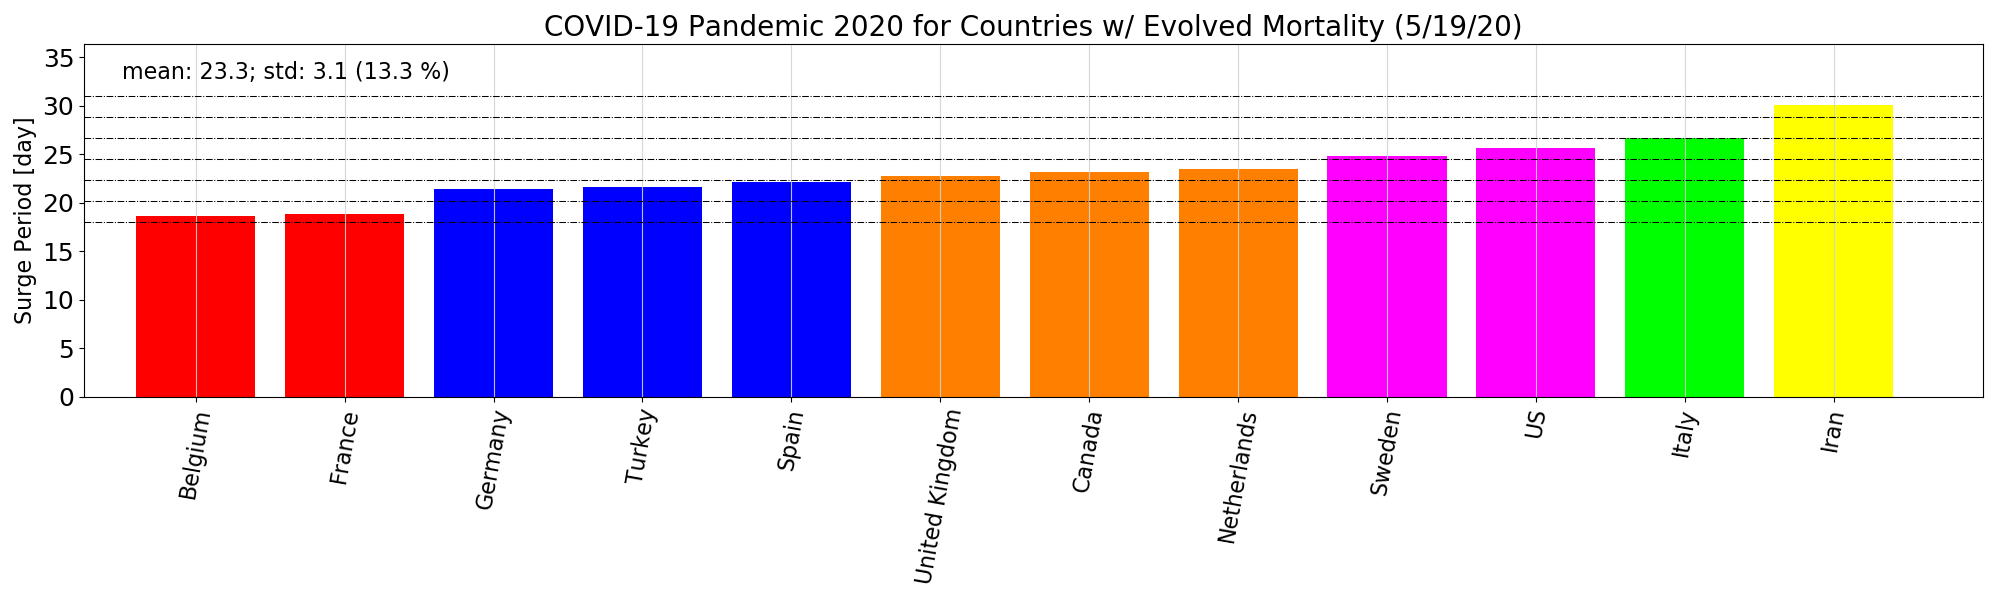
| Distribution of mortality critical surge periods for the countries with fully evolved epidemics. The average critical surge period is the number of days between the points of maximum and minimum curvatures on the sigmoid curve approximating the data. Countries to the right are less stressed than countries to the left. The colored bar plot shows locations grouped by 2-day bin widths. |
| The world average critical surge period at the date indicated by the plot is 23 days with a 3-day standard deviation. |
| To update this plot with live data, run this Jupyter Notebook. |
| ---------------------------------------------------------|US|------------------------------------------------------- |
 |
| Data source. |
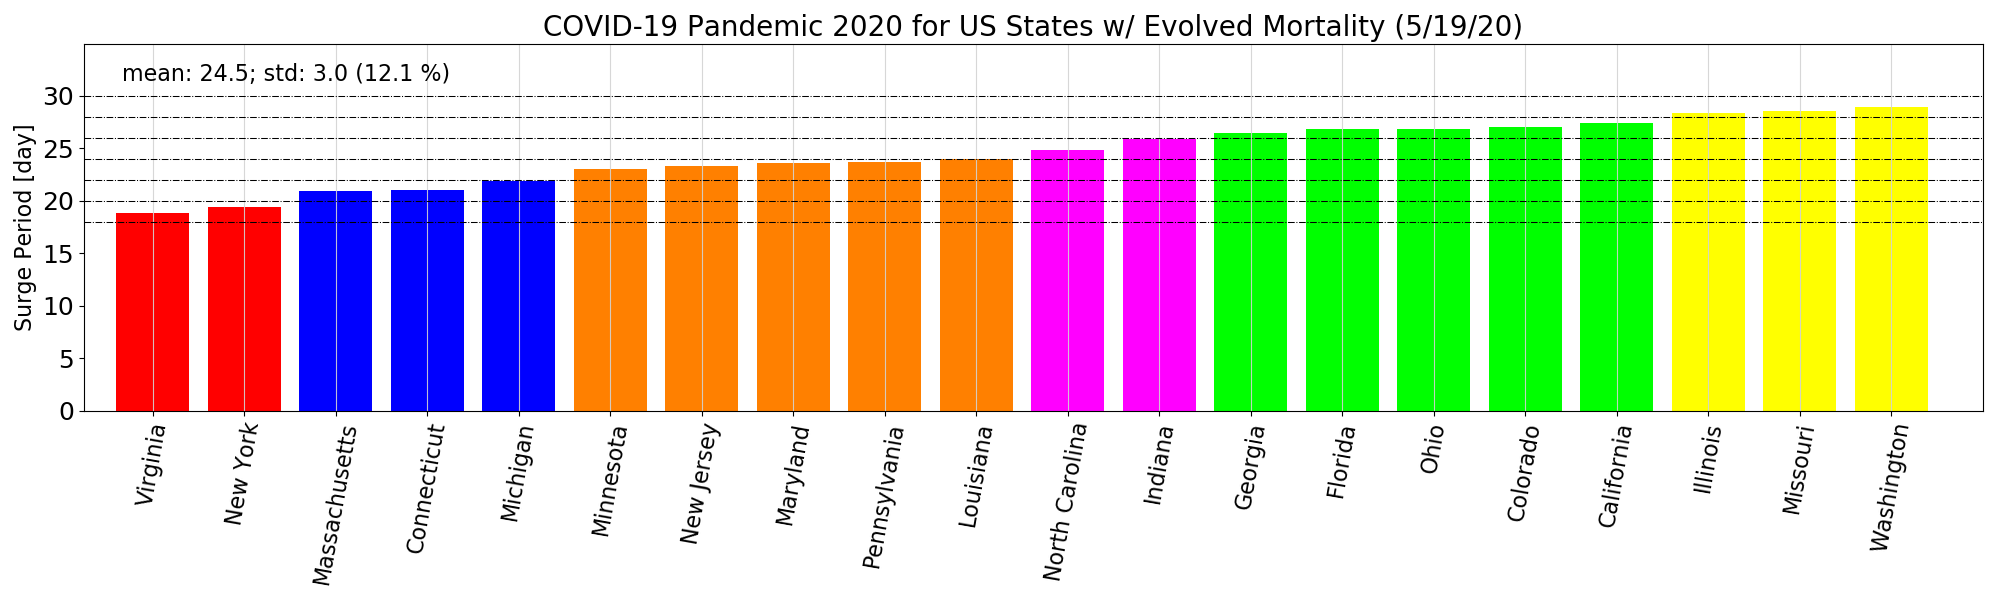
| Distribution of mortality critical surge periods for the US states with fully evolved epidemics. The average critical surge period is the number of days between the points of maximum and minimum curvatures on the sigmoid curve approximating the data. Countries to the right are less stressed than countries to the left. The colored bar plot shows locations grouped by 2-day bin widths. |
| The US state average critical surge period at the date indicated by the plot is 25 days with a 3-day standard deviation. |
| To update this plot with live data, run this Jupyter Notebook. |
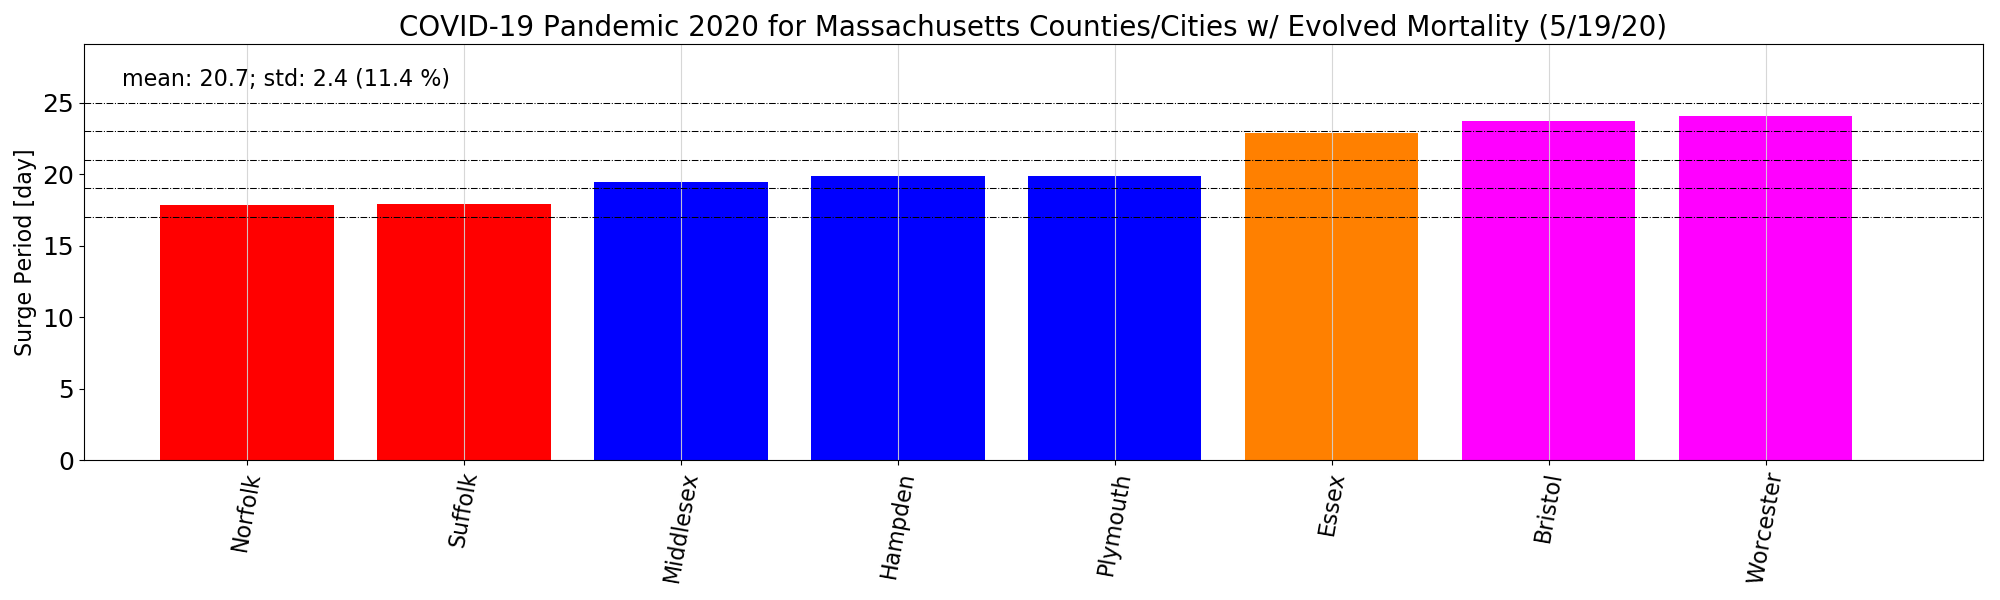
| --------------------------------------------|US State Counties/Towns (Top 3)|--------------------------------------- |
 |
| Data source. |
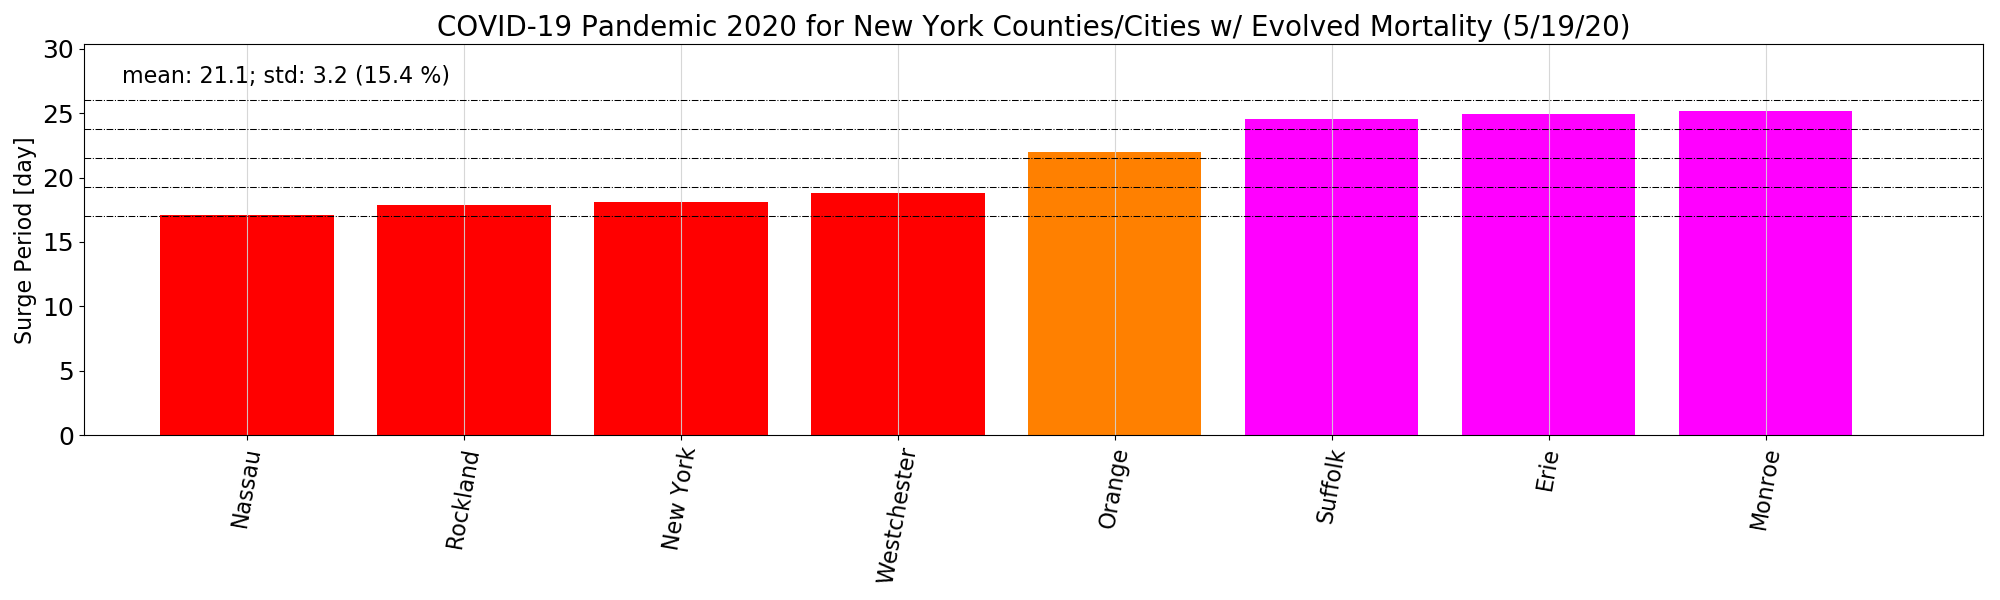
| Distribution of mortality critical surge periods for the US state New York with fully evolved epidemics. The average critical surge period is the number of days between the points of maximum and minimum curvatures on the sigmoid curve approximating the data. Countries to the right are less stressed than countries to the left. The colored bar plot shows locations grouped by 2-day bin widths. |
| The average critical surge period at the date indicated by the plot is 21 days with a 3-day standard deviation. |
| To update this plot with live data, run this Jupyter Notebook. |
| ------------------------------------------------------------------------------------------------------------------------- |
 |
| Data source. |
| ------------------------------------------------------------------------------------------------------------------------- |
 |
| Data source. |
Release history Release notifications | RSS feed


Download files
Download the file for your platform. If you're not sure which to choose, learn more about installing packages.
Source Distribution
covid-surge-0.0.41.tar.gz
(2.8 MB
view details)
Built Distribution
Filter files by name, interpreter, ABI, and platform.
If you're not sure about the file name format, learn more about wheel file names.
Copy a direct link to the current filters
File details
Details for the file covid-surge-0.0.41.tar.gz.
File metadata
- Download URL: covid-surge-0.0.41.tar.gz
- Upload date:
- Size: 2.8 MB
- Tags: Source
- Uploaded using Trusted Publishing? No
- Uploaded via: twine/3.1.1 pkginfo/1.5.0.1 requests/2.23.0 setuptools/44.1.0 requests-toolbelt/0.9.1 tqdm/4.40.0 CPython/3.6.10
File hashes
| Algorithm | Hash digest | |
|---|---|---|
| SHA256 |
8f06e301a176ca63389ecf3c406a0c42affb8fcb823d78e5b4e51aa12a76c7dd
|
|
| MD5 |
04dd6d27b9de8f8531ee3752acfaa102
|
|
| BLAKE2b-256 |
b6da1a398797b77b3c80a50e5745c96ab2b8c6071fd518ae4752696daf1646aa
|
File details
Details for the file covid_surge-0.0.41-py3-none-any.whl.
File metadata
- Download URL: covid_surge-0.0.41-py3-none-any.whl
- Upload date:
- Size: 51.5 kB
- Tags: Python 3
- Uploaded using Trusted Publishing? No
- Uploaded via: twine/3.1.1 pkginfo/1.5.0.1 requests/2.23.0 setuptools/44.1.0 requests-toolbelt/0.9.1 tqdm/4.40.0 CPython/3.6.10
File hashes
| Algorithm | Hash digest | |
|---|---|---|
| SHA256 |
6dc62b05912a0448358146eae658446934dc5ade3a353406f9dfae1c9bbfee0f
|
|
| MD5 |
dbce762b571d207a90b8f895638eccdf
|
|
| BLAKE2b-256 |
73a4e4074be4a7a7911de46d0974ec93ce1b78940a3c94cd3bccdb0ee18e06d1
|


