lag time and case fatality rate (CFR)

Project description
covidlag

DOI: https://doi.org/10.24433/CO.8676218.v1
Published papers on covidlag: Takefuji Y. Python Programming in PyPI for Translational Medicine. International Journal of Translational Medicine. 2021; 1(3):323-331. https://doi.org/10.3390/ijtm1030019
Takefuji, Y. COVID-19 lag time and case fatality rate calculation tool, as well as a tool to identify when policymakers made mistakes. Netw Model Anal Health Inform Bioinforma 12, 33 (2023). https://doi.org/10.1007/s13721-023-00430-5
covidlag has been downloaded 21400 times worldwide.
Another is under review.
Data science is useful to investigate the progression of the pandemic.
covidlag is an open-source program which is available in public and can be installed by the PyPI package command (pip). covidlag can calculate the lag time between infection peaks and death peaks. covidlag can also compute death rate per infection or case fatality ratio (CFR). CFR is the proportion of individuals diagnosed with a disease who die from that disease and is therefore a measure of severity among detected cases.
CFR is a dynamic value which is continuously changing. In the conventional methods, CFR is used for retrospective observational studies and are not suitable for continuous time series data.
According to CDC: https://www.cdc.gov/foodnet/reports/data/case-fatality.html
the CFR is calculated by: CFR=(number of cases in which patient died/number of cases).
The CDC method for CFR is appropriate for annual statistics, but not for time series data analysis.
In the current CFR calculation, we need to determine two indicators: the number of sampled days and its range of start and ending dates.
Two indicators significantly influence CFR.
COVID-19 variants and vaccinations can significantly change the lag time and the CFR so that the convetional distribution approaches are not suitable for ongoing time series data.
There is no algorithm to select two appropriate indicators.
The proposed algorithm is based on a robust correlation between infection and death.
The extreme values such as maxima and minima can be used for computing the accurate lag time and the CFR.
The detailed method is under review.
How to install covidlag
Covidlag is available in public and can be installed by the following PyPI packaging command:
$ pip install covidlag
$ pip install covidlag --force-reinstall --no-cache-dir --no-binary :all:
How to run covidlag
covidlag needs at least three parameters (country name, sampled days, regression polinomial degree).
Run the following command composed of the country name, sampled days, the degree of polynomial curve-fitting, and options (L: left, R: right, C: center):
$ covidlag 'United States' 600 13 L
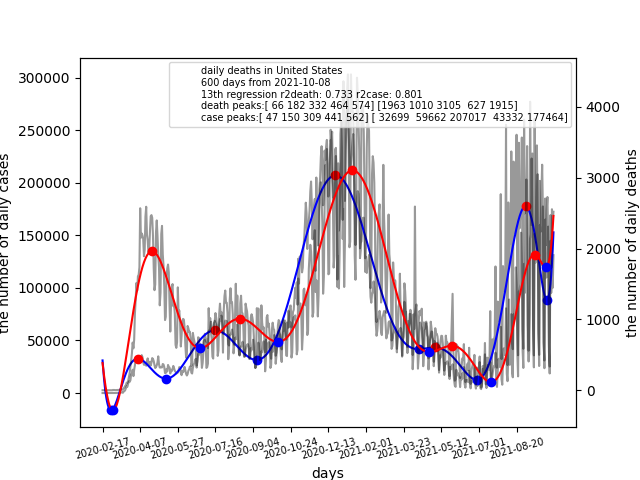 This example shows that r-squared of infections:0.803 and r-squared of deaths:0.733
The death peaks are [ 66, 182, 332, 464, 574]. The case peaks are [ 47, 150, 309, 441, 562].
maxima information
death peak: 2020-04-23
death peak: 2020-08-17
death peak: 2021-01-14
death peak: 2021-05-26
death peak: 2021-09-13
case peak: 2020-04-04
case peak: 2020-07-16
case peak: 2020-12-22
case peak: 2021-05-03
case peak: 2021-09-01
maxiddeath (array([ 66, 182, 332, 464, 574]),)
maxidcase (array([ 47, 150, 309, 441, 562]),)
ydeath[maxiddeath] [1963 1010 3105  627 1915]
ycase[maxidcase] [ 32699  59662 207017  43332 177464]
==================================
minima information
death minima: 2020-03-02
death minima: 2020-06-26
death minima: 2020-10-07
death minima: 2021-04-26
death minima: 2021-07-17
death minima: 2021-09-28
case minima: 2020-02-28
case minima: 2020-05-11
case minima: 2020-09-09
case minima: 2021-04-12
case minima: 2021-06-28
case minima: 2021-09-29
miniddeath (array([ 14, 130, 233, 434, 516, 589]),)
minidcase (array([ 11,  84, 205, 420, 497, 590]),)
ydeath[miniddeath] [-284  594  682  540  113 1735]
ycase[minidcase] [-16493  13753  31474  41737  12714  88203]
The lag time between infections and deaths using maxima is 66-47=19 days, 182-150=32 days, 332-309=23 days, 464-441=23 days, 574-562=12 days.
The number of every death peak is [1963 1010 3105 627 1915].
The number of every case peak is [ 32699 59662 207017 43332 177464].
The death rate per infection is 1963/32699=0.060,1010/59662=0.017, 3105/207017=0.015,627/43332=0.014,1915/177464=0.011
CFR in the US is slowly decreasing. But, it is still high compared with that of Japan.
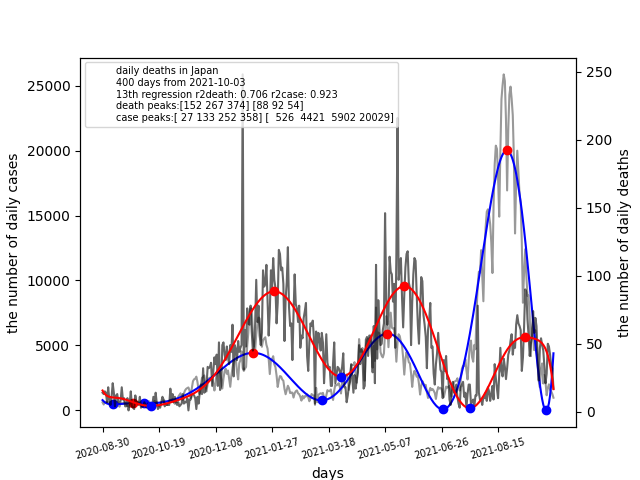
$ covidlag Japan 400 13 L
This example is for "Japan" with the "13th" degree polynomial curve-fitting using "400" sampled days. The result shows the polynomial curve-fitting that r-squared of infections is 0.923 and r-squared of deaths is 0.706.
The death peaks are [152 267 374].
death peak: 2021-01-29 <-
death peak: 2021-05-24 <-
death peak: 2021-09-08 <-

The case peaks are [27 133 252 258].
case peak: 2020-09-26
case peak: 2021-01-10 <-
case peak: 2021-05-09 <-
case peak: 2021-08-23 <-

The lag time between infections and deaths is 152-133=19 days, 267-252=15 days,
and 374-258=16 days respectively.
The number of every death peak is [88 92 54].
The number of every case peak is [526 4421 5902 20029]
Therefore, death rate of peaks or CFR is 88/4421=0.019, 92/5902=0.015, and 54/20029=0.0026 respectively.
The CFR is significantly decreasing.
$ covidlag Canada 400 13 L
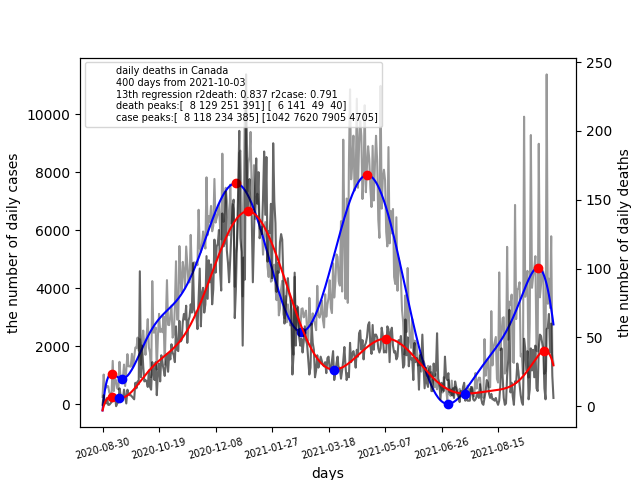
death peak: 2020-09-07
death peak: 2021-01-06
death peak: 2021-05-08
death peak: 2021-09-25
case peak: 2020-09-07
case peak: 2020-12-26
case peak: 2021-04-21
case peak: 2021-09-19
The lag time is 11 days, 17 days,...
The death rate per infection is 0.018,0.006,...


Download files
Download the file for your platform. If you're not sure which to choose, learn more about installing packages.
Source Distribution
Built Distribution
Filter files by name, interpreter, ABI, and platform.
If you're not sure about the file name format, learn more about wheel file names.
Copy a direct link to the current filters
File details
Details for the file covidlag-0.0.8.tar.gz.
File metadata
- Download URL: covidlag-0.0.8.tar.gz
- Upload date:
- Size: 5.2 kB
- Tags: Source
- Uploaded using Trusted Publishing? No
- Uploaded via: twine/5.0.0 CPython/3.8.12
File hashes
| Algorithm | Hash digest | |
|---|---|---|
| SHA256 |
1c7f80023ac0cc44069604fa447c05b94bd9daf5aae938a9478b1f5c13e17081
|
|
| MD5 |
575c47716f22aca377729c71fa69da92
|
|
| BLAKE2b-256 |
3a1df02756cd2c0937325d1ee9b39af592e82aef0f78e866487365b7672be1ab
|
File details
Details for the file covidlag-0.0.8-py3-none-any.whl.
File metadata
- Download URL: covidlag-0.0.8-py3-none-any.whl
- Upload date:
- Size: 5.3 kB
- Tags: Python 3
- Uploaded using Trusted Publishing? No
- Uploaded via: twine/5.0.0 CPython/3.8.12
File hashes
| Algorithm | Hash digest | |
|---|---|---|
| SHA256 |
8bfb18c46c2f233dc759505a34b1649ad45eaee942c481ed26fcc9900811b558
|
|
| MD5 |
d990b0049add9c657efba24228816763
|
|
| BLAKE2b-256 |
65bf61d88e8a84cc9574ba75218018eddb50daf5d8fe797b9fa366604b042570
|


