light curves from UVIT data
Project description
Curvit
Create light curves from UVIT data.
Update: curvit documention is at https://curvit.readthedocs.io
The information below is not updated and kept for introducing the software; always refer to the documentation website.
Curvit is an open-source python package to produce light curves from UVIT (Ultraviolet Imaging Telescope) data. The events list from the official UVIT L2 pipeline (version 6.3 onwards) is required as an input to the package. If you have data from old official pipeline versions or other pipelines, please contact me, and we can try to figure out a solution!
The software paper manuscript is accessible at https://arxiv.org/abs/2101.06377
Installation
Curvit is on the Python Package Index (PyPI) and you can install the package using pip as follows:
pip install curvit --user
Requirements
Curvit has the following requirements. If you have an older version of Python and is new to the language, I recommend that you install the Anaconda Distribution. It installs Python in a user directory without requiring root permissions and will work on Linux, MacOS, and Windows.
- Python 3.6 or later
- Astropy
- Matplotlib
- Numpy
- Photutils
- Scipy
Getting started
Curvit's capabilities can be best demonstrated by examples. First, we need to get events list to be provided as input (an events list is a FITS file containing events). Go to ISSDC's AstroBrowse website and download UVIT data of your interest. Here, for example, the publicly available Level2 data of FO Aqr was chosen (Observation ID: G06_084T01_9000000710).
This dataset, LEVL2AS1UVT20161005G06_084T01_9000000710.zip, is a compressed file which needs to be extracted. Once extracted, a directory named 20161005_G06_084T01_9000000710_level2 can be found. This directory has the following structure.
20161005_G06_084T01_9000000710_level2/
└── uvit
    ├── RAS_NUV
    │   ├── pipeline
    │   ├── uvt_01
    │   ├── uvt_02
    │   ├── uvt_03
    │   ├── ...
    │   ├── ...
    │   └── uvt_ci
    ├── RAS_VIS
    │   ├── pipeline
    │   ├── uvt_01
    │   ├── uvt_02
    │   ├── uvt_03
    │   ├── ...
    │   ├── ...
    │   └── uvt_ci
    ├── DISCLAIMER.txt
    ├── LEVL1AS1UVT20161005G06_084T01_9000000710_05546_V2.2_dqr.xml
    └── README.txt
Please read the README.txt for details on Level2 data and what it contains. RAS_VIS directory contains images that were corrected for satellite drift by using the VIS (visible) channel. For the images inside RAS_NUV directory, NUV (near-ultraviolet) channel was used. For most cases, the data from RAS_VIS would be suitable. If you download a dataset that is different than the one mentioned above, check the statistics inside DISCLAIMER.txt to decide what to use.
Our directory of interest,RAS_VIS, has the following contents.
RAS_VIS/
├── pipeline
│   └── LEVL2AS1UVT20161005G06_084_L2_DM_params.txt
├── uvt_01
│   ├── F_01
│   │   ├── AS1G06_084T01_9000000710uvtFIIPC00F1A_l2err.fits
│   │   ├── AS1G06_084T01_9000000710uvtFIIPC00F1A_l2exp.fits
│   │   ├── AS1G06_084T01_9000000710uvtFIIPC00F1A_l2img.fits
│   │   ├── AS1G06_084T01_9000000710uvtFIIPC00F1I_l2img.fits
│   │   └── AS1G06_084T01_9000000710uvtFIIPC00F1_l2ce.fits
│   ├── N_01
│   │   ├── AS1G06_084T01_9000000710uvtNIIPC00F2A_l2err.fits
│   │   ├── AS1G06_084T01_9000000710uvtNIIPC00F2A_l2exp.fits
│   │   ├── AS1G06_084T01_9000000710uvtNIIPC00F2A_l2img.fits
│   │   ├── AS1G06_084T01_9000000710uvtNIIPC00F2I_l2img.fits
│   │   └── AS1G06_084T01_9000000710uvtNIIPC00F2_l2ce.fits
│   └── V_01
│       └── AS1G06_084T01_9000000710uvtVIIIM00F2_l2dr.fits
├── ...
├── ...
Inside the directory uvt_01, data are organized in separate folders, each corresponding to overlapping time-ranges in UV and VIS channels, as available in Level1 dataset (F_01: FUV; N_01: NUV; V_01: VIS).
The suffixes of the FITS files have the following meaning.
...A_l2img.fits: Image file in astronomical coordinates....I_l2img.fits: Image file in instrument coordinates....A_l2exp.fits: Exposure map forA_l2img.fits....A_l2err.fits: Error map forA_l2img.fits....l2ce.fits: Corrected events list....l2dr.fits: the Relative Aspects Series (RAS) file.
This structure of subdirectories shall repeat for all sets - uvt_01, uvt_02, uvt_03, etc.
For the examples given below, we will be using FUV events list (...l2ce.fits) from uvt_03 as input to curvit.
IMPORTANT: The Level2 directory structure and FITS file naming conventions here explained are for the Level2 data of 6.3 version obtained from ISSDC. Always refer to the
README.txtincluded along with the Level2 data to understand the data structure.
makecurves
The makecurves function of curvit can automatically detect sources from events list and create light curves. Please note that curvit currently provides source coordinates only in the instrument coordinate system.
>>> import curvit
>>> curvit.makecurves(events_list = 'AS1G06_084T01_9000000710uvtNIIPC00F2_l2ce.fits.gz',
                      threshold = 5)
Detected source coordinates saved in file:
* sources_AS1G06_084T01_9000000710uvtNIIPC00F2_l2ce.coo
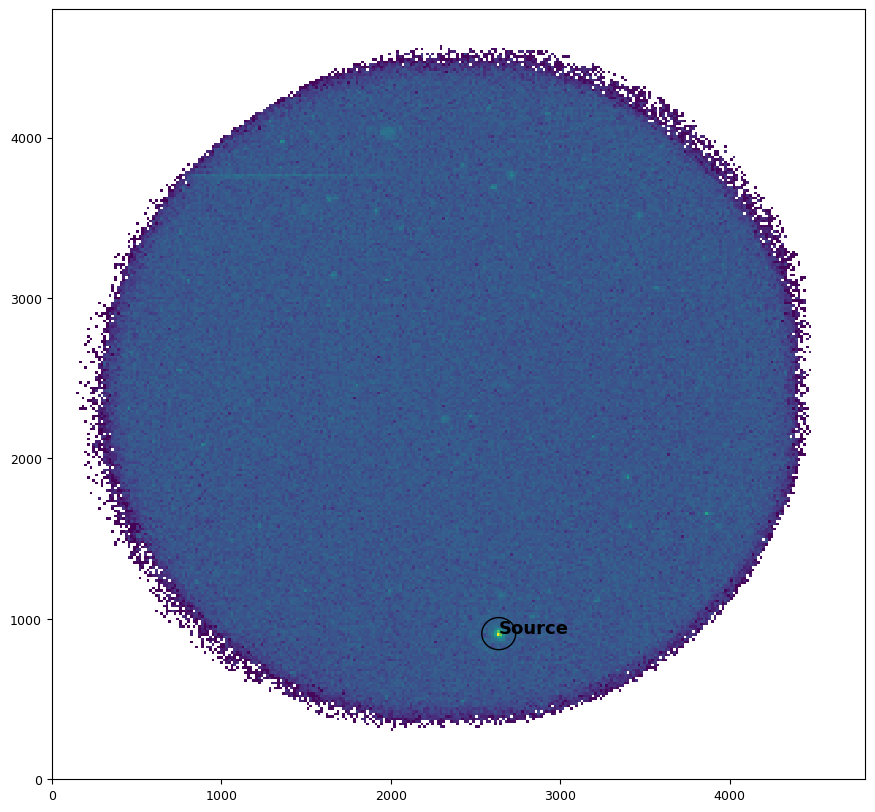
Detected sources are plotted in the image:
* sources_AS1G06_084T01_9000000710uvtNIIPC00F2_l2ce.png

---------------------- light curves ----------------------
* makecurves_3136.64_3651.08_AS1G06_084T01_9000000710uvtNIIPC00F2_l2ce.png
* makecurves_2530.02_1442.18_AS1G06_084T01_9000000710uvtNIIPC00F2_l2ce.png
* makecurves_2912.31_3657.17_AS1G06_084T01_9000000710uvtNIIPC00F2_l2ce.png
...
...

Done!
IMPORTANT: Zero-based indexing scheme is used in curvit. Therefore, if you open the corresponding FITS image file in instrument coordinates (
...I_l2img.fits) in DS9, there will be a difference of 1 between the source coordinates in DS9 and curvit. For example, the curvit coordinates of (2559, 806) will become (2560, 807) in FITS convention.
curve
If you already have the source coordinates, the curve function of curvit can be used to create light curves.
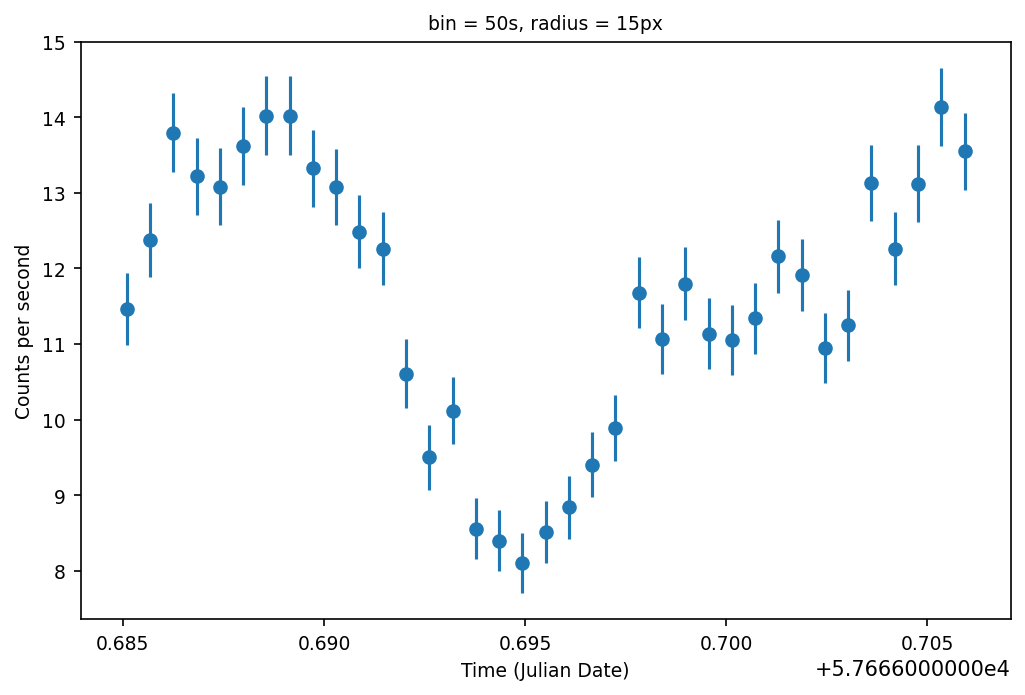
>>> curvit.curve(events_list = 'AS1G06_084T01_9000000710uvtFIIPC00F1_l2ce.fits.gz',
                 xp = 2636.71, yp = 907.91,
                 radius = 15,
                 bwidth = 50,
                 background = 'auto')
The estimated background CPS = 0.00352 +/-0.00069

-------------------------- curve --------------------------
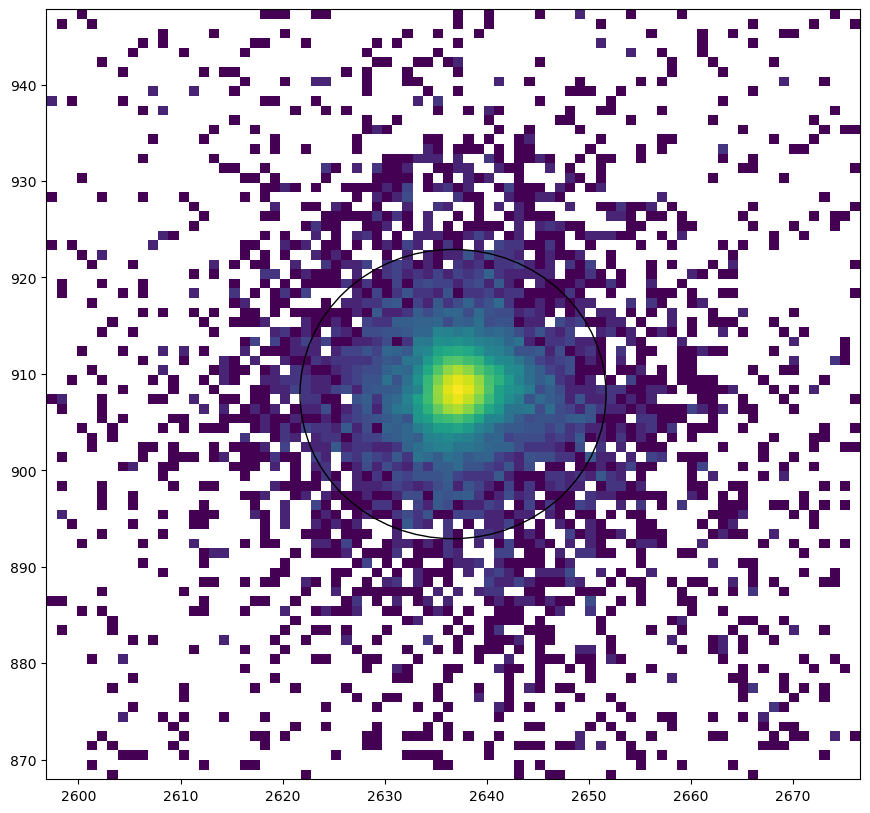
source: source_AS1G06_084T01_9000000710uvtFIIPC00F1_l2ce.png
        source_zoomed_AS1G06_084T01_9000000710uvtFIIPC00F1_l2ce.png
data: curve_2636.71_907.91_AS1G06_084T01_9000000710uvtFIIPC00F1_l2ce.dat
plot: curve_2636.71_907.91_AS1G06_084T01_9000000710uvtFIIPC00F1_l2ce.png

Done!


Parameters
The curvit package has a set of parameters for which the users can set values. Some of them have default values.
Parameters common to both makecurves and curve
-
events_list - The name of the events list (
...l2ce.fits). The string can also include the path to the file. -
radius - The radius of the source aperture in pixels. This parameter has a default value of
6. -
sky_radius - The radius of the background aperture in pixels. The default value is
12. -
bwidth - Time bin width in seconds. Default value is
50. -
framecount_per_sec - Framerate, with a default value of
28.7185frames per second for 512 x 512 window mode. The most accurate way to get the framerate would be to take the value of (1 / INT_TIME).INT_TIMEvalue can be found from the corresponding image header. Approximate values of framerate for different window modes of UVIT are given in the table below.
| window mode | frames per second |
|---|---|
| 512 x 512 | 28.7 |
| 350 x 350 | 61 |
| 300 x 300 | 82 |
| 250 x 250 | 115 |
| 200 x 200 | 180 |
| 150 x 150 | 300 |
| 100 x 100 | 640 |
Note: It is essential to set the correct value of framerate. But most of the UVIT observations are carried out in 512 x 512 window mode.
-
background - Valid inputs are
None,'auto', or'manual'. The parameter affects how the background count-rate estimation is done. The default value isNone, and no background estimation is carried out.'auto'will automatically estimate background count-rate. If you prefer to manually specify a background region, then give'manual'as the value and specify x_bg (background X-coordinate) and y_bg (background Y-coordinate) parameters. -
aperture_correction - Valid inputs are
None,'fuv', or'nuv'. The default value isNone. The parameter value can be changed to either'fuv'or'nuv'to apply aperture corrections to the light curve data. -
saturation_correction - Takes either
TrueorFalse. The default value isFalse. If the parameter is set toTrue, saturation correction is applied to the light curve data.
Parameters only required for makecurves
-
detection_method - Two source detection methods are available:
'daofind'and'kdtree'. The default method is'daofind'. -
threshold - The threshold parameter associated with the
'daofind'method. The default value is4. -
how_many - The limit for the number of sources to be detected using the
'kdtree'method. The default value is4.
Parameters only required for curve
-
xp - X-coordinate of the source.
-
yp - Y-coordinate of the source.
Project details
Release history Release notifications | RSS feed
Download files
Download the file for your platform. If you're not sure which to choose, learn more about installing packages.


