Datapane client library and CLI tool

Project description


Note: Datapane is no longer actively maintained.
We've made the difficult decision to stop driving this project and therefore we will no longer actively respond to issues or pull requests. If you would like to take over maintaining this project independently, please let us know so we can add a link to your forked project here.
The final release, 0.17.0, has been optimized to focus on free local report saving, with unused features and analytics removed, and libraries updated to allow usage for as long as possible.
Thank You.
Overview
Build interactive reports in seconds using Python.
Datapane makes it simple to build interactive reports in seconds using Python.
Import Datapane's Python library into your script or notebook and build reports programmatically by wrapping components such as:
- Pandas DataFrames
- Plots from Python visualization libraries such as Bokeh, Altair, Plotly, and Folium
- Markdown and text
- Files, such as images, PDFs, JSON data, etc.
- Interactive forms which run backend Python functions
Datapane reports are interactive and can also contain pages, tabs, drop downs, and more. Once created, reports can be exported as HTML, shared as standalone files, or embedded into your own application, where your viewers can interact with your data and visualizations.
Gallery
Check out example reports:
Getting Started
Check out our Quickstart to build a report in 3m.
Installing Datapane
The best way to install Datapane is through pip or conda.
pip
$ pip3 install -U datapane
conda
$ conda install -c conda-forge "datapane>=0.17.0"
Datapane also works well in hosted Jupyter environments such as Colab or Binder, where you can install as follows:
!pip3 install --quiet datapane
Examples
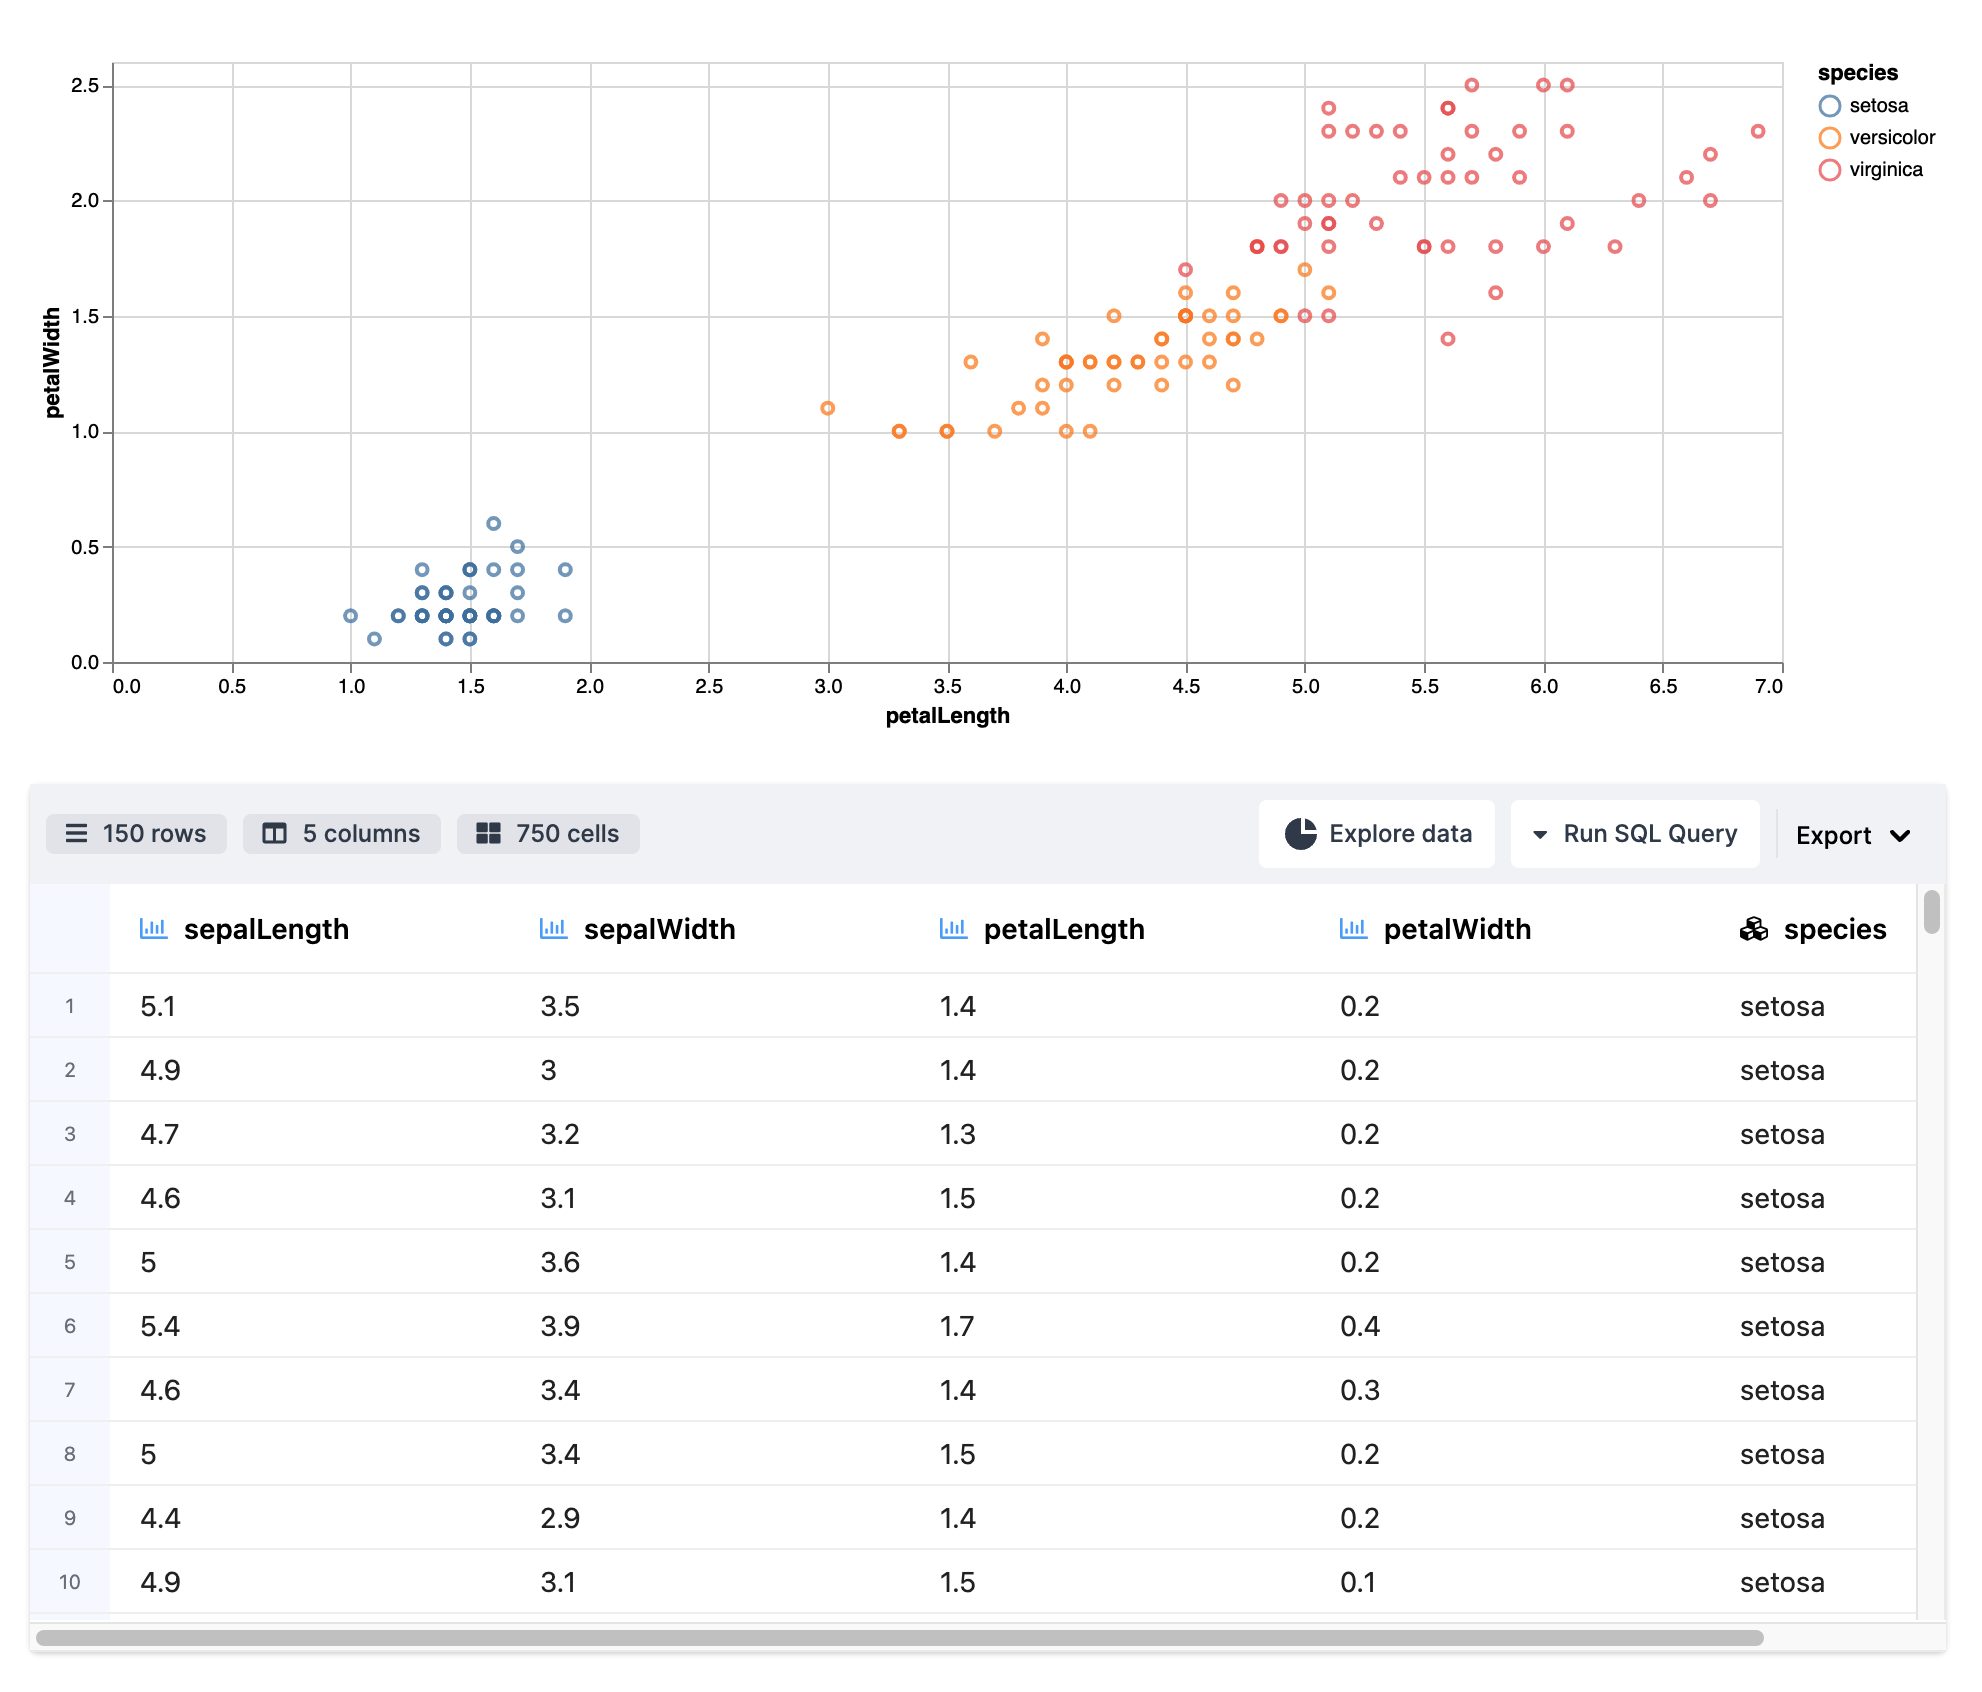
📊 Share plots, data, and more as reports
Create reports from pandas DataFrames, plots from your favorite libraries, and text.
import altair as alt
from vega_datasets import data
import datapane as dp

df = data.iris()
fig = (
    alt.Chart(df)
    .mark_point()
    .encode(
        x="petalLength:Q",
        y="petalWidth:Q",
        color="species:N"
    )
)
view = dp.Blocks(
    dp.Plot(fig),
    dp.DataTable(df)
)
dp.save_report(view, path="my_app.html")
🎛 Layout using interactive blocks
Add dropdowns, selects, grid, pages, and 10+ other interactive blocks.

...

view = dp.Blocks(
    dp.Formula("x^2 + y^2 = z^2"),
    dp.Group(
        dp.BigNumber(
            heading="Number of percentage points",
            value="84%",
            change="2%",
            is_upward_change=True
        ),
        dp.BigNumber(
            heading="Simple Statistic", value=100
        ), columns=2
    ),
    dp.Select(
        dp.Plot(fig, label="Chart"),
        dp.DataTable(df, label="Data")
    ),
)
dp.save_report(view, path="layout_example.html")
Next Steps
- Quickstart - build a report in 3m
- View Examples
- Read the documentation
Release history Release notifications | RSS feed


Download files
Download the file for your platform. If you're not sure which to choose, learn more about installing packages.
Source Distribution
Built Distribution
Filter files by name, interpreter, ABI, and platform.
If you're not sure about the file name format, learn more about wheel file names.
Copy a direct link to the current filters
File details
Details for the file datapane-0.17.0.tar.gz.
File metadata
- Download URL: datapane-0.17.0.tar.gz
- Upload date:
- Size: 117.1 kB
- Tags: Source
- Uploaded using Trusted Publishing? No
- Uploaded via: poetry/1.4.2 CPython/3.10.13 Linux/5.15.0-1041-azure
File hashes
| Algorithm | Hash digest | |
|---|---|---|
| SHA256 |
6b44cc18df4b4bfd2f39d9220aafcfad7aed82e330d2af44817847e8bbaf41c5
|
|
| MD5 |
994aec9c716e507a48ec8a7816c3c349
|
|
| BLAKE2b-256 |
3c9b0a0ca6add40fe174f0b22dca4736f5d241d9e839b613cb258b80d5861bd9
|
File details
Details for the file datapane-0.17.0-py3-none-any.whl.
File metadata
- Download URL: datapane-0.17.0-py3-none-any.whl
- Upload date:
- Size: 143.6 kB
- Tags: Python 3
- Uploaded using Trusted Publishing? No
- Uploaded via: poetry/1.4.2 CPython/3.10.13 Linux/5.15.0-1041-azure
File hashes
| Algorithm | Hash digest | |
|---|---|---|
| SHA256 |
1574cb3be8270eb0c563080fefe64dca92948f44700a8169673afbd565272e71
|
|
| MD5 |
0111a8611c66670943598f2ec2ca00f8
|
|
| BLAKE2b-256 |
a76deec9aaf4dd52751dddb2f155ba0fb8d530065a0ba067a89f38ee4cb34bb0
|


