
datavision
Python data visualisation
setup
pip install datavisionqunti and zus lists
Qunti (群体, groups) are lists that act
as dictionaries that can contain duplicate keys and
as sets for the purposes of enabling set-like operations for qunti objects, such as symmetric difference, intersection and update operations.
Qunti are composed of multiple zu (组, group) objects.
qunti operations
In an update operation, one qunti is used to update another. Any zus in the updating qunti that are not in the updated qunti are appended to the updated qunti. Any zus that are in the updating qunti and the updated qunti replace the corresponding zus in the updated qunti.
The following example illustrates a qunti update operation in which an alpha zus is replaced and a delta zus is appended:
# example qunti update:
a = [['alpha', '10'], ['beta', '20'], ['gamma', '30'], ['gamma', '15']]
b = [['delta', '40'], ['alpha', '50']]
# update of a with b:
a = [['beta', '20'], ['gamma', '30'], ['gamma', '15'], ['delta', '40'], ['alpha', '50']]
The following example illustrates qunti symmetric difference, intersection and update operations. In the update operation, two old gamma zus are replaced by a single new gamma zu:
# example qunti symmetric difference, intersection and update:
a = [['alpha', '10'], ['beta', '20'], ['gamma', '30'], ['gamma', '15']]
b = [['delta', '40'], ['alpha', '50'], ['gamma', '25']]
# symmetric difference of a and b:
[['beta', '20'], ['delta', '40']]
# intersection of a and b:
[['alpha', '10'], ['gamma', '30'], ['gamma', '15'], ['alpha', '50'], ['gamma', '25']]
# update of a with b:
a = [['beta', '20'], ['delta', '40'], ['alpha', '50'], ['gamma', '25']]
data visualisation
Datavision provides utilities for data visualisation.
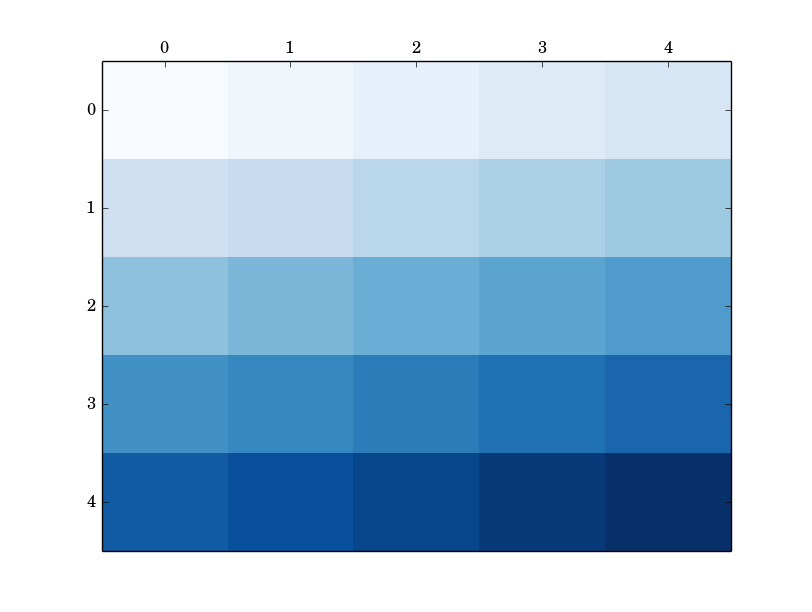
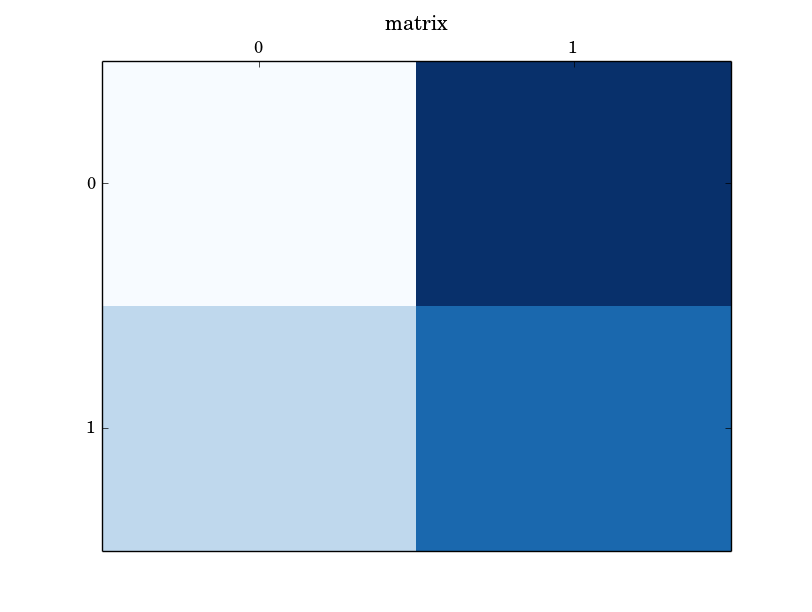
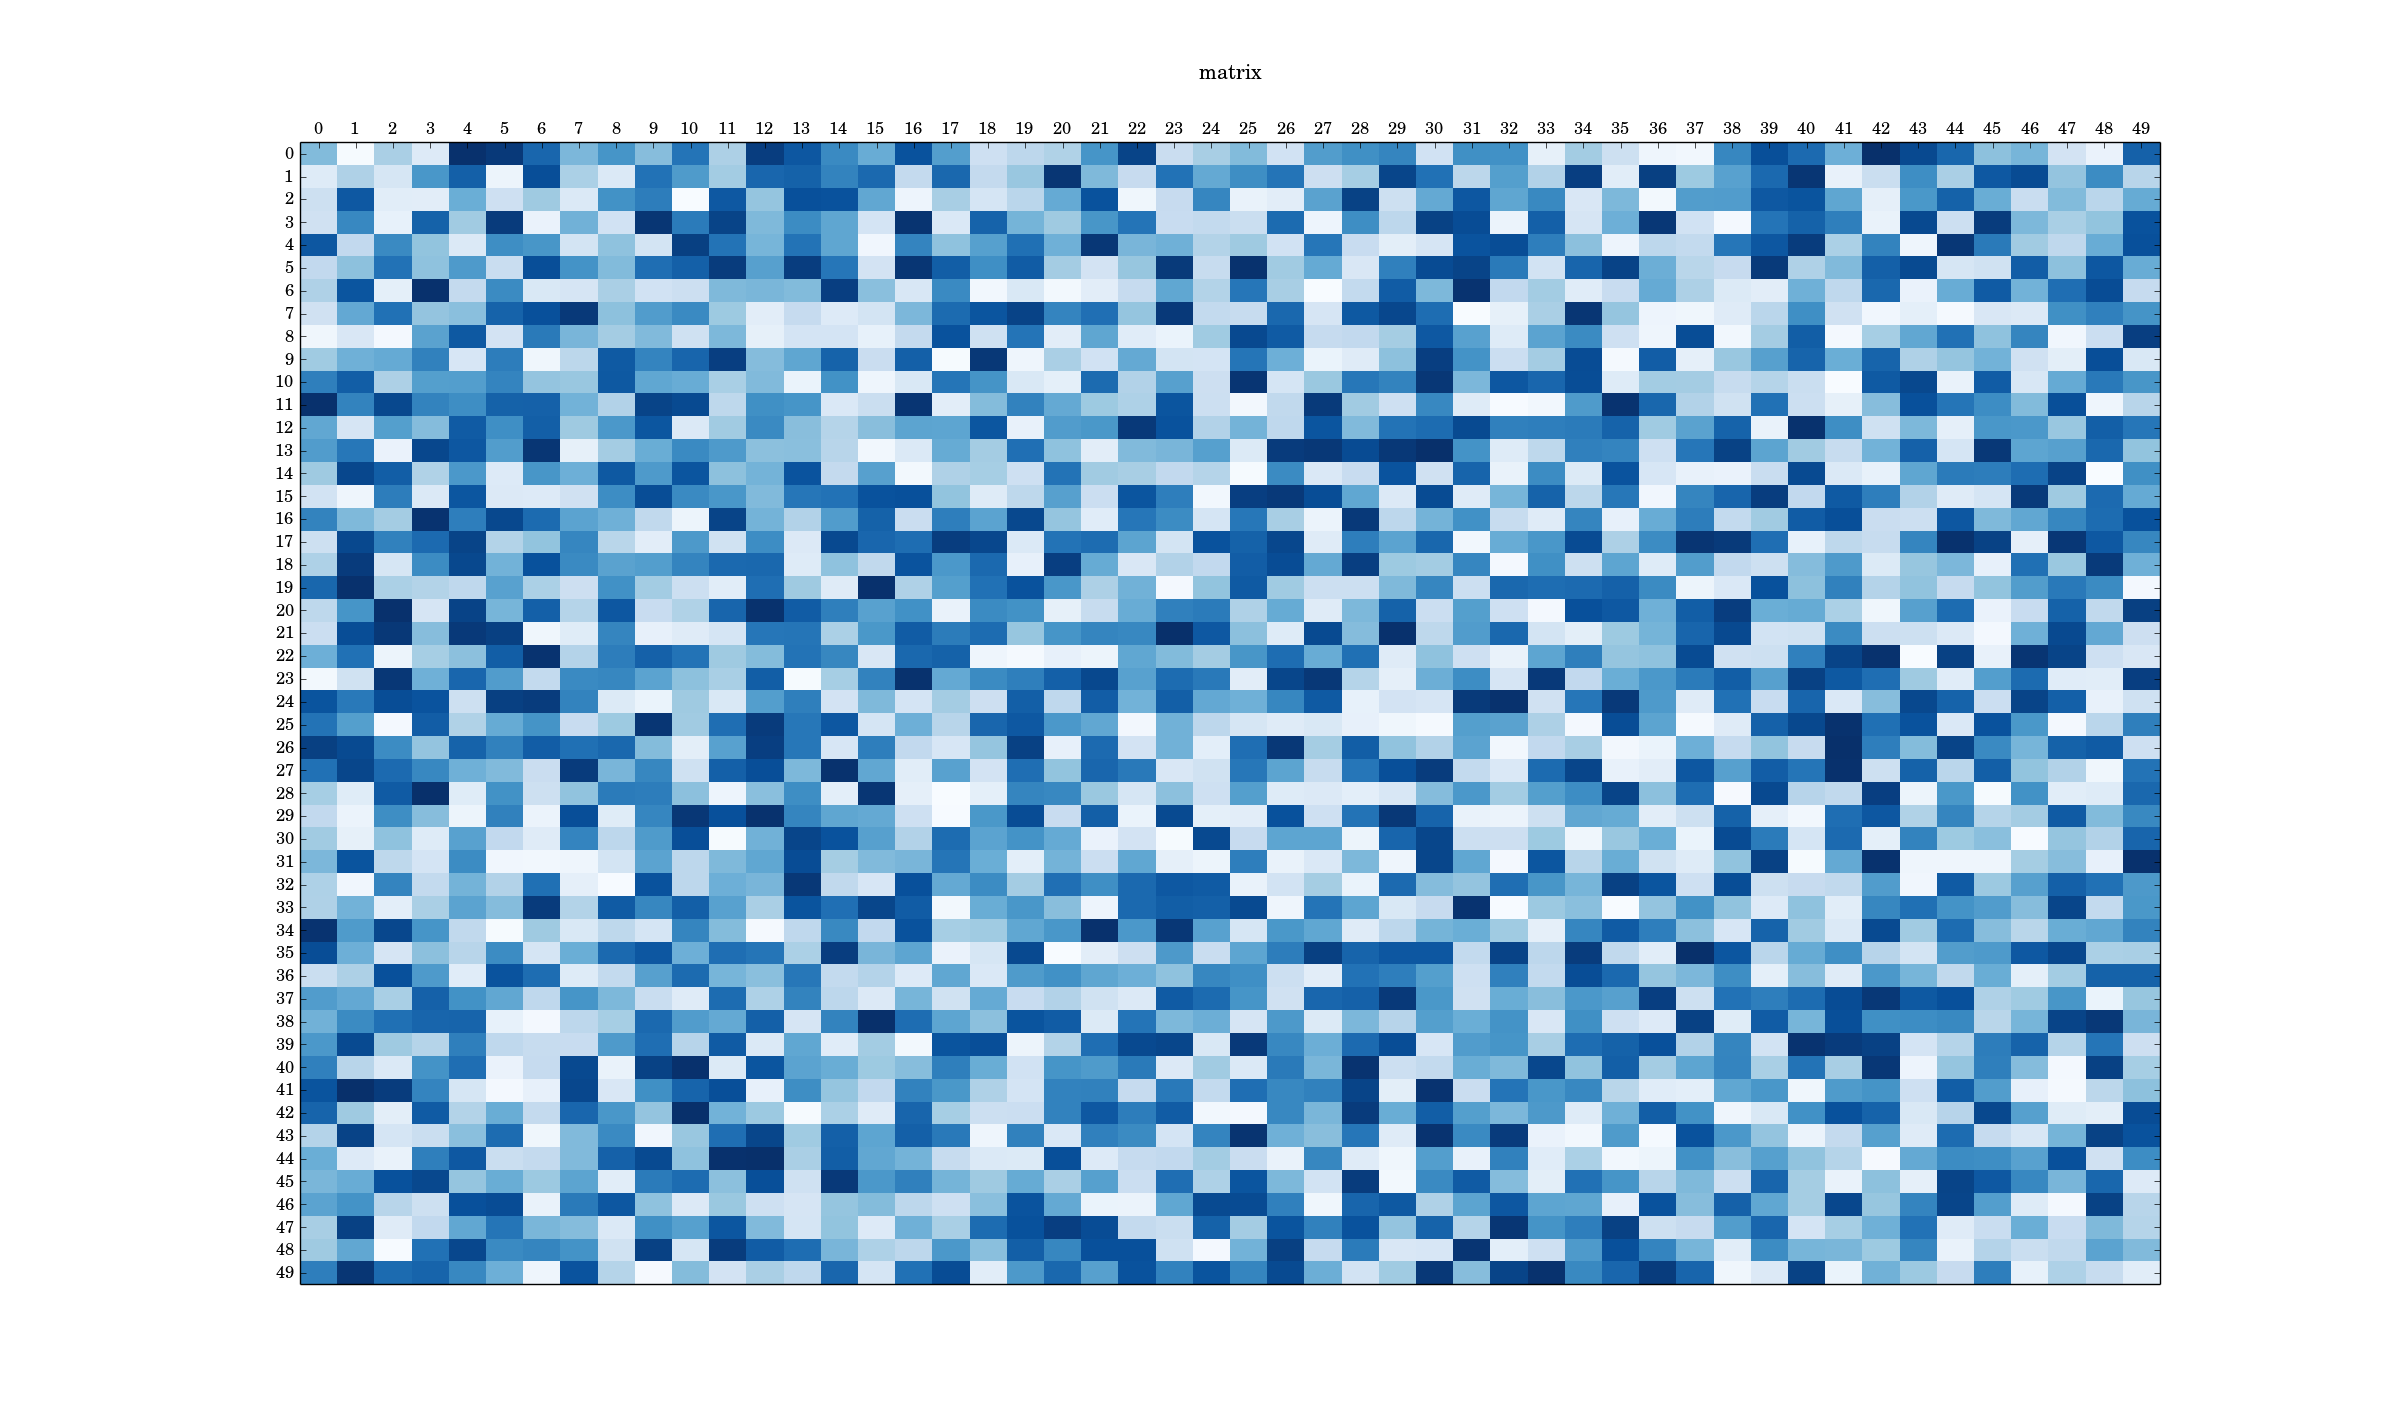
matrices as colormaps
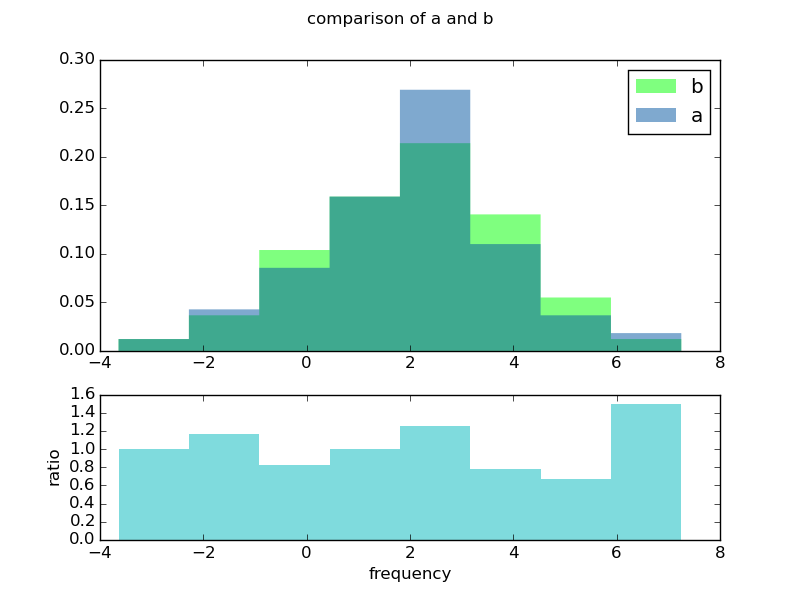
histograms
terminal graphs and histograms
   │
   ┼+79.548                                                                 ○
   │
   │                                                                ○
   │
   │                                                        ○
   │
   │                                                ○
   ◽       ◽       ◽                       ○
   │                       ◽       ○
   │                       ○       ◽
───○┼──────○───────○───────────────────────◽────────────────────────────────┼───
   │ +0.046                                         ◽               +8.97638
   │
   │                                                        ◽
   │
   │                                                                ◽
   ┼-48.228
   │                                                                        ◽
   │
                         │
                         ┼+75503.2
                       ∘∘|∘
                      ∘||||∘
                      ||||||∘
                     ∘|||||||
                     ||||||||∘
                    ∘|||||||||
                    ||||||||||∘
                   ∘|||||||||||
                   |||||||||||∘
                  ∘||||||||||||
                  |||||||||||||∘
                  ||||||||||||||∘
                 ∘|||||||||||||||∘
                ∘|||||||||||||||||∘
               ∘|||||||||||||||||||∘
            ∘∘∘||||||||||┼+1603.2|||∘∘∘
──┼--------------------------------------------┼──
   -4.69099              │              +4.6147
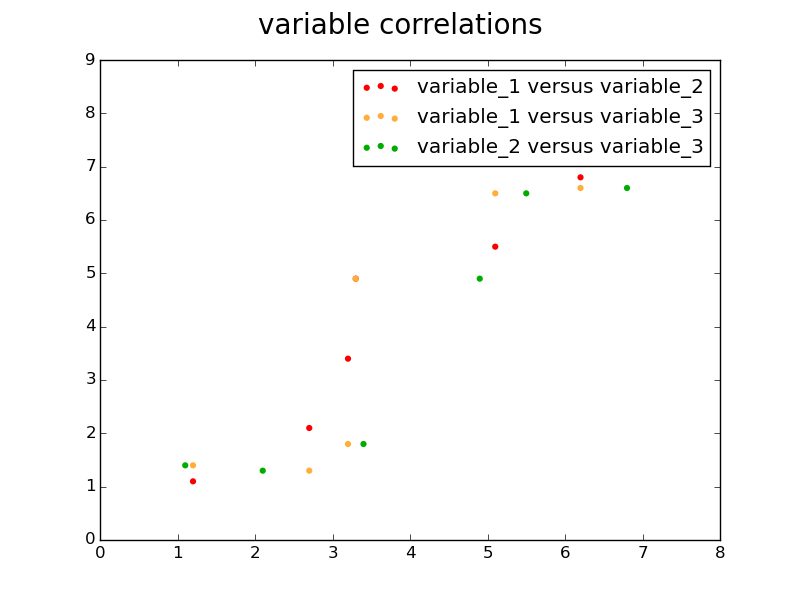
echo "0, 1, 4, 9, 16, 25, 36, 49, 64, 81" | datavision_TTY_plot.pycombinations of variables
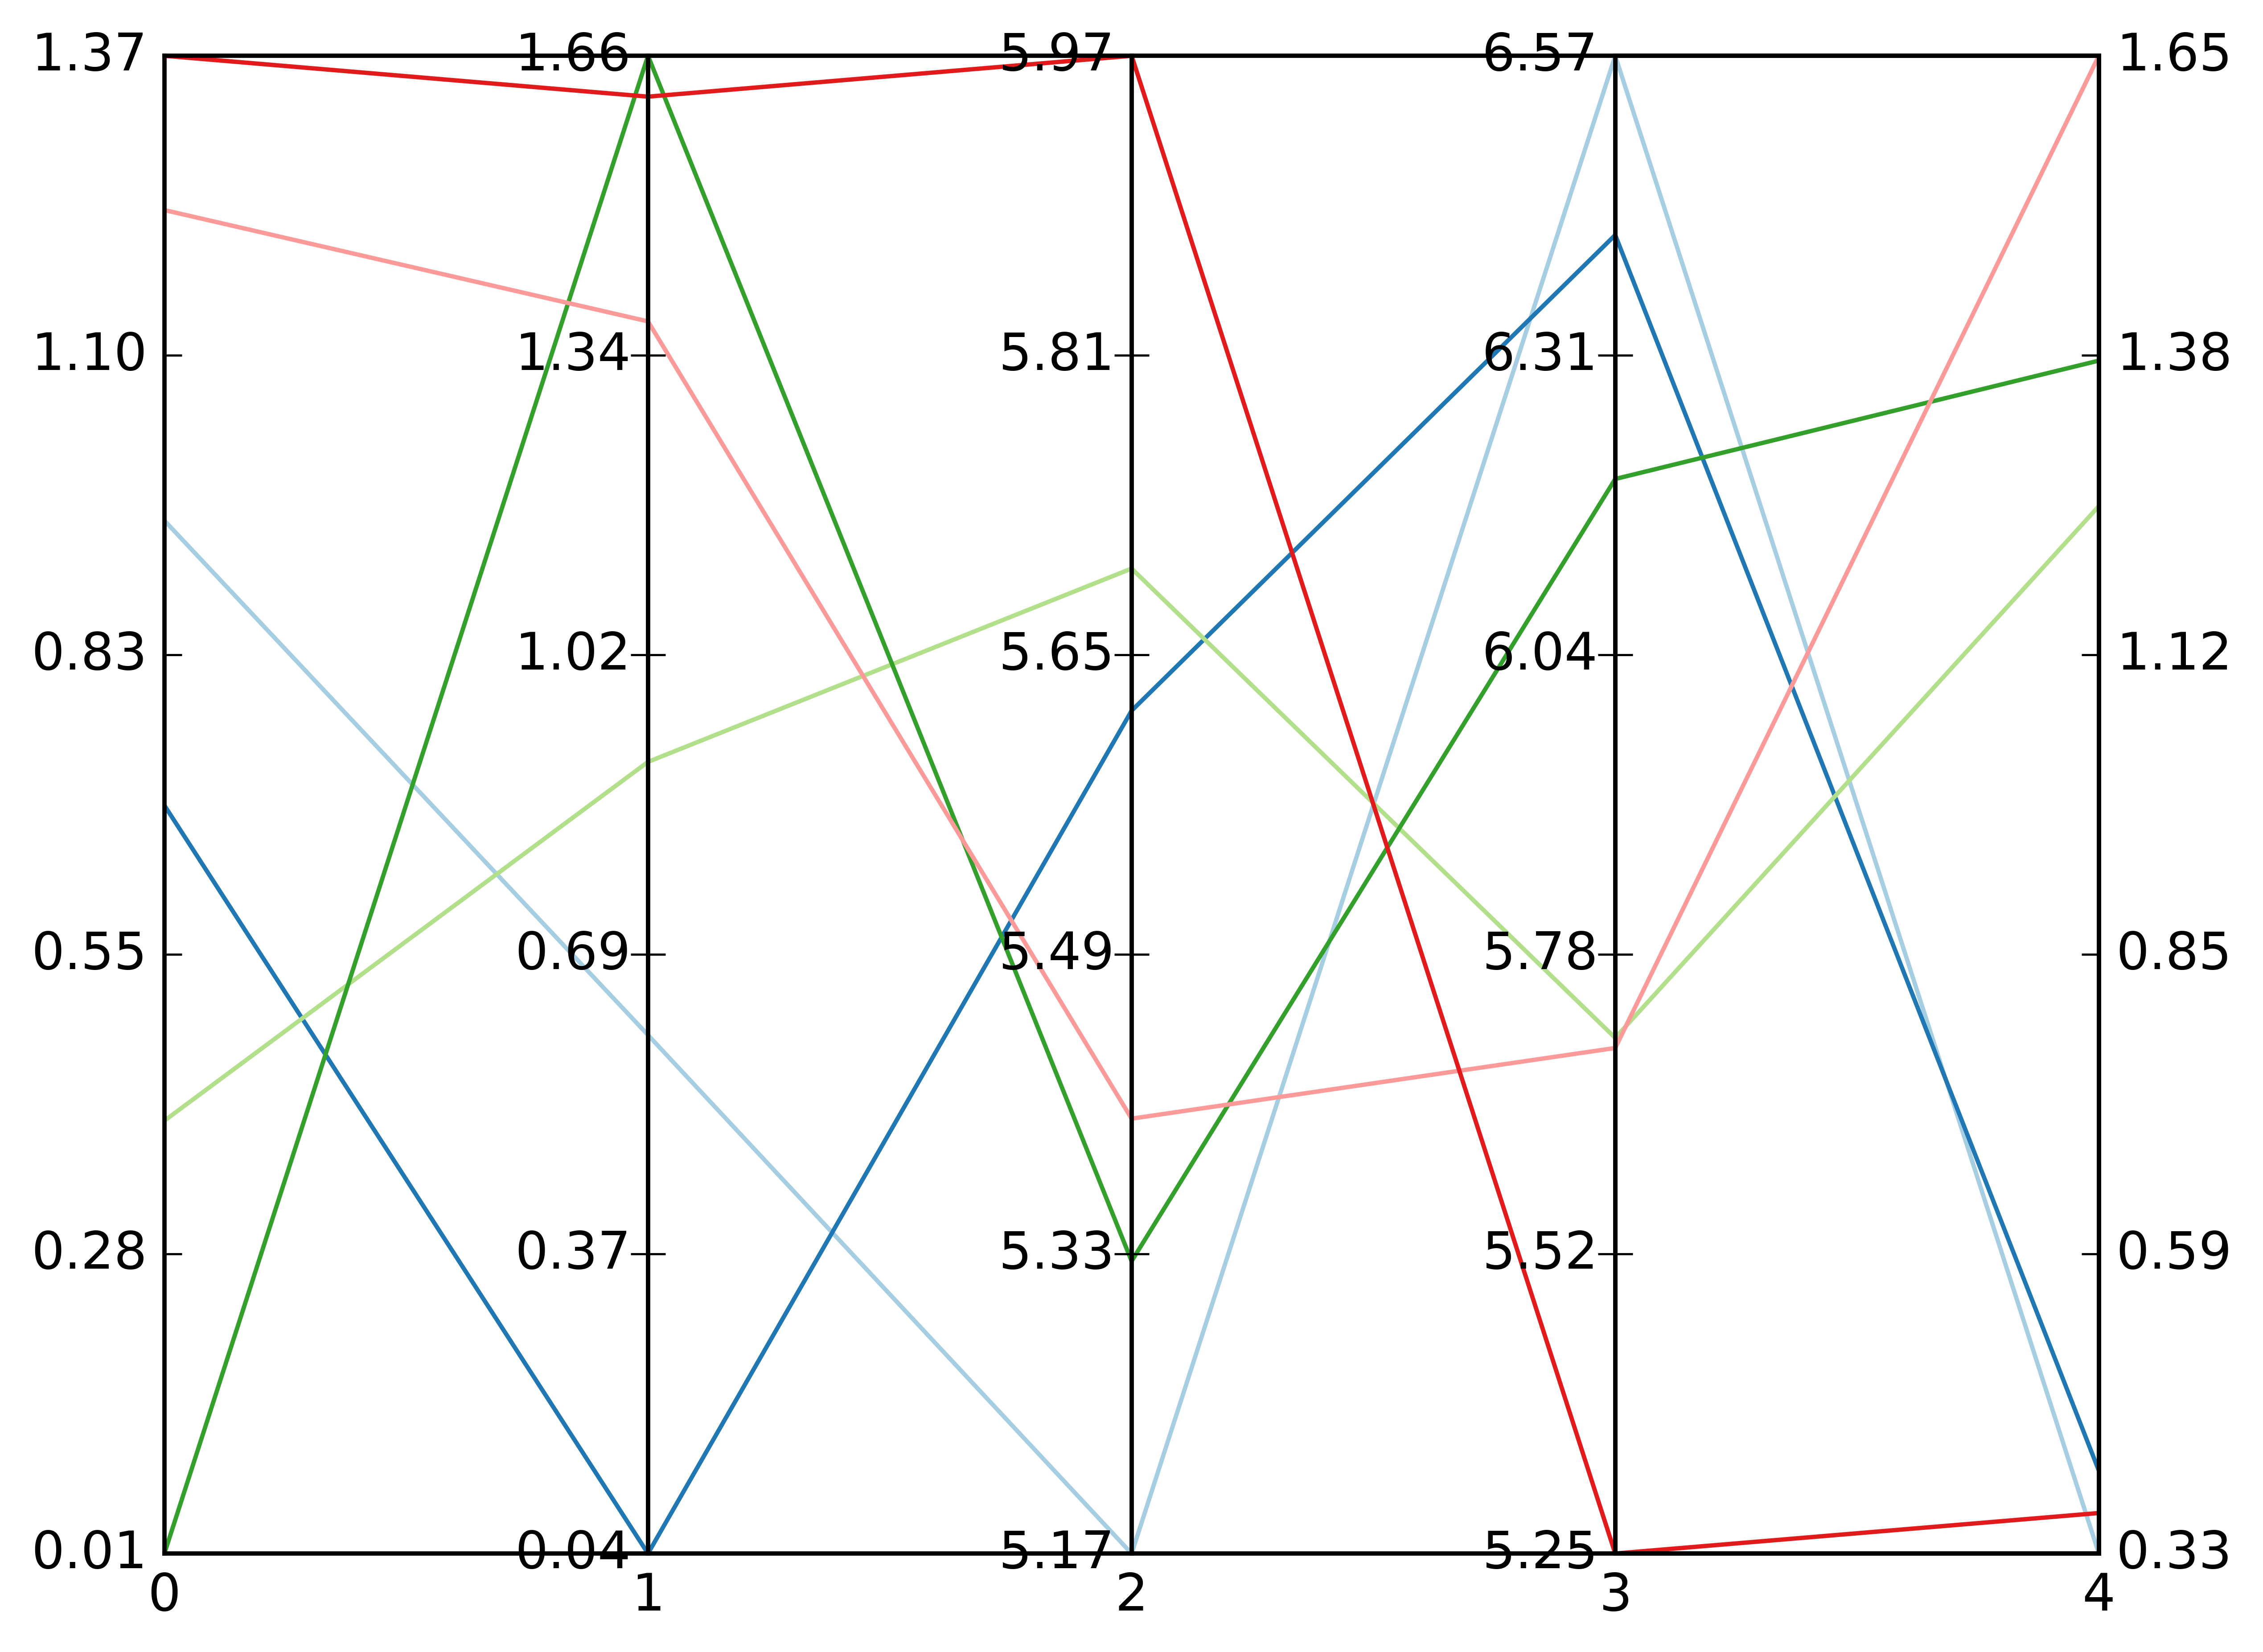
parallel coordinates
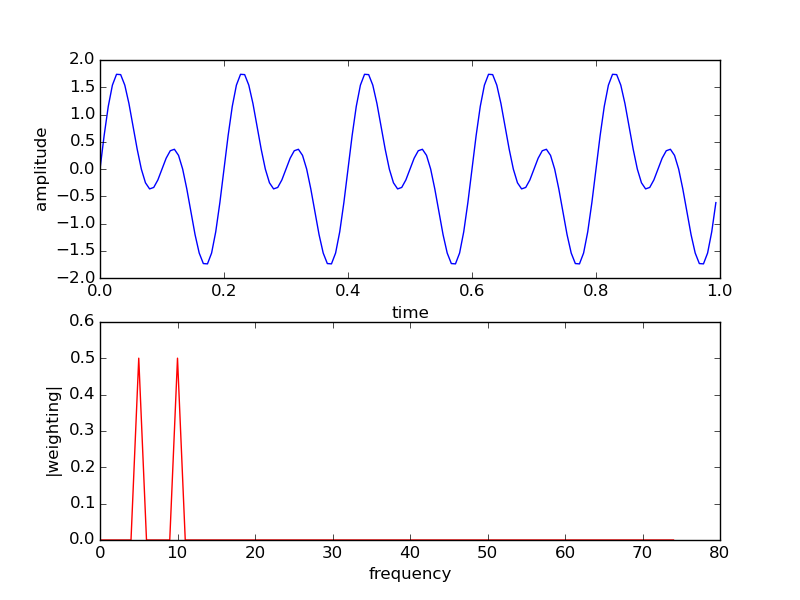
FFT
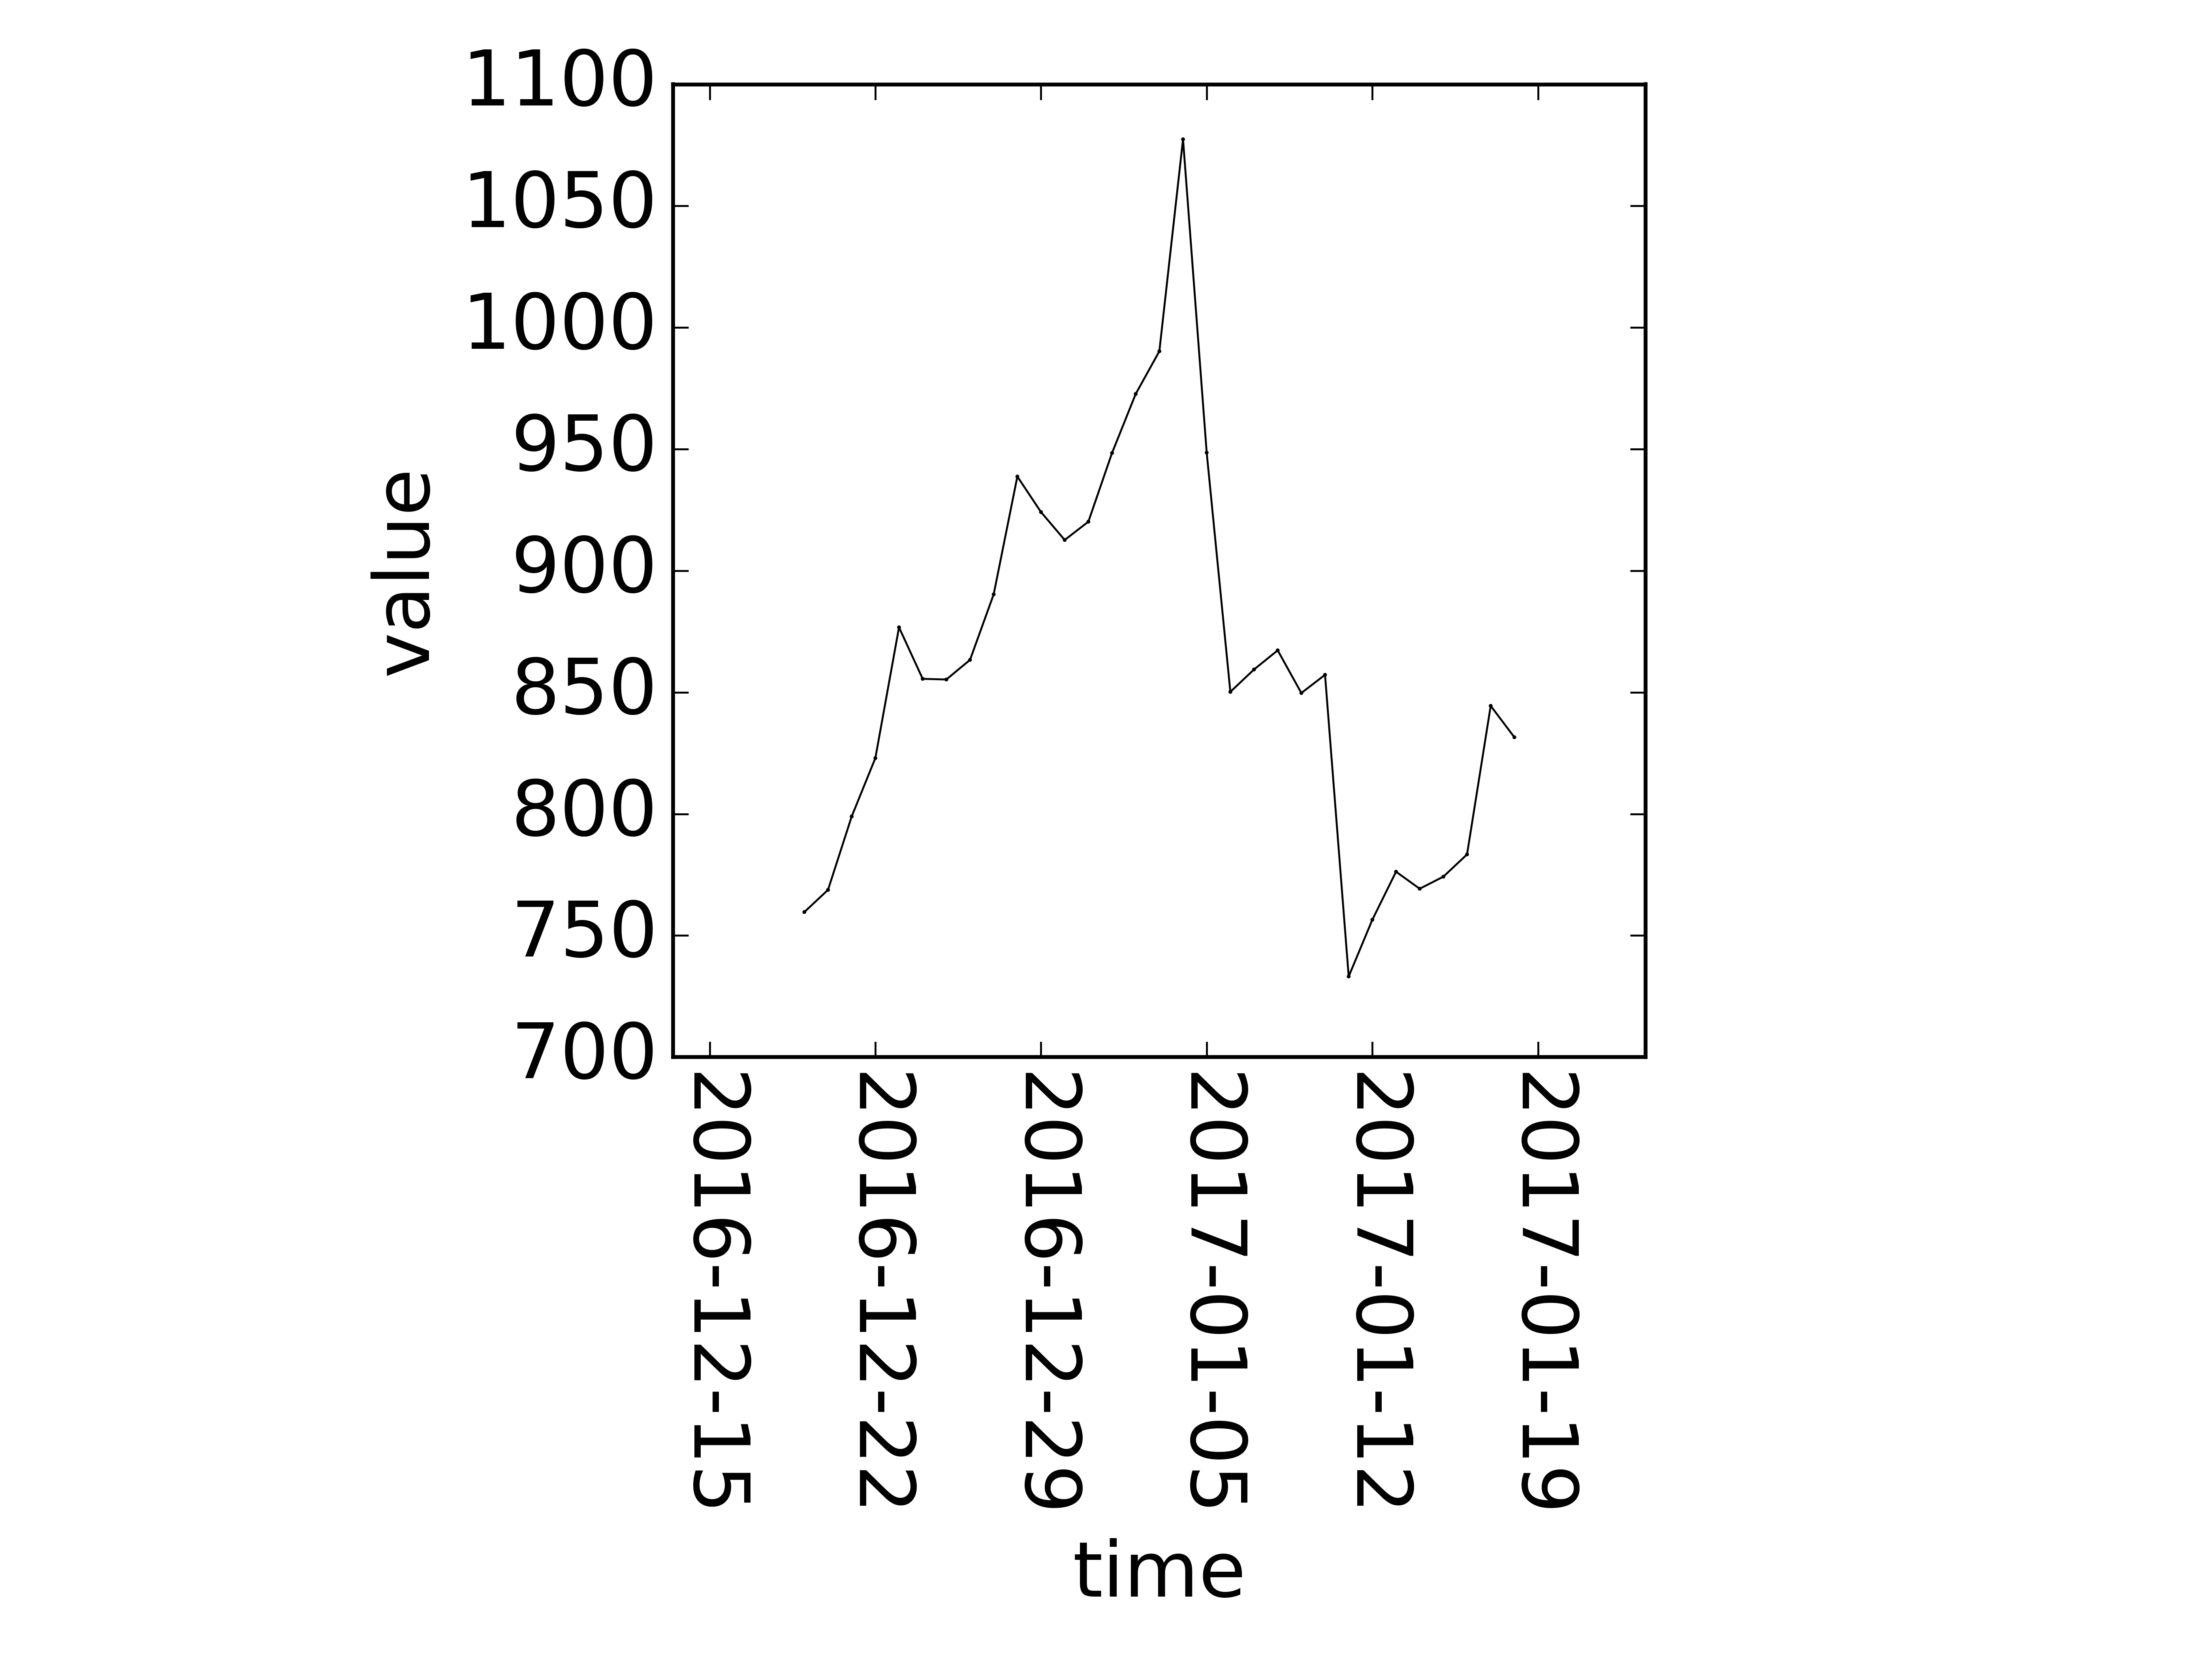
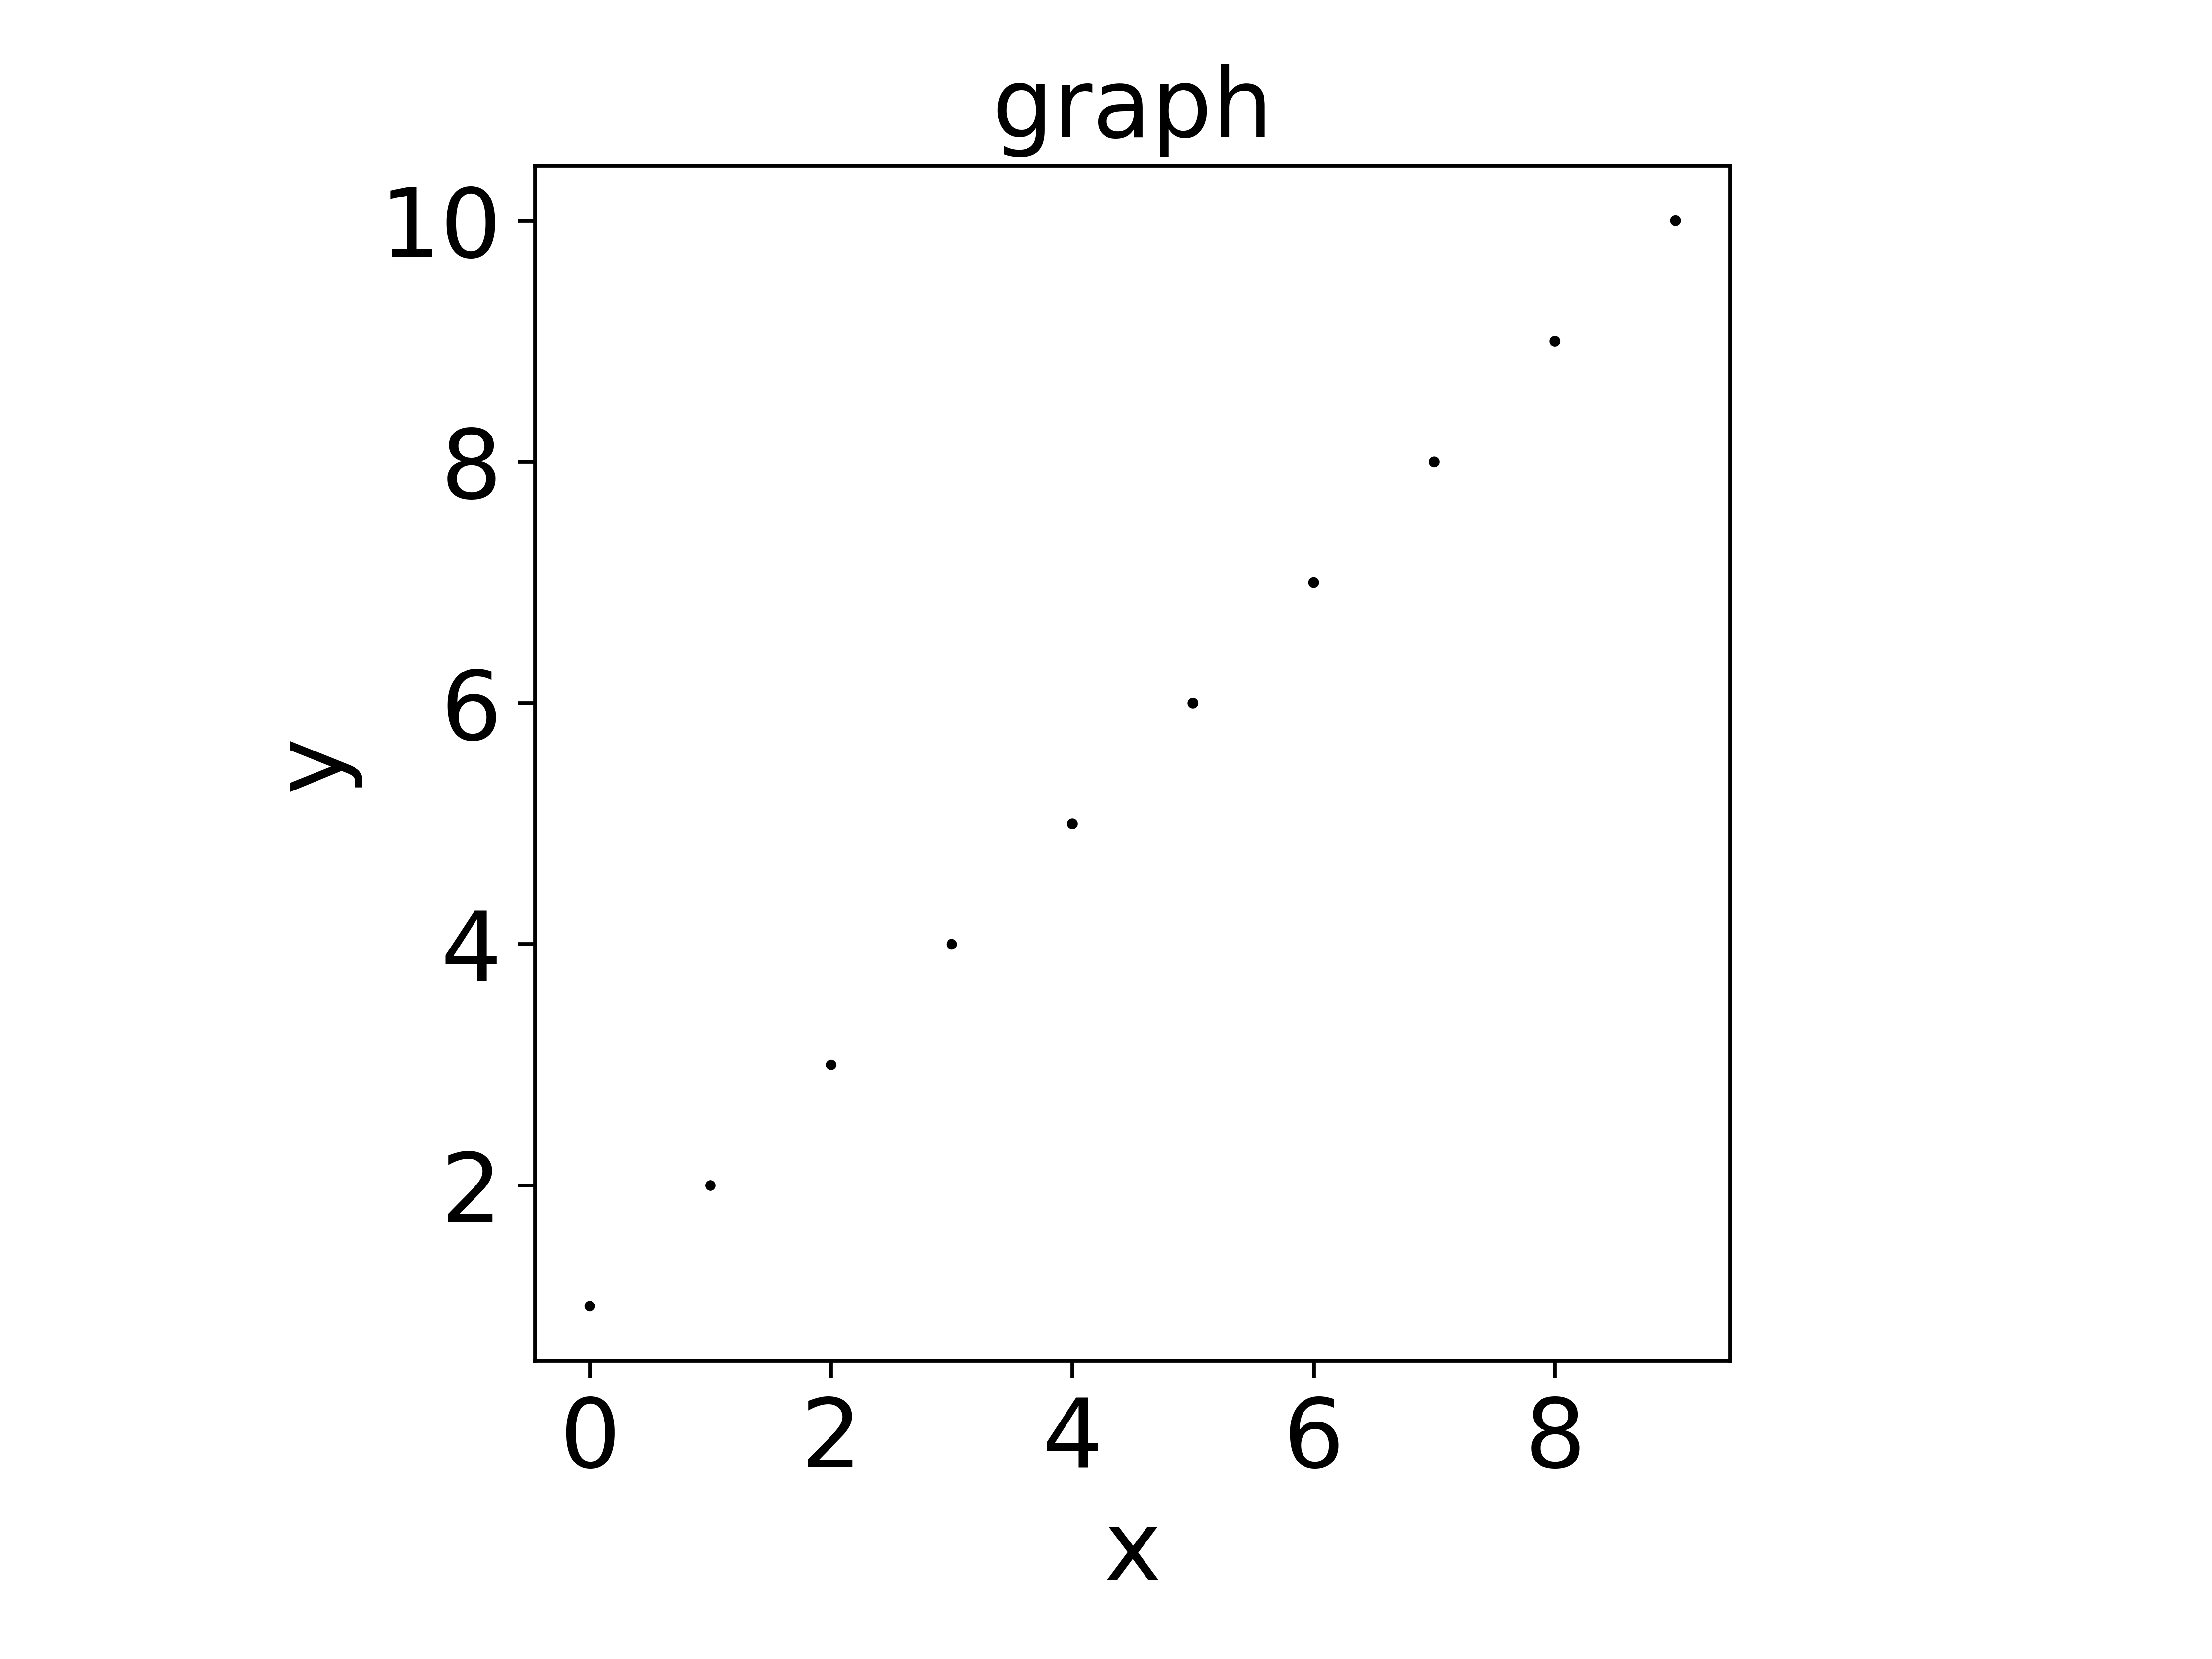
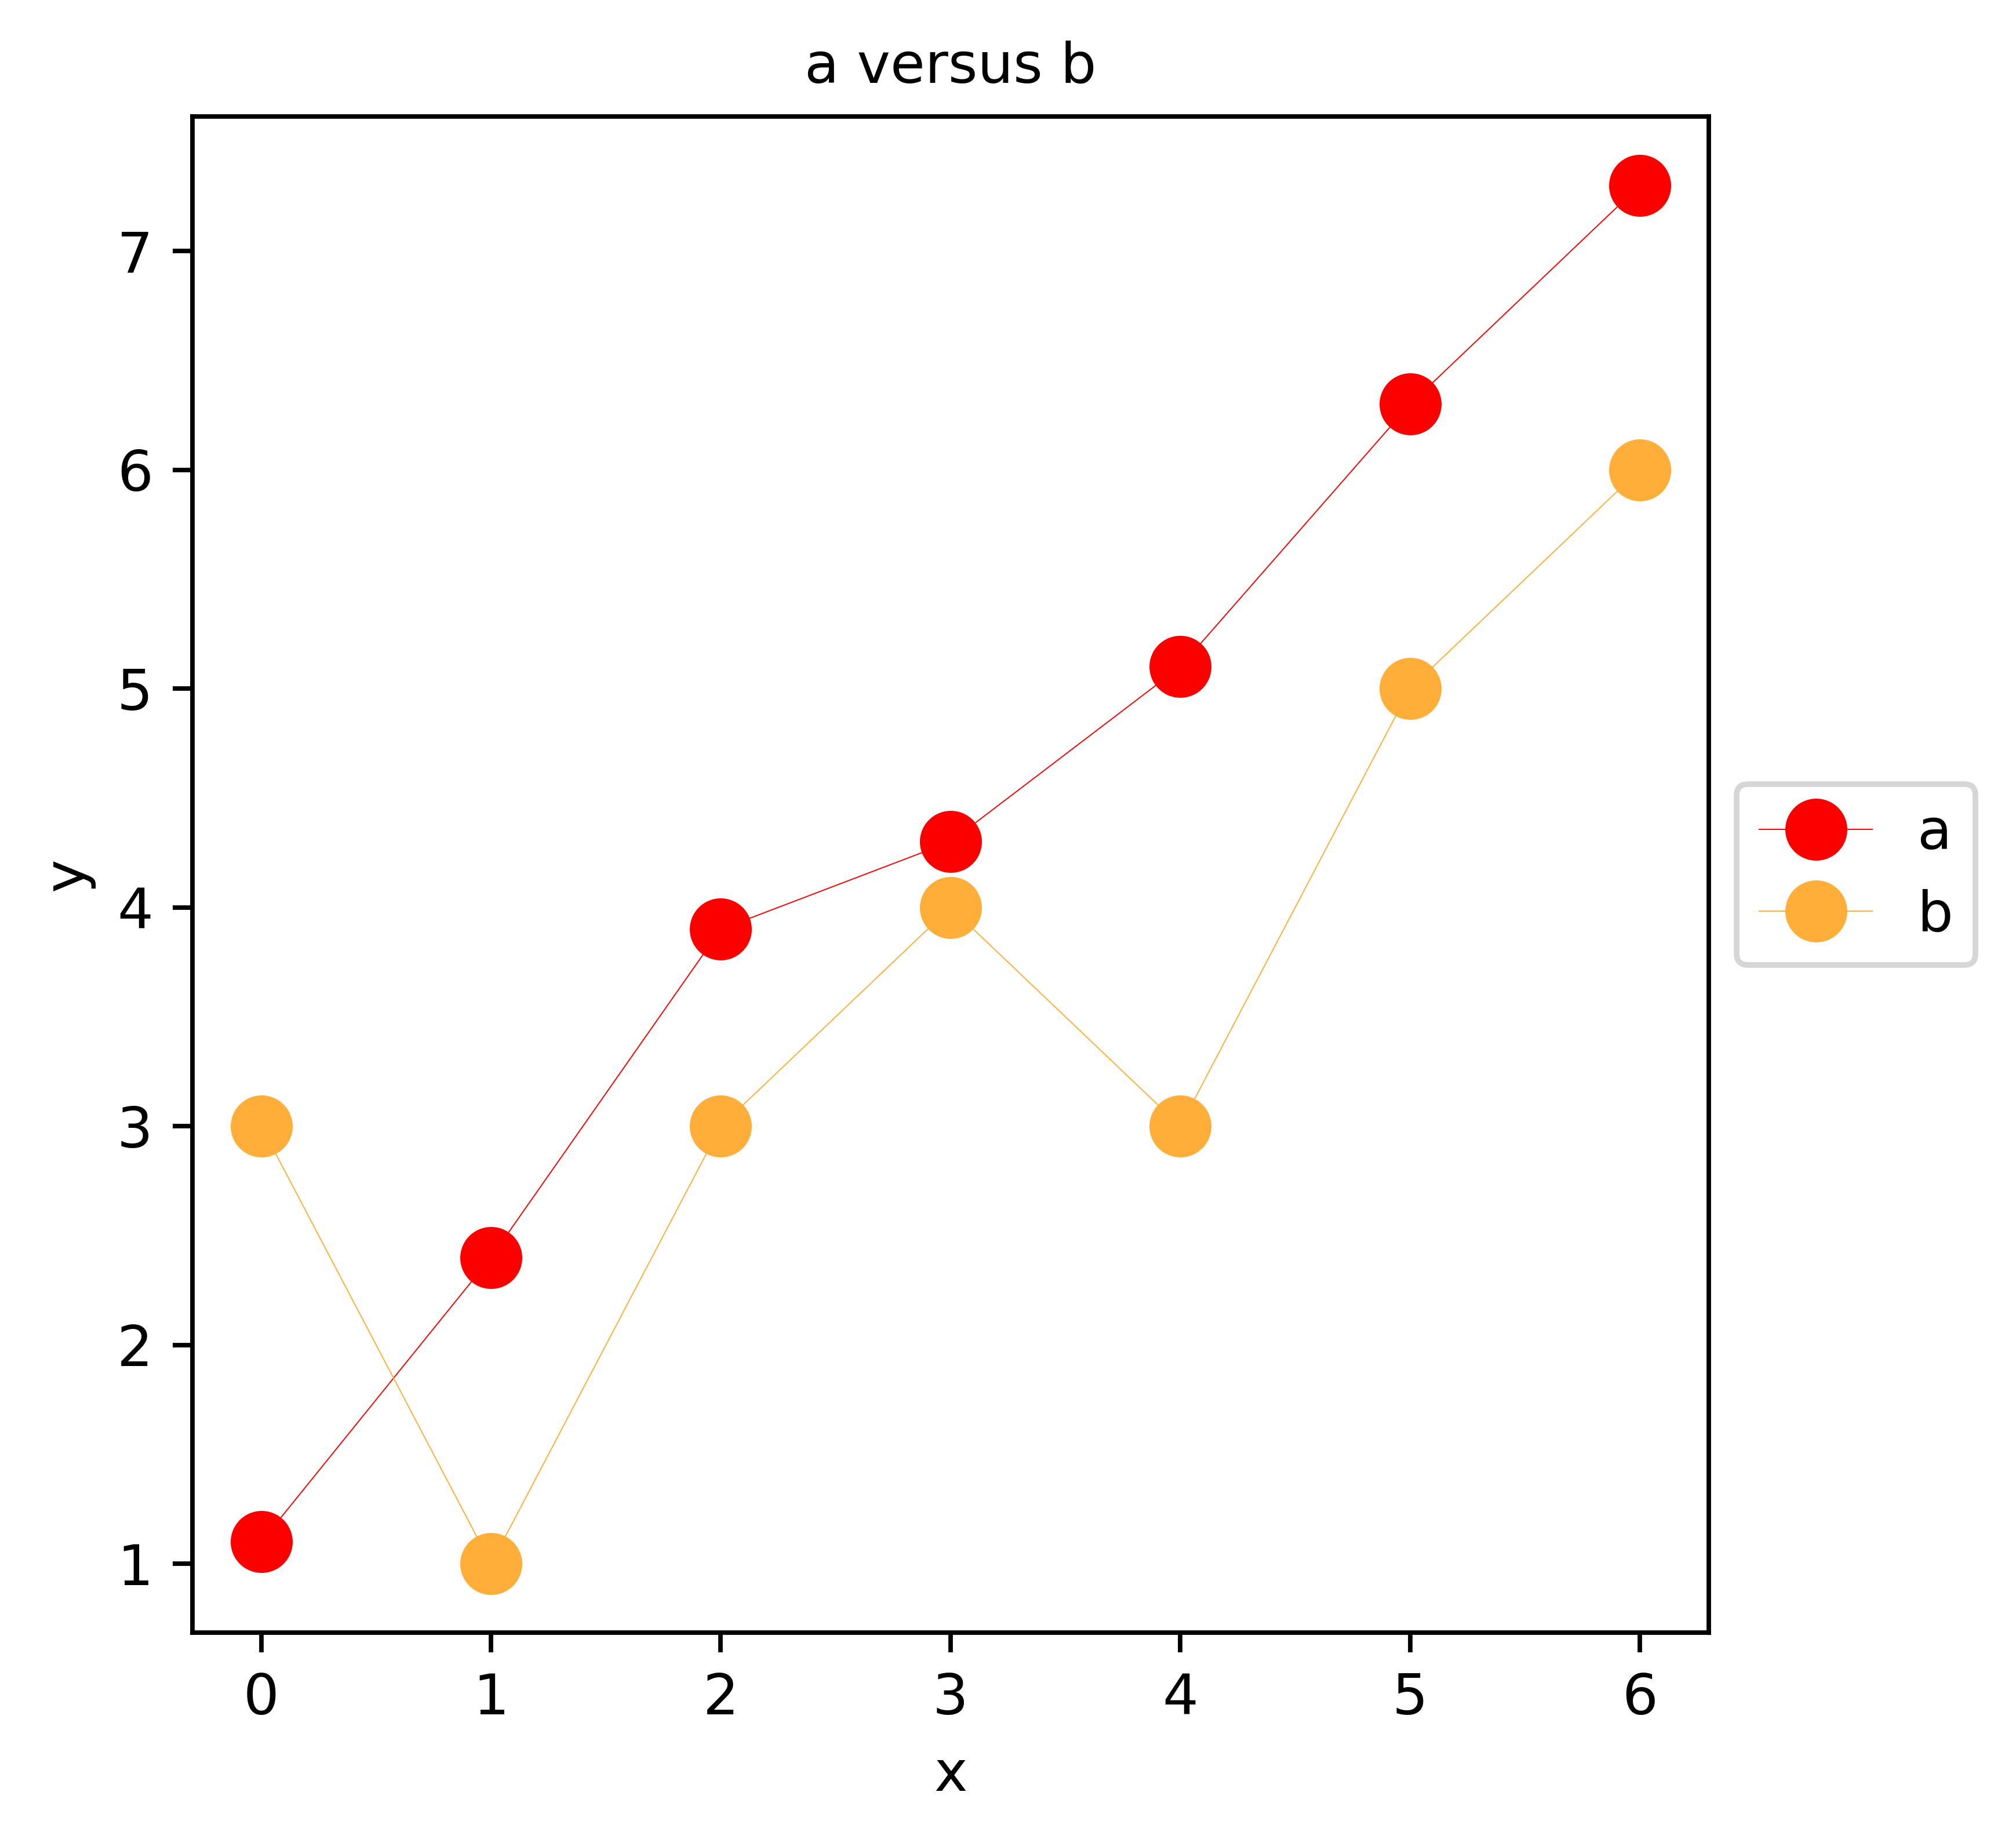
time graphs
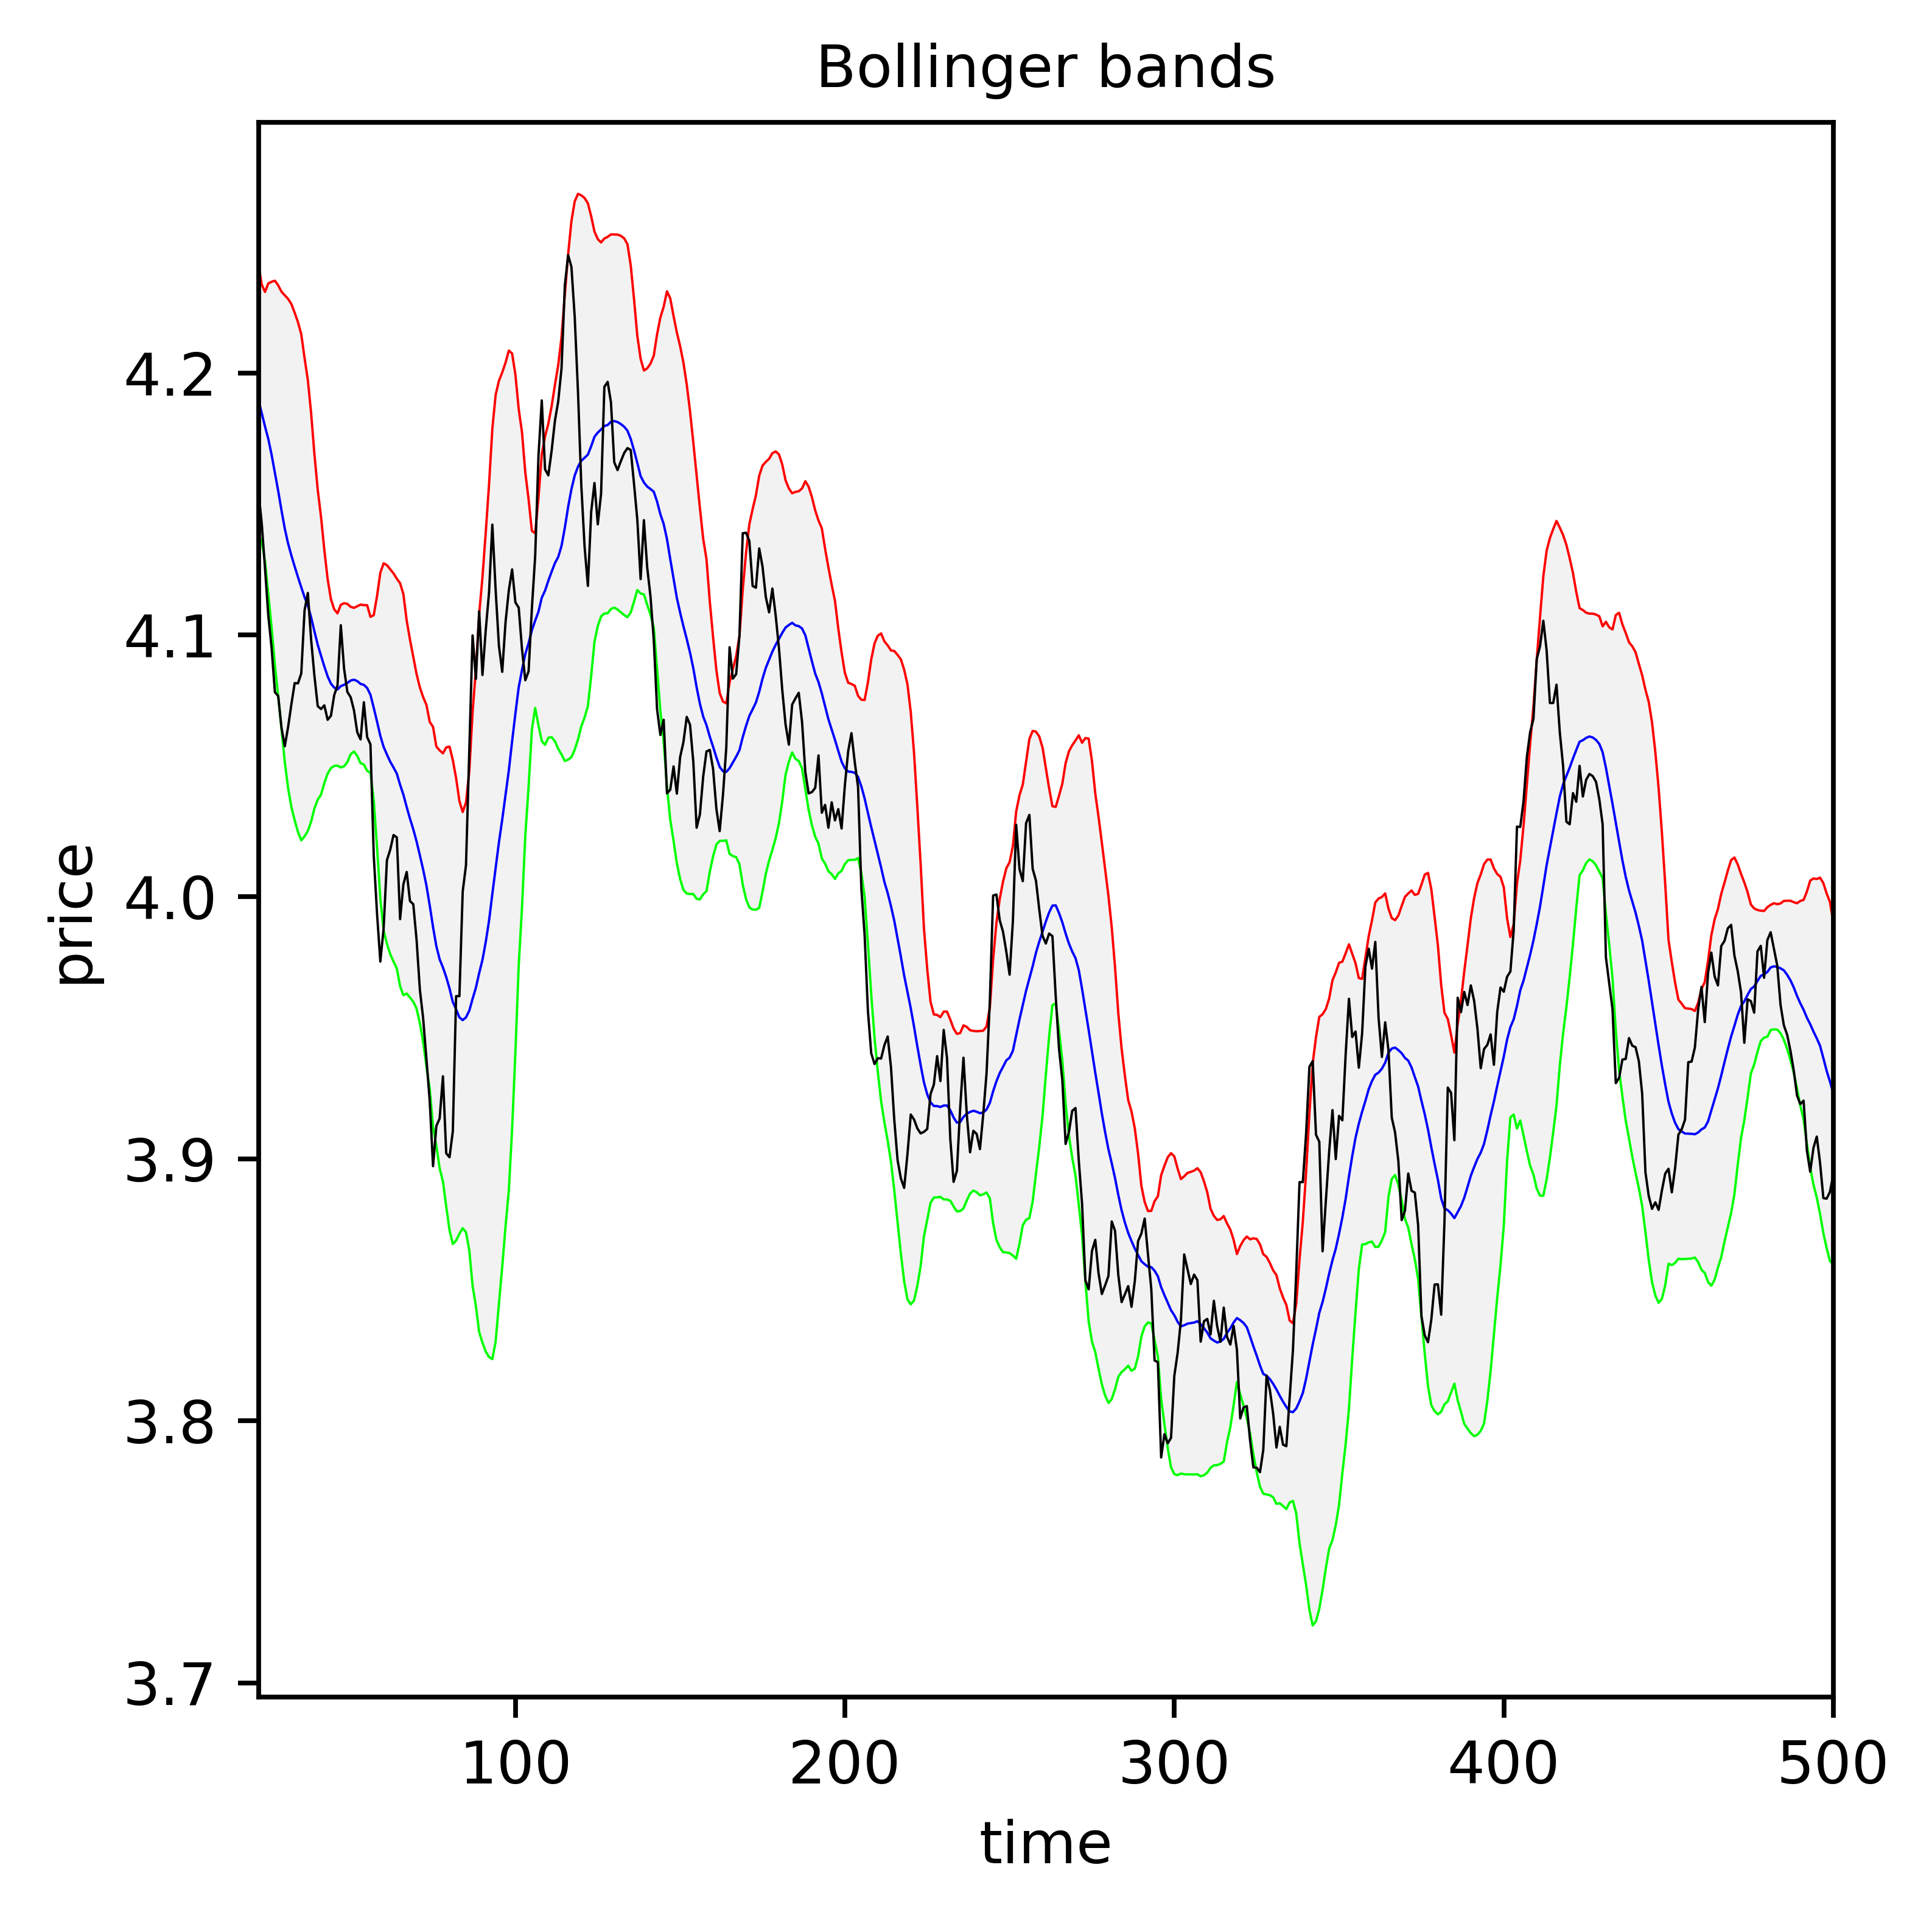
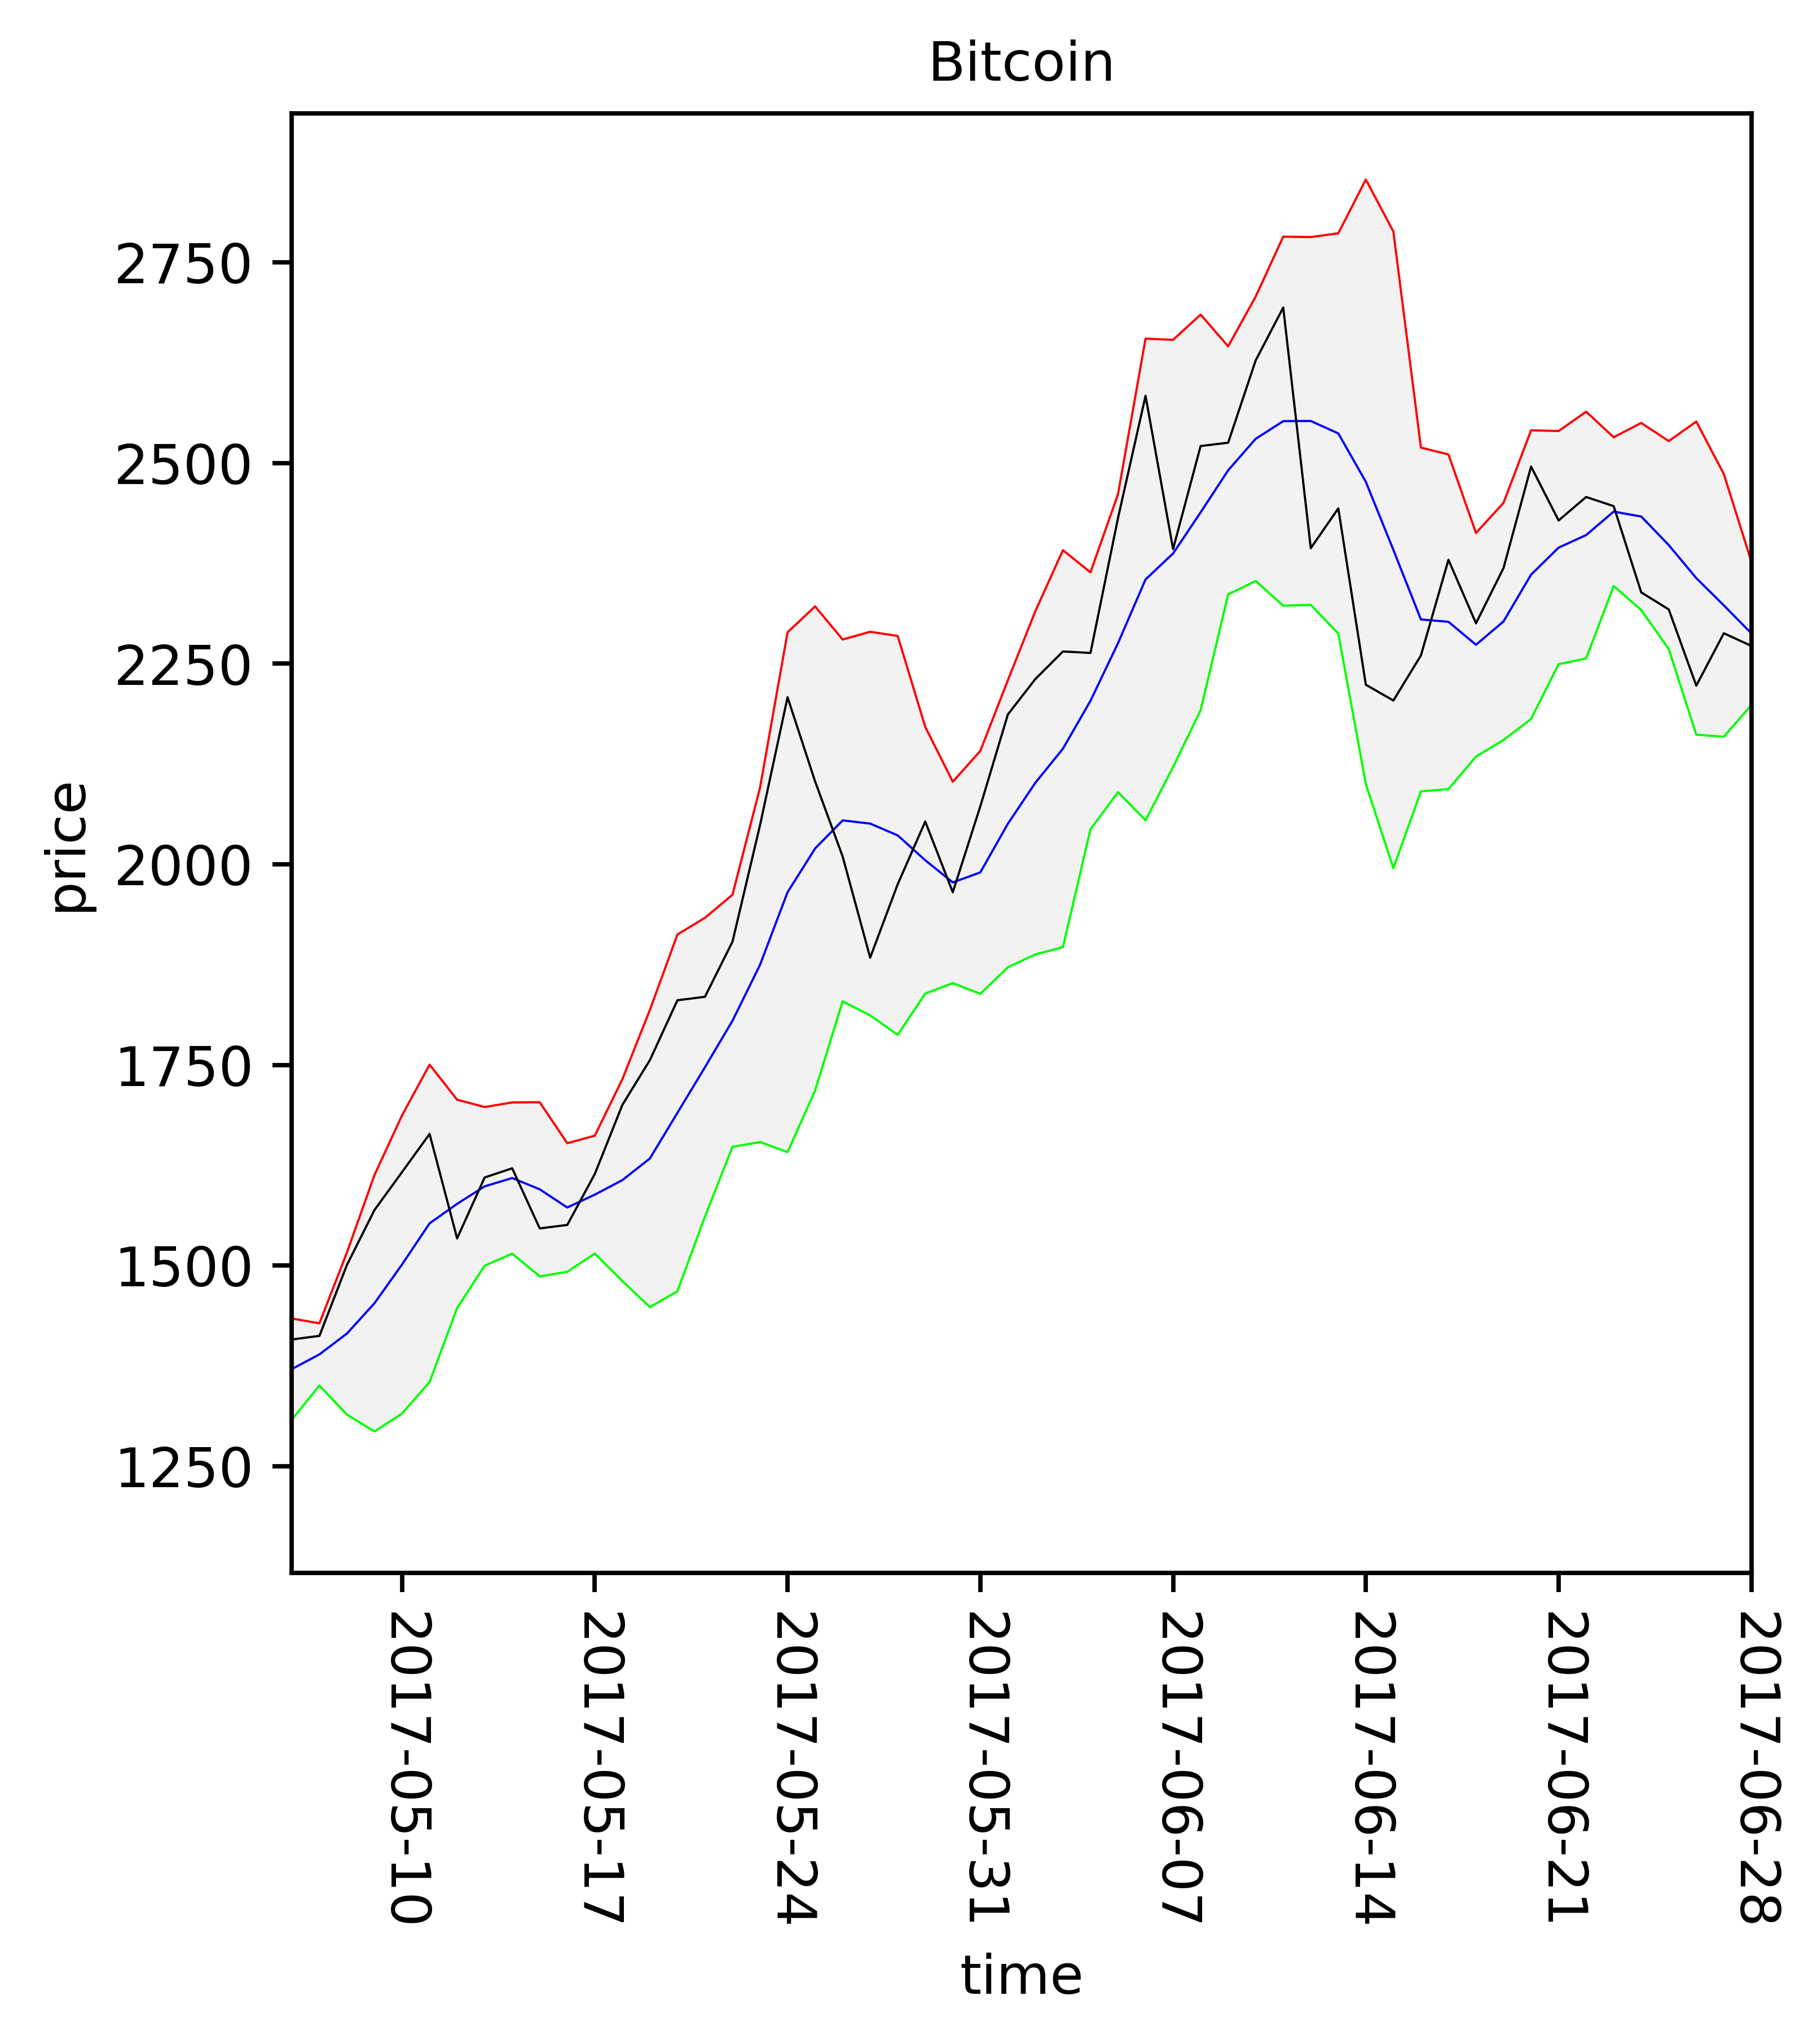
Bollinger bands
graphs
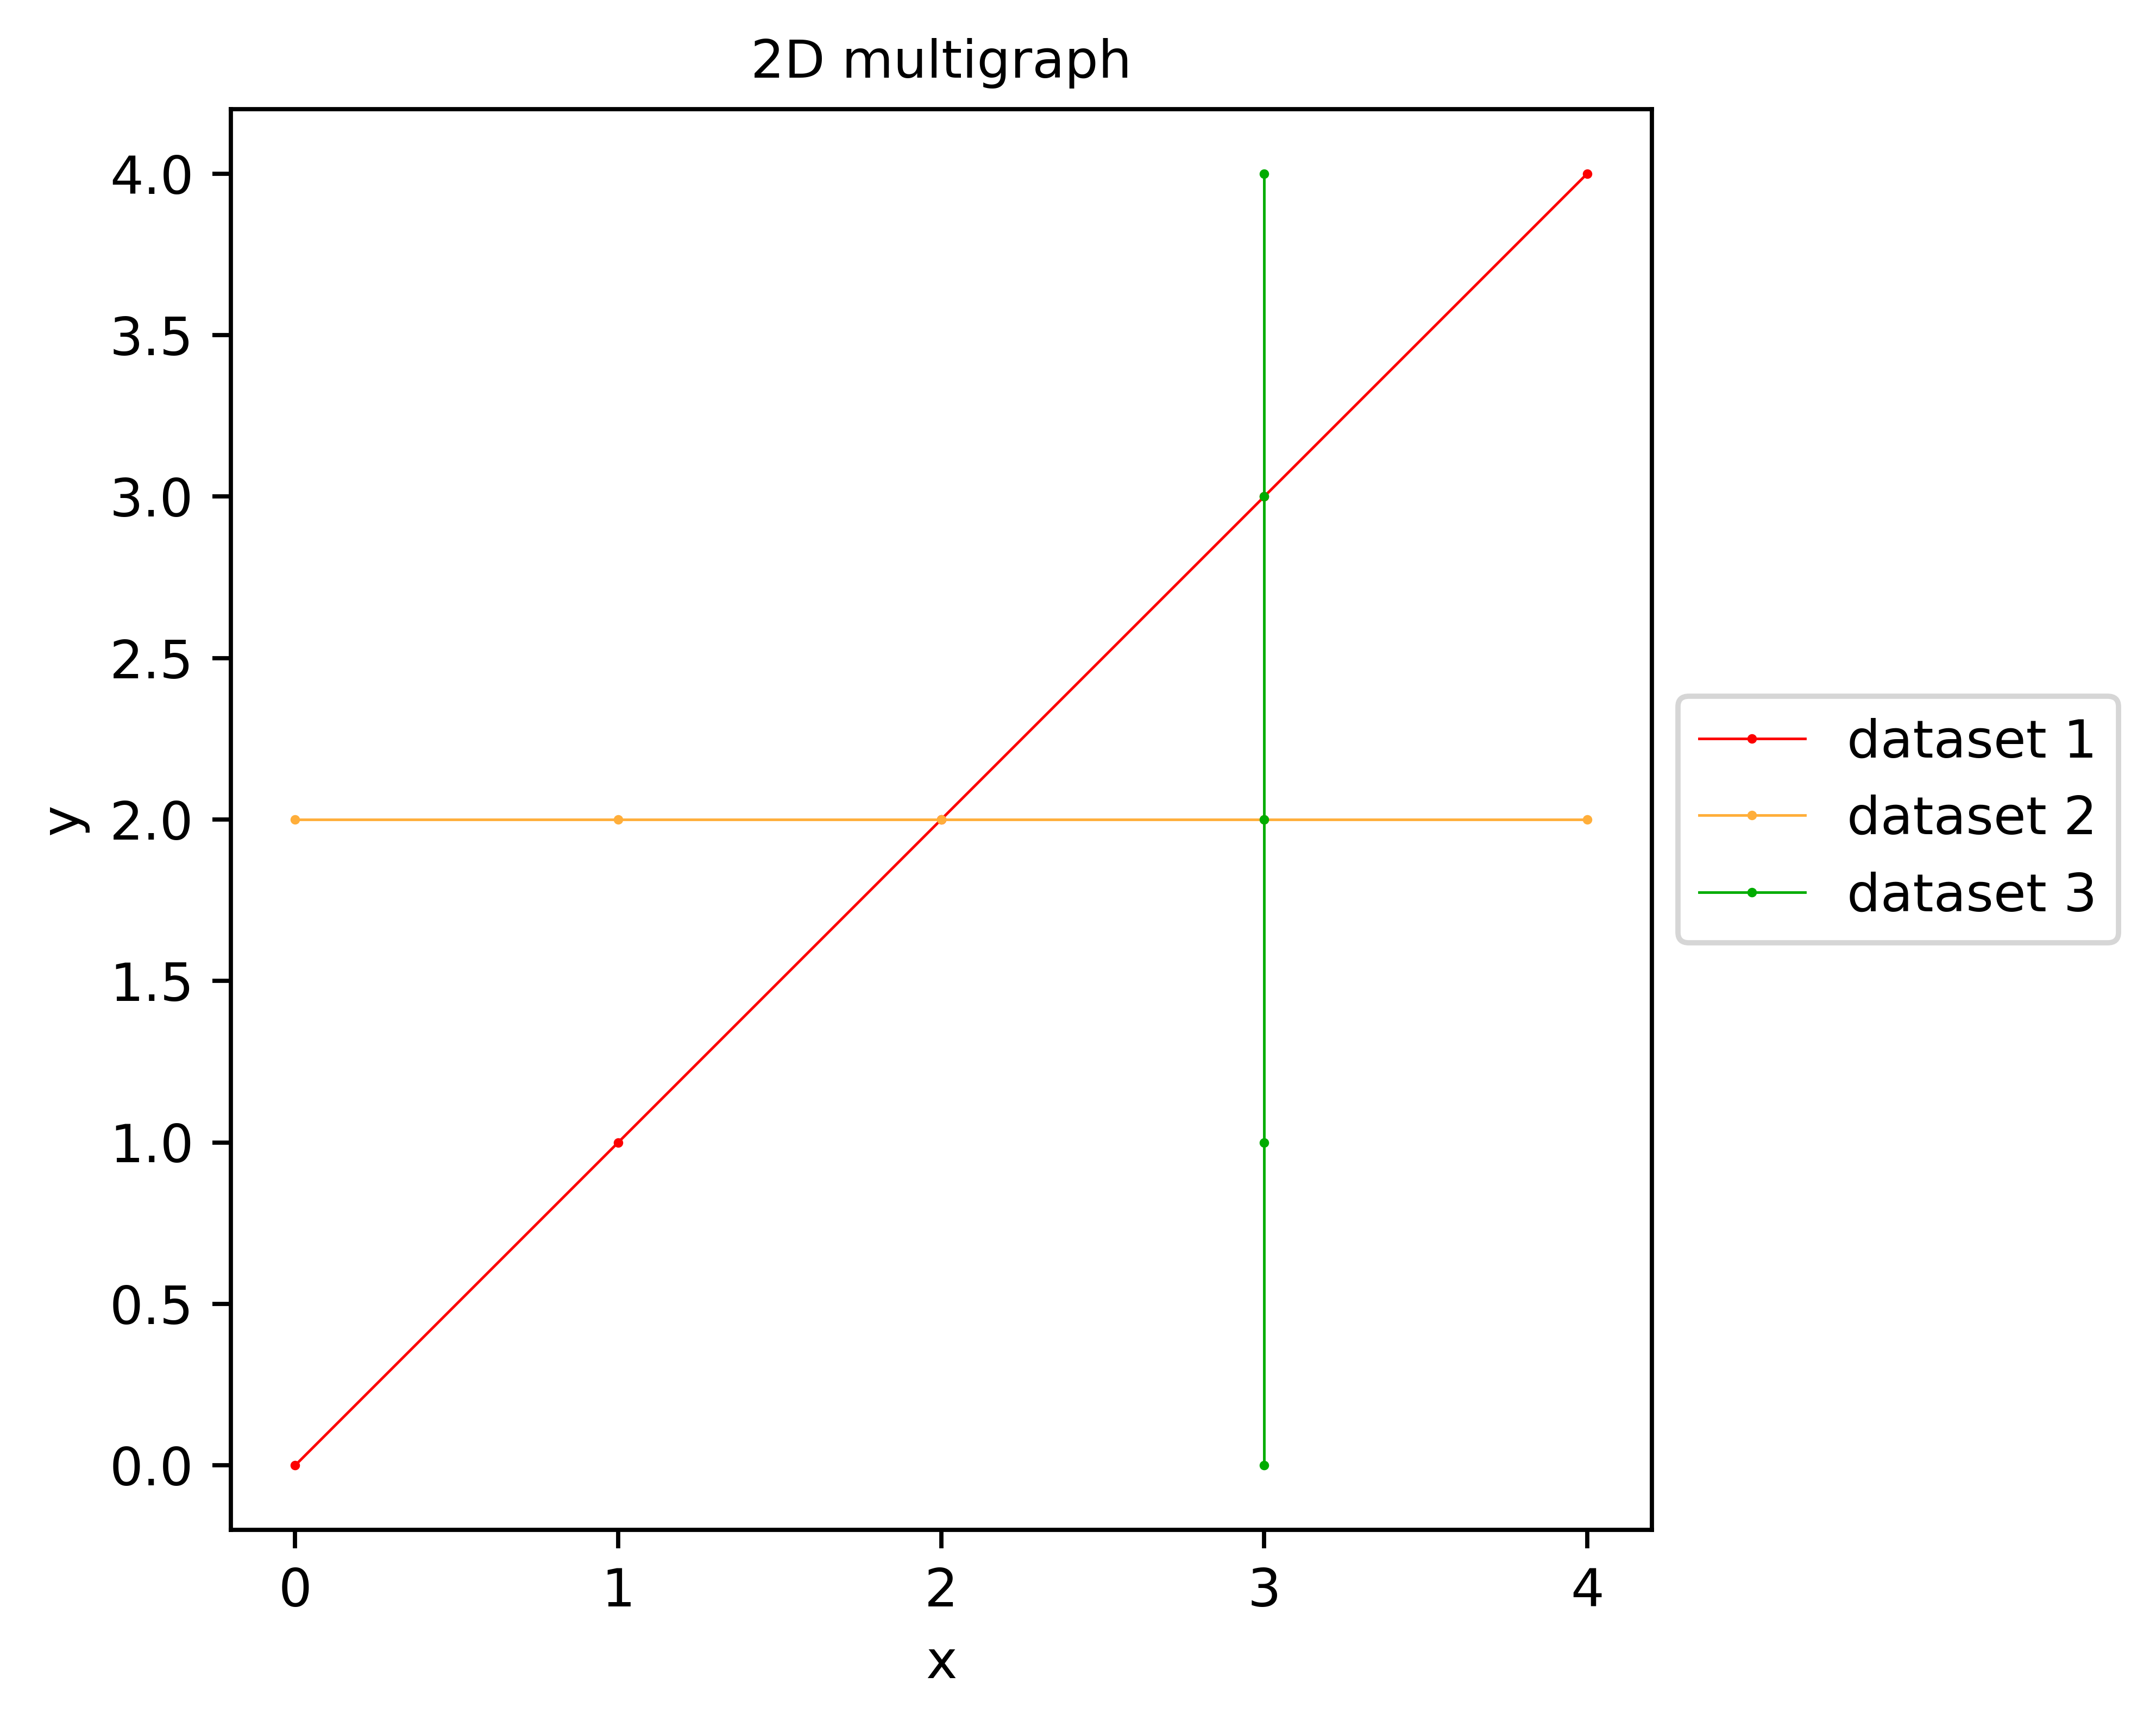
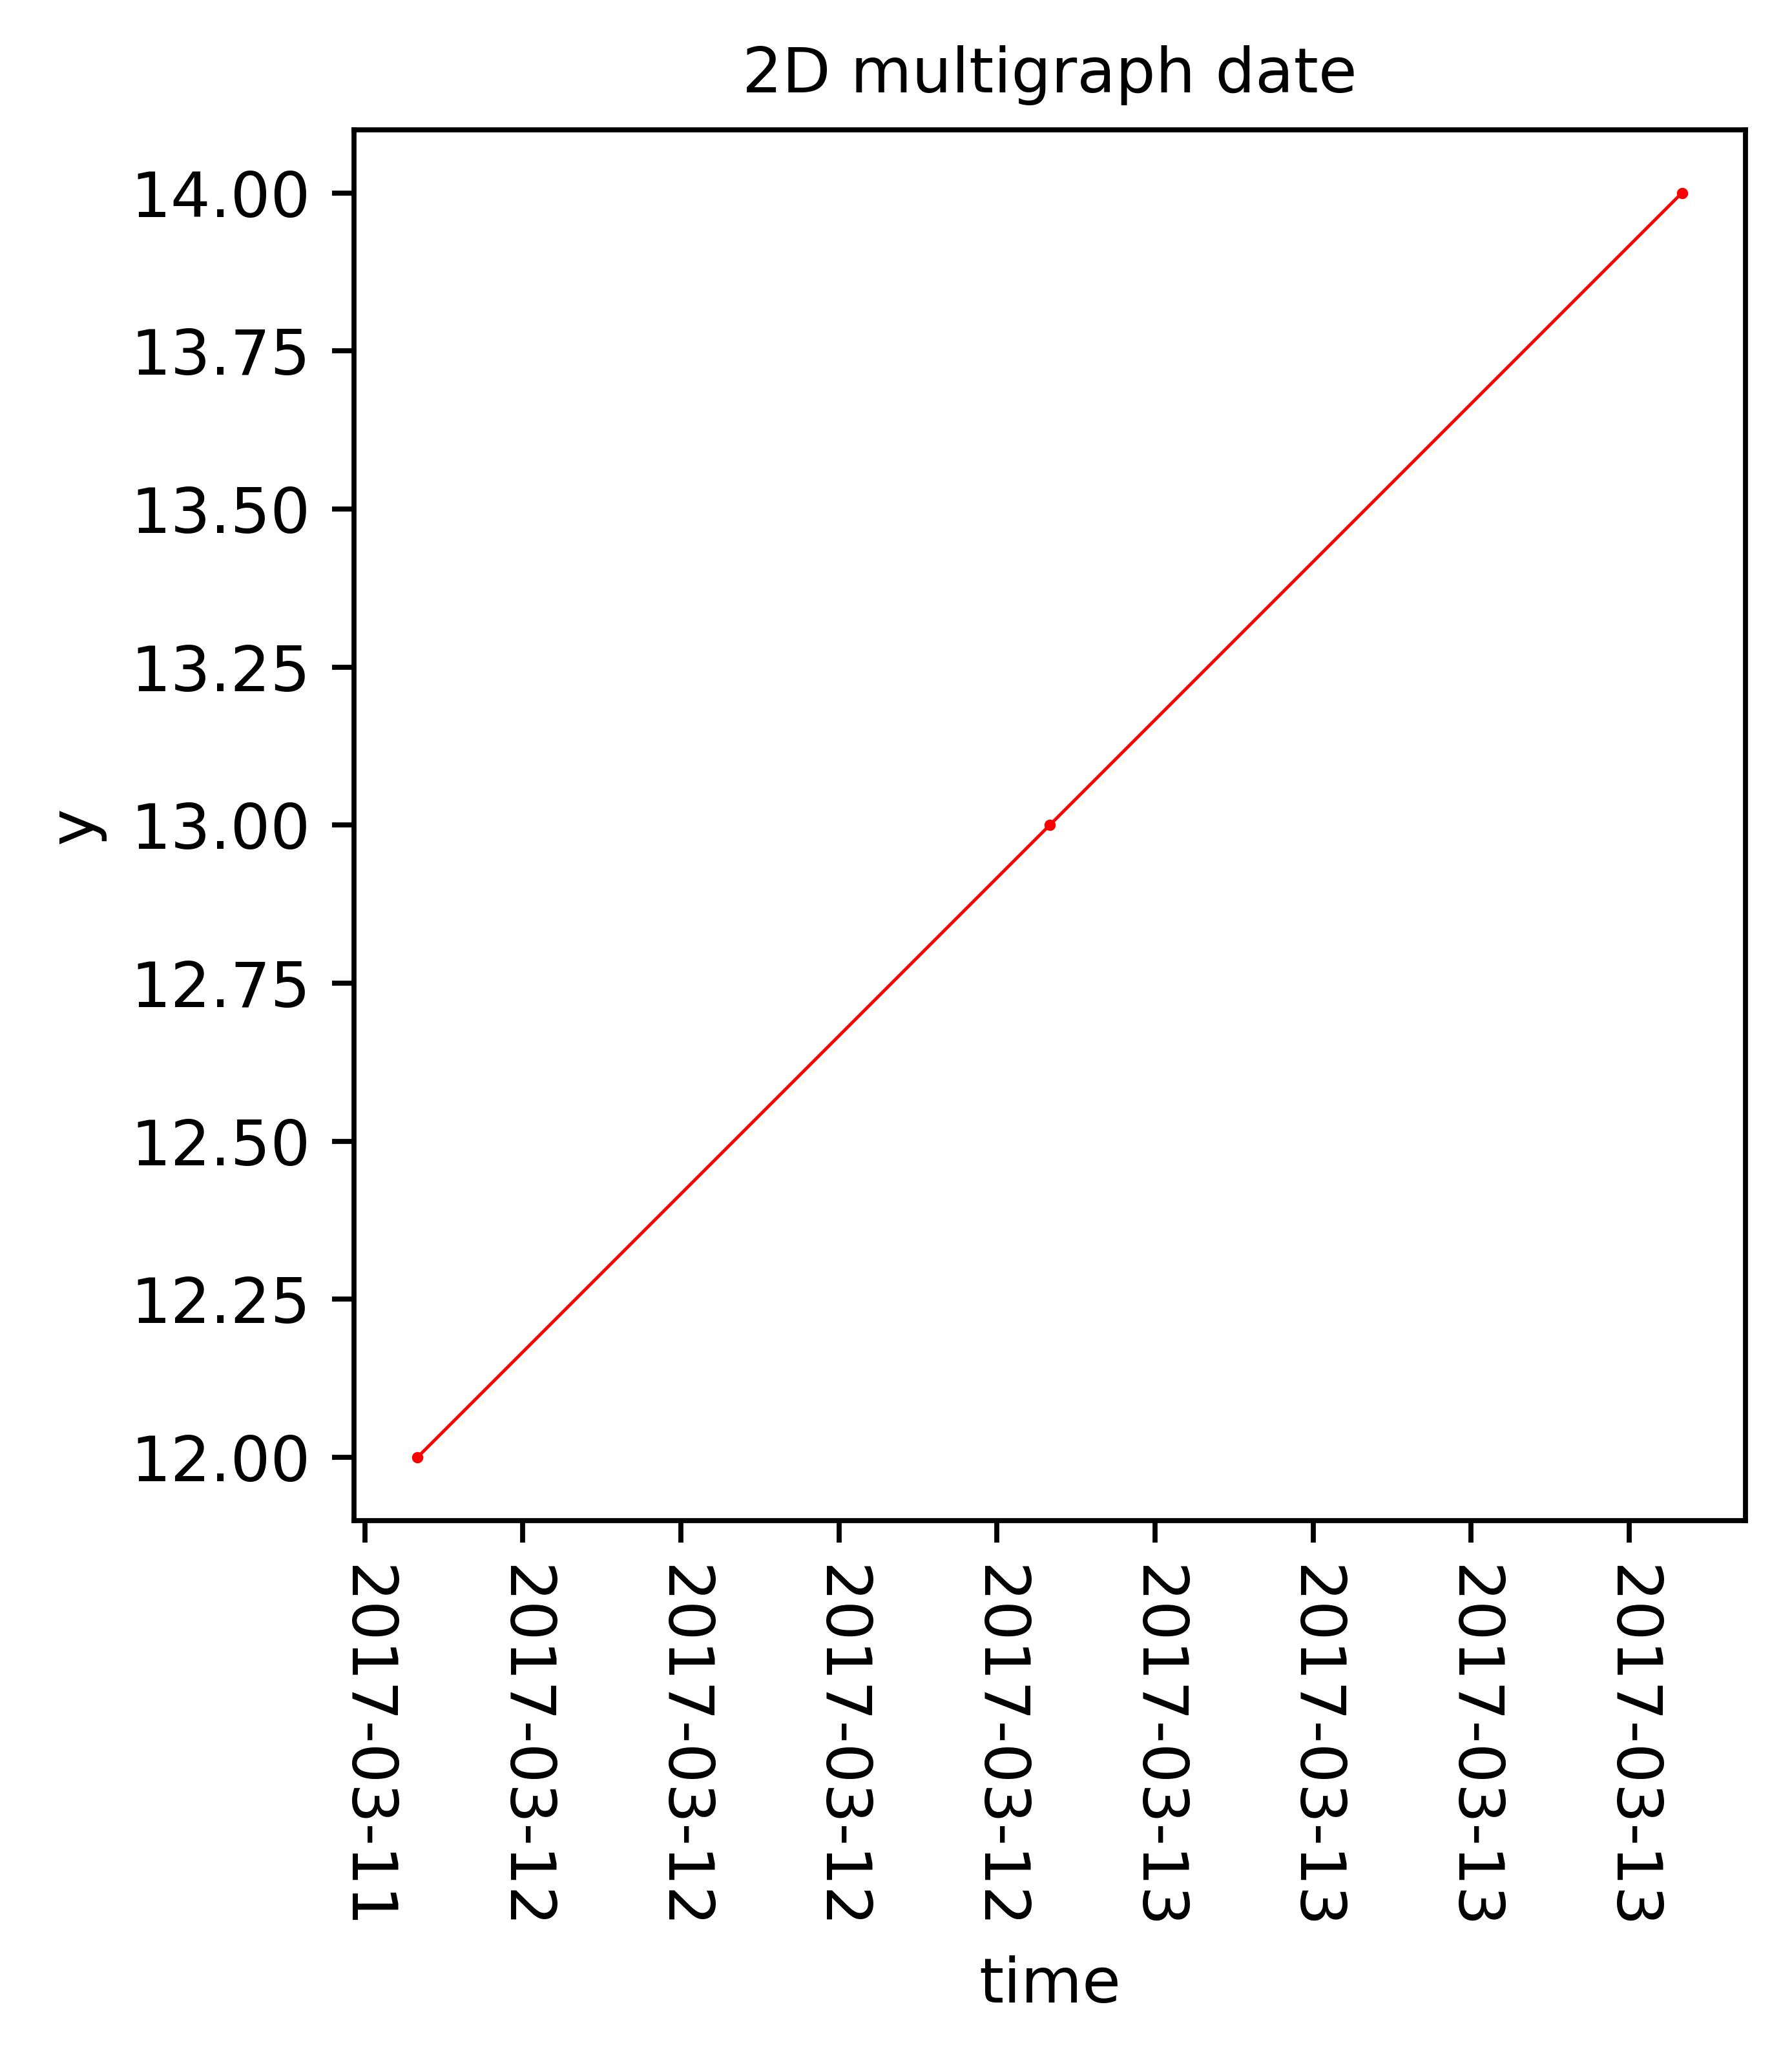
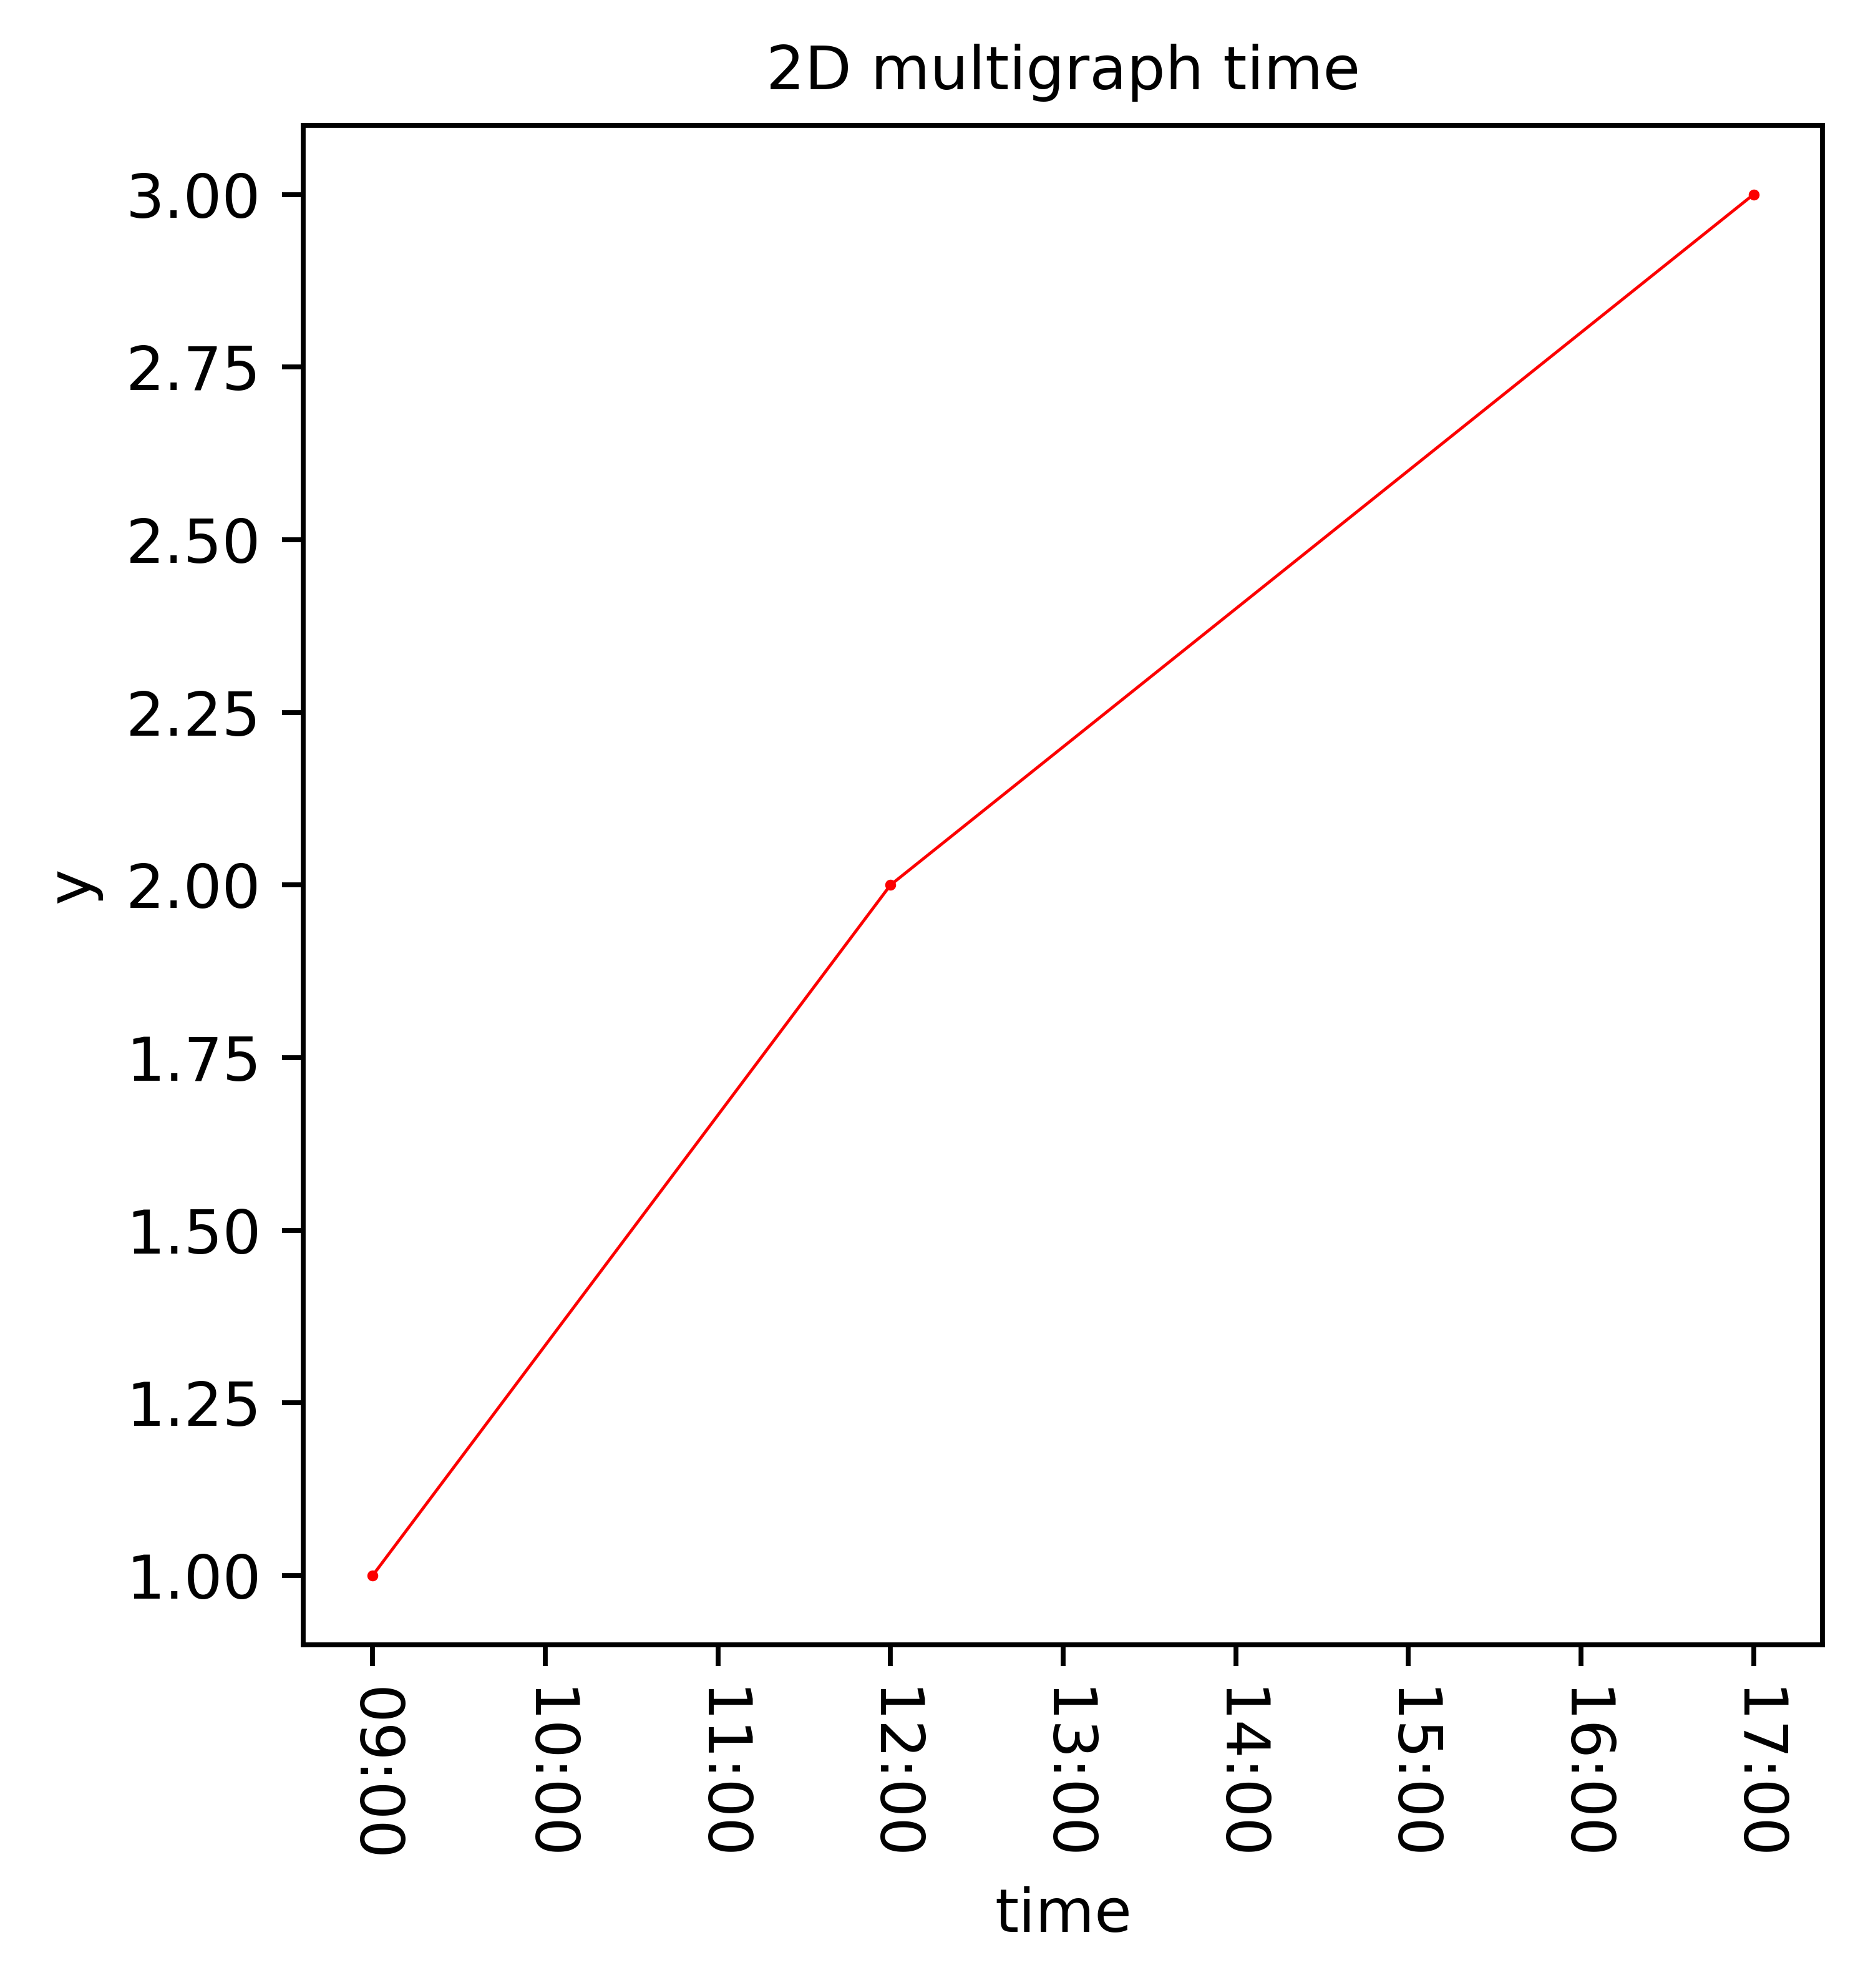
databases
Datavision features some scripts for interacting with databases:
change_field_name_database_SQLite.py
duplicates_database_SQLite.py
view_database_SQLite.py
1 maintainer

Metadata
1 maintainer
Release files for datavision 2018.1.8.2333
For a detailed explanation of source distributions (sdists) and built distributions (wheels), please see the package formats documentation.
Source distribution (sdist)
| File | Size | Uploaded | |
|---|---|---|---|
| datavision-2018.1.8.2333.tar.gz | 38.1 kB | Details |
Release files / datavision-2018.1.8.2333.tar.gz
| Download URL | datavision-2018.1.8.2333.tar.gz |
|---|---|
| Size | 38.1 kB |
| Tags | Source |
|
SHA-256 checksum How to use checksums |
a104c9393f5d7be8d934ed6b7b98145c63937bb6e418fe685079ada1f081d272
|
|
BLAKE2b-256 checksum How to use checksums |
0e30e07aae4d4ee35eb03ac3555ab3176008bc453e960478da03c5c48320ff17
|
| Upload date | |
|
Uploaded using Trusted Publishing? What is trusted publishing? |
No |














