Plot Dicom ECG Waveforms

Project description
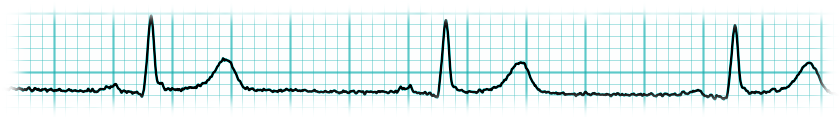
dicom-ecg-plot
A Python tool to render 12-lead ECG waveforms from DICOM files.
The input can be a local .dcm file or a WADO triplet (studyUID seriesUID objectUID);
in the latter case the DICOM object is downloaded from the server configured in ecgconfig.py.
THE PROGRAM IS DISTRIBUTED IN THE HOPE THAT IT WILL BE USEFUL, BUT WITHOUT ANY WARRANTY OF ANY KIND.
About
ECG devices and PACS systems store electrocardiograms in the DICOM Waveform format (Supplement 30),
but most viewers either require proprietary software or render the tracing as a static image embedded
in the DICOM file itself. dicom-ecg-plot reads the raw waveform samples directly, applies standard
signal processing, and produces a publication-quality plot you can embed in reports, share as a PDF,
or pipe into automated workflows.
It is designed for use in clinical informatics and research environments where ECGs need to be extracted from a PACS/RIS and converted to an open, portable format without depending on the originating device's software.
Features
- Reads raw DICOM waveform data — decodes waveform samples, lead labels, and metadata directly from DICOM tags, independent of the device manufacturer
- Multiple lead layouts —
3x4_1(standard 12-lead + rhythm strip),3x4,6x2,12x1; custom layouts configurable inecgconfig.py - WADO retrieval — fetches DICOM objects from a PACS via WADO-URI using a
studyUID / seriesUID / objectUIDtriplet - Signal filtering — 2nd-order 40 Hz lowpass Butterworth filter to remove high-frequency noise
- Standard ECG grid — 5 mm major grid with optional 1 mm minor grid
- Automated interpretation — optionally renders the machine-generated interpretation text stored in the DICOM file
- Flexible output — writes PDF, PNG, SVG, TIFF and other Matplotlib-supported formats; streams to stdout for pipeline use
- Configurable branding — institution name can be read from the DICOM tag or overridden in config
Online demo
ecg.galliera.it — upload your own DICOM files or explore preloaded samples from different ECG device models.
Install
python3 -m venv ecg
. ecg/bin/activate
pip install dicom-ecg-plot
Usage
dicom-ecg-plot <inputfile> [options]
dicom-ecg-plot <studyUID> <seriesUID> <objectUID> [options]
dicom-ecg-plot --help
Options
| Option | Description | Default |
|---|---|---|
--layout=LAYOUT |
Lead arrangement | 3x4_1 |
--paper=PAPER |
Paper size: a4 or letter |
a4 |
--output=FILE |
Output file; format inferred from extension | — |
--format=FMT |
Explicit output format (used when no output file is given) | — |
--minor-grid |
Draw 1 mm minor grid in addition to the default 5 mm grid | off |
--interpretation |
Include automated ECG interpretation text, if present in DICOM | off |
Output formats
eps, jpeg, jpg, pdf, pgf, png, ps, raw, rgba, svg, svgz, tif, tiff
When --output is given the format is inferred from the file extension.
When no output file is given, --format must be specified and the result is written to stdout.
Layouts
| Layout | Description |
|---|---|
3x4_1 |
3 rows × 4 columns + 1 rhythm strip (default) |
3x4 |
3 rows × 4 columns |
6x2 |
6 rows × 2 columns |
12x1 |
12 rows × 1 column |
Custom layouts can be added to ecgconfig.py by extending the LAYOUT dictionary.
Examples
# Local file → PDF
dicom-ecg-plot anonymous_ecg.dcm --output anonymous_ecg.pdf

# Custom layout → PNG
dicom-ecg-plot anonymous_ecg.dcm --layout 6x2 --output anonymous_ecg.png

# Pipe to stdout
dicom-ecg-plot anonymous_ecg.dcm --format svg > anonymous_ecg.svg

# Letter paper with minor grid
dicom-ecg-plot anonymous_ecg.dcm --paper letter --minor-grid --output anonymous_ecg.pdf

# Include automated interpretation
dicom-ecg-plot anonymous_ecg.dcm --interpretation --output anonymous_ecg.pdf

# WADO retrieval
dicom-ecg-plot <studyUID> <seriesUID> <objectUID> --format pdf > anonymous_ecg.pdf
Configuration
Copy or edit ecgconfig.py to customise the tool:
# WADO server URL
WADOSERVER = "http://your-wado-server/"

# Institution name displayed on the plot (None = read from DICOM tag InstitutionName)
INSTITUTION = None

# Custom layouts: list of rows, each row is a list of lead indices (0–11)
LAYOUT = { ... }
Signal processing
Signals are filtered with a 2nd-order 40 Hz lowpass Butterworth filter. The grid follows standard ECG conventions: 5 mm major grid, optional 1 mm minor grid.
References
- DICOM Supplement 30 — Waveforms
- DICOM lookup — Waveform modules
- ECG signal encoding in DICOM
- Mortara ECG DICOM Conformance Statement
License
MIT — see LICENSE.
Authors
Marco De Benedetto, Simone Ferretti, Francesco Formisano


Download files
Download the file for your platform. If you're not sure which to choose, learn more about installing packages.
Source Distribution
Built Distribution
Filter files by name, interpreter, ABI, and platform.
If you're not sure about the file name format, learn more about wheel file names.
Copy a direct link to the current filters
File details
Details for the file dicom_ecg_plot-1.4.1.tar.gz.
File metadata
- Download URL: dicom_ecg_plot-1.4.1.tar.gz
- Upload date:
- Size: 15.4 kB
- Tags: Source
- Uploaded using Trusted Publishing? No
- Uploaded via: twine/6.2.0 CPython/3.9.6
File hashes
| Algorithm | Hash digest | |
|---|---|---|
| SHA256 |
3fc14036bea28b73250b6a0e15e9a604c6b84c2038c77ae99de60666dfb722f2
|
|
| MD5 |
bf135cf85a12e85fdb6d7f3ea83b69b4
|
|
| BLAKE2b-256 |
c6211efa1b0021215c2d56043c2145e86b77b7027422fda3235326379d25b2d4
|
File details
Details for the file dicom_ecg_plot-1.4.1-py3-none-any.whl.
File metadata
- Download URL: dicom_ecg_plot-1.4.1-py3-none-any.whl
- Upload date:
- Size: 18.0 kB
- Tags: Python 3
- Uploaded using Trusted Publishing? No
- Uploaded via: twine/6.2.0 CPython/3.9.6
File hashes
| Algorithm | Hash digest | |
|---|---|---|
| SHA256 |
49230aeef4054b2579babfebc18c5ec192edbe1fa84d58209a0dd3bc19f0e4d8
|
|
| MD5 |
f68bd7e4b6aabe8e98774b27d15a8516
|
|
| BLAKE2b-256 |
3622791d02ab3cf9cfd049567f4d78445b6aa8bac70784893a922e47e49332a8
|


