
##Yet another Google Charts library for Django##
- ~~Requires installation of the gviz_api library which is freely available from Google.~~
- See http://code.google.com/p/google-visualization-python/ for details.
**UPDATE: The gviz_api library is now included.**
## Note ##
**Development status updated to beta. The code is still short on unit tests, so bad stuff can happen!**
Please feel free submit patches/pull requests ;)
### Disclaimer ###
This library is heavy influenced by [mvasilkov's django-google-charts](https://github.com/mvasilkov/django-google-charts),
and some of the code (template tags and javascript code) are directly copied from him. I've done some minor adjustments to
make it work for my approach.
## About django-gcharts ##
As I find mvasilkov's approach very clever, I think it would be nice if the model could deliver it's data in a format
the Google Visualization API can read.
This library is an attempt of doing that, by using a custom QuerySet and Manager which is plugged directly into the model,
and some wrapper methods to bind the QuerySet data up against the gviz_api library.
The goal is to "fully" support the QuerySet (with aggregates, joins, extra, annotates, etc) so that we can gather data
by using familiar QuerySet syntax.
### Demo site ###
The git version now includes a demo site which can be run at your local machine once cloned. The demo site previews a few
of the charts included in the Google Visualization API, and should contain enough working examples for you to figure out
how this stuff works.
To get started with the demo site, follow these steps.
$ git clone https://github.com/rhblind/django-gcharts.git
$ cd django-gcharts
$ python manage.py syncdb
$ python manage.py initdata
$ python manage.py runserver
Then point your browser to http://localhost:8000 and you should see a few different charts displayed.
## Configuration ##
### Installation ###
$ pip install django-gcharts
### settings.py ###
GOOGLECHARTS_API = "1.1"
GOOGLECHARTS_PACKAGES = ["corechart"]
INSTALLED_APPS = (
...
'gcharts',
...
)
* `GOOGLECHARTS_API` - Optional. Defaults to 1.1
* `GOOGLECHARTS_PACKAGES` - Optional. List of packages that should be loaded. Defaults to only `corechart`.
### Packages ###
The charts in the Google Visualization API are separated into different packages. For the most basic charts
you would only need to load the `corechart` package (which is the default if none is specified).
Below follows a list of which charts are available in the different packages.
**Please note that all packages specified in settings.py will load every time the `{% gcharts %} ... {% endgcharts %}`
block is rendered.**
Optionally, the package for the specific chart can be specified in the `{% render ... %}` tag as a the last option.
The tag should in that case be written as: `{% render "div_id" "data" "options" "package name" %}`. This will cause
the package to be applied to the current `{% gcharts %} ... {% endgcharts %}` block only, in addition to those specified
in settings.py.
* `corechart` contains these charts
* [AreaChart](https://developers.google.com/chart/interactive/docs/gallery/areachart)
* [BarChart](https://developers.google.com/chart/interactive/docs/gallery/barchart)
* [BubbleChart](https://developers.google.com/chart/interactive/docs/gallery/bubblechart)
* [CandleStickChart](https://developers.google.com/chart/interactive/docs/gallery/candlestickchart)
* [ColumnChart](https://developers.google.com/chart/interactive/docs/gallery/columnchart)
* [ComboChart](https://developers.google.com/chart/interactive/docs/gallery/combochart)
* [LineChart](https://developers.google.com/chart/interactive/docs/gallery/linechart)
* [PieChart](https://developers.google.com/chart/interactive/docs/gallery/piechart)
* [ScatterChart](https://developers.google.com/chart/interactive/docs/gallery/scatterchart)
* [SteppedAreaChart](https://developers.google.com/chart/interactive/docs/gallery/steppedareachart)
* `gauge`
* [Gauge](https://developers.google.com/chart/interactive/docs/gallery/gauge)
* `geochart`
* [GeoChart](https://developers.google.com/chart/interactive/docs/gallery/geochart)
* `table`
* [Table](https://developers.google.com/chart/interactive/docs/gallery/table)
* `treemap`
* [TreeMap](https://developers.google.com/chart/interactive/docs/gallery/treemap)
### models.py ###
Register the GChartsManager to the model you'd like to draw charts from
from django.db import models
from gcharts import GChartsManager
class MyModel(models.Model):
# register the GChartsManager as default manager for this model.
objects = GChartsManager()
my_field = models.CharField(....)
my_other_field = models.IntegerField()
...
## Examples ##
Spam Inc. needs to chart how much spam they sell.
**models.py**
from django.db import models
from gcharts import GChartsManager
class Spam(models.Model):
objects = GChartsManager()
name = models.Charfield(max_length=10)
...
...
cdt = models.DateTimeField(auto_add_now=True, verbose_name="Creation datetime")
**views.py**
from dateutil.relativedelta import relativedelta
from django.shortcuts import render_to_response
from django.template.context import RequestContext
from models import Spam
def render_chart(request):
if request.method == "GET":
# Get a point in time we want to render chart from
series_age = datetime.today() - relativedelta(months=3)
# Create a fairly advanced QuerySet using:
# - filter() to get records newer than 'series_age'
# - extra() to cast a PostgreSQL 'timestampz' to 'date' which translates to a pyton date object
# - values() to extract fields of interest
# - annotate() to group aggregate Count into 'id__count'
# - order_by() to make the aggregate work
qset = Spam.objects.filter(cdt__gt=series_age).extra(select={"date": "cdt::date"}) \
.values("date").annotate(Count("id")).order_by()
# Call the qset.to_json() method to output the data in json
# - labels is a dict which sets labels and the correct javascript data type for
# fields in the QuerySet. The javascript data types are automatically set,
# except for extra fields, which needs to be specified in a dict as:
# {'extra_name': {'javascript data type': 'label for field'}}
# - order is an iterable which sets the column order in which the data should be
# rendered
# - formatting is a dict {'field_name': 'expression'}, where expression is a
# valid string.format() expression.
spam_json = qset.to_json(labels={"id__count": "Spam sold", "date": {"date": "Date"}},
order=("date", "id__count"),
formatting={"id__count": "{0:d} units of spam"})
return render_to_response("sales_overviews/spamreport.html, {"spam_data": spam_json},
context_instance=RequestContext(request))
**spamreport.html**
...
{% load gcharts %}
{% gcharts %}
<!-- Global options for all charts -->
options = {
width: 500,
height: 300
};
<!-- cloned option and adapted for "spam_opt" -->
spam_opt = _clone(options);
spam_opt.title = "Units of Spam sold last 3 month";
{% options spam_opt %}
kind: "ColumnChart",
options: spam_opt,
{% endoptions %}
{% render "spam_chart" "spam_data" "spam_opt" %}
{% endgcharts %}
<div id="spam_chart">
<!-- container for spam_data chart -->
</div>
...
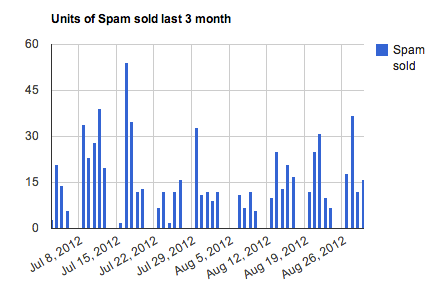
Should output something like this.
- ~~Requires installation of the gviz_api library which is freely available from Google.~~
- See http://code.google.com/p/google-visualization-python/ for details.
**UPDATE: The gviz_api library is now included.**
## Note ##
**Development status updated to beta. The code is still short on unit tests, so bad stuff can happen!**
Please feel free submit patches/pull requests ;)
### Disclaimer ###
This library is heavy influenced by [mvasilkov's django-google-charts](https://github.com/mvasilkov/django-google-charts),
and some of the code (template tags and javascript code) are directly copied from him. I've done some minor adjustments to
make it work for my approach.
## About django-gcharts ##
As I find mvasilkov's approach very clever, I think it would be nice if the model could deliver it's data in a format
the Google Visualization API can read.
This library is an attempt of doing that, by using a custom QuerySet and Manager which is plugged directly into the model,
and some wrapper methods to bind the QuerySet data up against the gviz_api library.
The goal is to "fully" support the QuerySet (with aggregates, joins, extra, annotates, etc) so that we can gather data
by using familiar QuerySet syntax.
### Demo site ###
The git version now includes a demo site which can be run at your local machine once cloned. The demo site previews a few
of the charts included in the Google Visualization API, and should contain enough working examples for you to figure out
how this stuff works.
To get started with the demo site, follow these steps.
$ git clone https://github.com/rhblind/django-gcharts.git
$ cd django-gcharts
$ python manage.py syncdb
$ python manage.py initdata
$ python manage.py runserver
Then point your browser to http://localhost:8000 and you should see a few different charts displayed.
## Configuration ##
### Installation ###
$ pip install django-gcharts
### settings.py ###
GOOGLECHARTS_API = "1.1"
GOOGLECHARTS_PACKAGES = ["corechart"]
INSTALLED_APPS = (
...
'gcharts',
...
)
* `GOOGLECHARTS_API` - Optional. Defaults to 1.1
* `GOOGLECHARTS_PACKAGES` - Optional. List of packages that should be loaded. Defaults to only `corechart`.
### Packages ###
The charts in the Google Visualization API are separated into different packages. For the most basic charts
you would only need to load the `corechart` package (which is the default if none is specified).
Below follows a list of which charts are available in the different packages.
**Please note that all packages specified in settings.py will load every time the `{% gcharts %} ... {% endgcharts %}`
block is rendered.**
Optionally, the package for the specific chart can be specified in the `{% render ... %}` tag as a the last option.
The tag should in that case be written as: `{% render "div_id" "data" "options" "package name" %}`. This will cause
the package to be applied to the current `{% gcharts %} ... {% endgcharts %}` block only, in addition to those specified
in settings.py.
* `corechart` contains these charts
* [AreaChart](https://developers.google.com/chart/interactive/docs/gallery/areachart)
* [BarChart](https://developers.google.com/chart/interactive/docs/gallery/barchart)
* [BubbleChart](https://developers.google.com/chart/interactive/docs/gallery/bubblechart)
* [CandleStickChart](https://developers.google.com/chart/interactive/docs/gallery/candlestickchart)
* [ColumnChart](https://developers.google.com/chart/interactive/docs/gallery/columnchart)
* [ComboChart](https://developers.google.com/chart/interactive/docs/gallery/combochart)
* [LineChart](https://developers.google.com/chart/interactive/docs/gallery/linechart)
* [PieChart](https://developers.google.com/chart/interactive/docs/gallery/piechart)
* [ScatterChart](https://developers.google.com/chart/interactive/docs/gallery/scatterchart)
* [SteppedAreaChart](https://developers.google.com/chart/interactive/docs/gallery/steppedareachart)
* `gauge`
* [Gauge](https://developers.google.com/chart/interactive/docs/gallery/gauge)
* `geochart`
* [GeoChart](https://developers.google.com/chart/interactive/docs/gallery/geochart)
* `table`
* [Table](https://developers.google.com/chart/interactive/docs/gallery/table)
* `treemap`
* [TreeMap](https://developers.google.com/chart/interactive/docs/gallery/treemap)
### models.py ###
Register the GChartsManager to the model you'd like to draw charts from
from django.db import models
from gcharts import GChartsManager
class MyModel(models.Model):
# register the GChartsManager as default manager for this model.
objects = GChartsManager()
my_field = models.CharField(....)
my_other_field = models.IntegerField()
...
## Examples ##
Spam Inc. needs to chart how much spam they sell.
**models.py**
from django.db import models
from gcharts import GChartsManager
class Spam(models.Model):
objects = GChartsManager()
name = models.Charfield(max_length=10)
...
...
cdt = models.DateTimeField(auto_add_now=True, verbose_name="Creation datetime")
**views.py**
from dateutil.relativedelta import relativedelta
from django.shortcuts import render_to_response
from django.template.context import RequestContext
from models import Spam
def render_chart(request):
if request.method == "GET":
# Get a point in time we want to render chart from
series_age = datetime.today() - relativedelta(months=3)
# Create a fairly advanced QuerySet using:
# - filter() to get records newer than 'series_age'
# - extra() to cast a PostgreSQL 'timestampz' to 'date' which translates to a pyton date object
# - values() to extract fields of interest
# - annotate() to group aggregate Count into 'id__count'
# - order_by() to make the aggregate work
qset = Spam.objects.filter(cdt__gt=series_age).extra(select={"date": "cdt::date"}) \
.values("date").annotate(Count("id")).order_by()
# Call the qset.to_json() method to output the data in json
# - labels is a dict which sets labels and the correct javascript data type for
# fields in the QuerySet. The javascript data types are automatically set,
# except for extra fields, which needs to be specified in a dict as:
# {'extra_name': {'javascript data type': 'label for field'}}
# - order is an iterable which sets the column order in which the data should be
# rendered
# - formatting is a dict {'field_name': 'expression'}, where expression is a
# valid string.format() expression.
spam_json = qset.to_json(labels={"id__count": "Spam sold", "date": {"date": "Date"}},
order=("date", "id__count"),
formatting={"id__count": "{0:d} units of spam"})
return render_to_response("sales_overviews/spamreport.html, {"spam_data": spam_json},
context_instance=RequestContext(request))
**spamreport.html**
...
{% load gcharts %}
{% gcharts %}
<!-- Global options for all charts -->
options = {
width: 500,
height: 300
};
<!-- cloned option and adapted for "spam_opt" -->
spam_opt = _clone(options);
spam_opt.title = "Units of Spam sold last 3 month";
{% options spam_opt %}
kind: "ColumnChart",
options: spam_opt,
{% endoptions %}
{% render "spam_chart" "spam_data" "spam_opt" %}
{% endgcharts %}
<div id="spam_chart">
<!-- container for spam_data chart -->
</div>
...
Should output something like this.

1 maintainer

Metadata
1 maintainer
Release files for django-gcharts 1.3
For a detailed explanation of source distributions (sdists) and built distributions (wheels), please see the package formats documentation.
Source distribution (sdist)
| File | Size | Uploaded | |
|---|---|---|---|
| django-gcharts-1.3.tar.gz | 21.7 kB | Details |
Release files / django-gcharts-1.3.tar.gz
| Download URL | django-gcharts-1.3.tar.gz |
|---|---|
| Size | 21.7 kB |
| Tags | Source |
|
SHA-256 checksum How to use checksums |
7a9387c03dc36c0d14ac982e4ebfcc74b60f576c8dc81baf6b1760606ed76f10
|
|
BLAKE2b-256 checksum How to use checksums |
4a76683c174aede4e6b264a10d53f160457bd063567c69b20f6b0f00638d1fbc
|
| Upload date | |
|
Uploaded using Trusted Publishing? What is trusted publishing? |
No |














