
Django Query Profiler







This is a query profiler for Django applications, for helping developers answer the question “My Django code/page/API is slow, How do I find out why?”
Below are some of the features of the profiler:
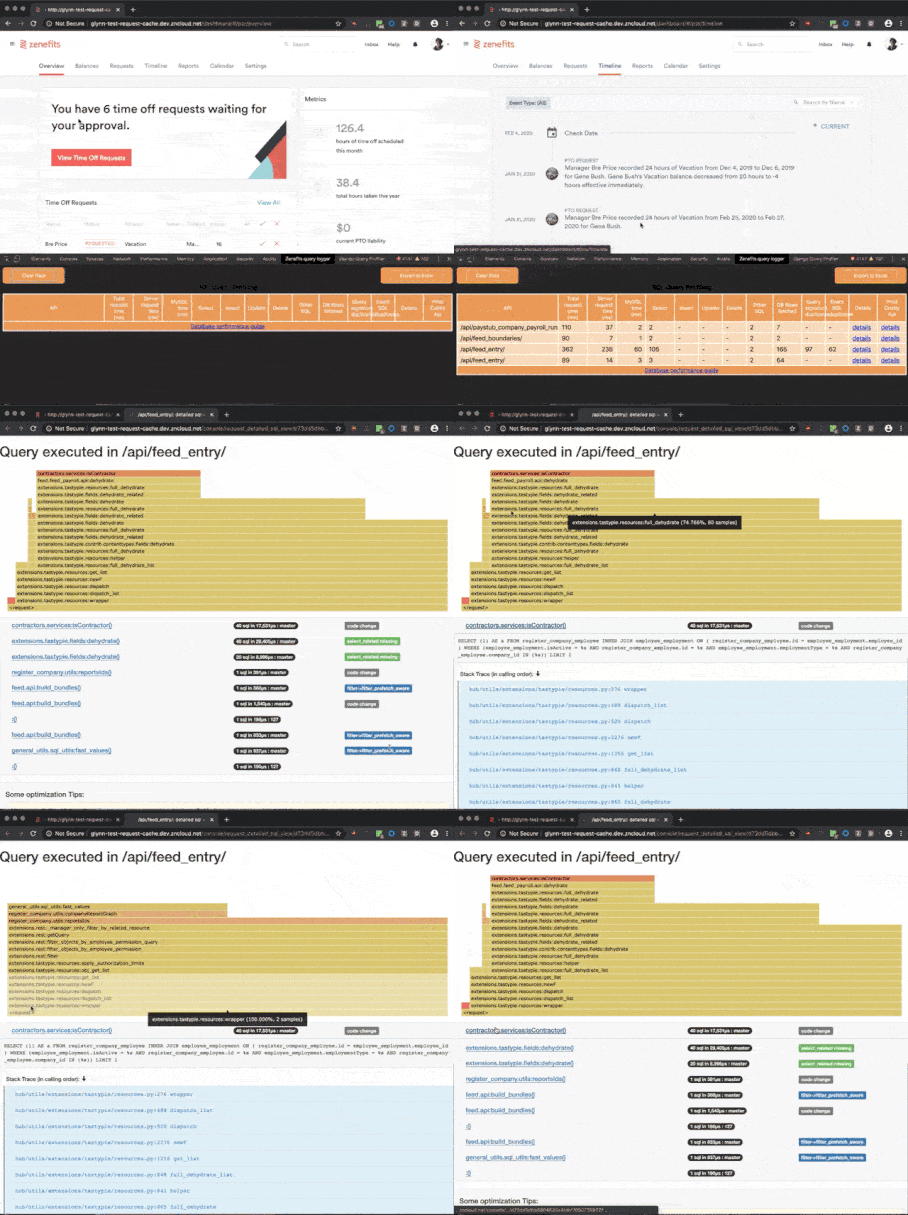
Shows code paths making N+1 sql calls: Shows the sql with stack_trace which is making N+1 calls, along with sql count
Shows the proposed solution: If the solution to reduce sql is to simply apply a select_related or a prefetch_related, this is highlighted as a suggestion
Shows exact sql duplicates: Count of the queries where (sql, parameters) is exactly the same. This is the kind of sql where implementing a query cache would help
Flame Graph visualisation: Collects all the stack traces together to allow quickly identifying which area(s) of code is causing the load to the database
Command line or chrome plugin: The profiler can be called from command line via context manager, or can be invoked via a middleware, and output shown in a chrome plugin
Super easy to configure in any application: The only changes are in settings.py file and in urls.py file
This is the repo for the chrome plugin
Requirements
This works with any version of django >= 2.0, and running on python >= 3.6
Profiler in Action
as a chrome plugin
This image shows how the chrome plugin would display profiled data, once it is configured & installed
on command line
See this file in the PR to see how to use the context manager, and how easy it is to find performance issues :-)
The output of Django query profiler is same for the command line or the chrome plugin. In fact, chrome plugin displays the output set by the middleware - which is just a plain wrapper around context manager.
Getting Started
installation
The simplest way to getting started is to install the django query profiler from pip, and get the chrome plugin from chrome web store.
Python package:
pip install django-query-profilerChrome Plugin:
Download from chrome webstore
This is covered in detail in the installation section in the docs
configuration:
This configuration is when we want to use the profiler along with the chrome plugin. If we want to just use it on the command line, the configuration is much more simpler (two lines of change to settings.py file) - that is covered in the docs
settings.py:
from django_query_profiler.settings import *

INSTALLED_APPS = (
    ...
    'django_query_profiler',
    ...
)

MIDDLEWARE = (
    ...
     # Request and all middleware that come after our middleware, would be profiled
    'django_query_profiler.client.middleware.QueryProfilerMiddleware',
    ...
)

DATABASES = (
    ...
    # Adding django_query_profiler as a prefix to your ENGINE setting
    # Assuming old ENGINE was "django.db.backends.sqlite3", this would be the new one
    "ENGINE": "django_query_profiler.django.db.backends.sqlite3",
)
urls.py:
# Add this line to existing urls.py
path('django_query_profiler/', include('django_query_profiler.client.urls'))
See this PR on how to configure this in your application, and how the plugin is going to look like after your configuration

This is covered in detail in the configuration instructions section in the docs
How the profiler works
This is also covered in detail in the documentation at how the profiler works section in the docs, along with how the code is organized.
The docs also contain references to various links which helped us to lear about internals of Django, and to various projects which helped us to learn on how to add hooks when Django executes a query
Choosing Profiler levels
We have two levels of profiler, and each of them have a different overhead. The two levels are:
QUERY_SIGNATURE: This is the mode where we capture the query as well as the stack-trace. This mode figures out the N+1 code paths and also tells us the proposed solution
QUERY: This is the mode where we just capture queries, and not the stack-trace
On an average, QUERY_SIGNATURE level adds an overhead of 1 millisecond per 7 queries, and QUERY_SIGNATURE adds an overhead of 1 millisecond per 25 queries.
It is simple to change the profiler level for all the requests, or can be configured per request. This is covered in the choosing profiler level section of the docs
Customizing the profiler
We have tried to make the profiler customizable by providing hooks at various points. Some of the use cases are covered here in the customizing the defaults section in docs.
We plan to add more hooks for customizing the profiler as we gather more feedback from real world use cases.
For contributors

The django query profiler is released under the BSD license, like Django itself.
If you like it, please consider contributing! The docs cover everything from how to setup locally, to how the code is organized to running tests.
Documentation
Full documentation is available at readthedocs
1 maintainer

Metadata
1 maintainer
Release files for django-query-profiler 0.9
For a detailed explanation of source distributions (sdists) and built distributions (wheels), please see the package formats documentation.
Source distribution (sdist)
| File | Size | Uploaded | |
|---|---|---|---|
| django-query-profiler-0.9.tar.gz | 38.7 kB | Details |
Built distribution (wheel)
| File | Interpreter | ABI | Platform | Reset |
|---|---|---|---|---|
| django_query_profiler-0.9-py2.py3-none-any.whl | Python 3, Python 2 | none | any | Details |
Total release size: 92.0 kB
Release files / django-query-profiler-0.9.tar.gz
| Download URL | django-query-profiler-0.9.tar.gz |
|---|---|
| Size | 38.7 kB |
| Tags | Source |
|
SHA-256 checksum How to use checksums |
3bfc38b1c883b6616f7e150f75839c7e501c83174d58d1525b77032bb9eebee7
|
|
BLAKE2b-256 checksum How to use checksums |
799905c50f82ec5ae4bf04fb5b763873295203d957bf7f0d7d4e2bb861a6e1dd
|
| Upload date | |
|
Uploaded using Trusted Publishing? What is trusted publishing? |
No |
| Uploaded via |
twine/3.7.1 importlib_metadata/4.10.1 pkginfo/1.8.2 requests/2.27.1 requests-toolbelt/0.9.1 tqdm/4.62.3 CPython/3.9.5
|
Release files / django_query_profiler-0.9-py2.py3-none-any.whl
| Download URL | django_query_profiler-0.9-py2.py3-none-any.whl |
|---|---|
| Size | 53.3 kB |
| Tags | Python 2 Python 3 |
|
SHA-256 checksum How to use checksums |
b1a78c503f817fa657fd0998f7d9fc1d6e3e4c308e0ce6802e8aadc056496bc1
|
|
BLAKE2b-256 checksum How to use checksums |
73addc97362aedf7a379fc5f301dda7f36c80ecb0f6b33100dfc9f7b5bb2c22a
|
| Upload date | |
|
Uploaded using Trusted Publishing? What is trusted publishing? |
No |
| Uploaded via |
twine/3.7.1 importlib_metadata/4.10.1 pkginfo/1.8.2 requests/2.27.1 requests-toolbelt/0.9.1 tqdm/4.62.3 CPython/3.9.5
|














