DoWhy is a Python library for causal inference that supports explicit modeling and testing of causal assumptions
Verified details
These details have been verified by PyPIProject links
GitHub Statistics
Maintainers


Project description


Checkout the documentation
- The documentation, user guide, sample notebooks and other information are available at
DoWhy is part of the PyWhy Ecosystem. For more tools and libraries related to causality, checkout the PyWhy GitHub organization!
For any questions, comments, or discussions about specific use cases, join our community on Discord (
- Jump right into some case studies:
Effect estimation: Hotel booking cancellations | Effect of customer loyalty programs | Optimizing article headlines | Effect of home visits on infant health (IHDP) | Causes of customer churn/attrition
Root cause analysis and explanations: Causal attribution and root-cause analysis of an online shop | Finding the Root Cause of Elevated Latencies in a Microservice Architecture | Finding Root Causes of Changes in a Supply Chain
For more example notebooks, see here!
Introduction & Key Features
Decision-making involves understanding how different variables affect each other and predicting the outcome when some of them are changed to new values. For instance, given an outcome variable, one may be interested in determining how a potential action(s) may affect it, understanding what led to its current value, or simulate what would happen if some variables are changed. Answering such questions requires causal reasoning. DoWhy is a Python library that guides you through the various steps of causal reasoning and provides a unified interface for answering causal questions.
DoWhy provides a wide variety of algorithms for effect estimation, prediction, quantification of causal influences, diagnosis of causal structures, root cause analysis, interventions and counterfactuals. A key feature of DoWhy is its refutation and falsification API that can test causal assumptions for any estimation method, thus making inference more robust and accessible to non-experts.
Graphical Causal Models and Potential Outcomes: Best of both worlds
DoWhy builds on two of the most powerful frameworks for causal inference: graphical causal models and potential outcomes. For effect estimation, it uses graph-based criteria and do-calculus for modeling assumptions and identifying a non-parametric causal effect. For estimation, it switches to methods based primarily on potential outcomes.
For causal questions beyond effect estimation, it uses the power of graphical causal models by modeling the data generation process via explicit causal mechanisms at each node, which, for instance, unlocks capabilities to attribute observed effects to particular variables or estimate point-wise counterfactuals.
For a quick introduction to causal inference, check out amit-sharma/causal-inference-tutorial We also gave a more comprehensive tutorial at the ACM Knowledge Discovery and Data Mining (KDD 2018) conference: causalinference.gitlab.io/kdd-tutorial. For an introduction to the four steps of causal inference and its implications for machine learning, you can access this video tutorial from Microsoft Research DoWhy Webinar and for an introduction to the graphical causal model API, see the PyCon presentation on Root Cause Analysis with DoWhy.
Key Features
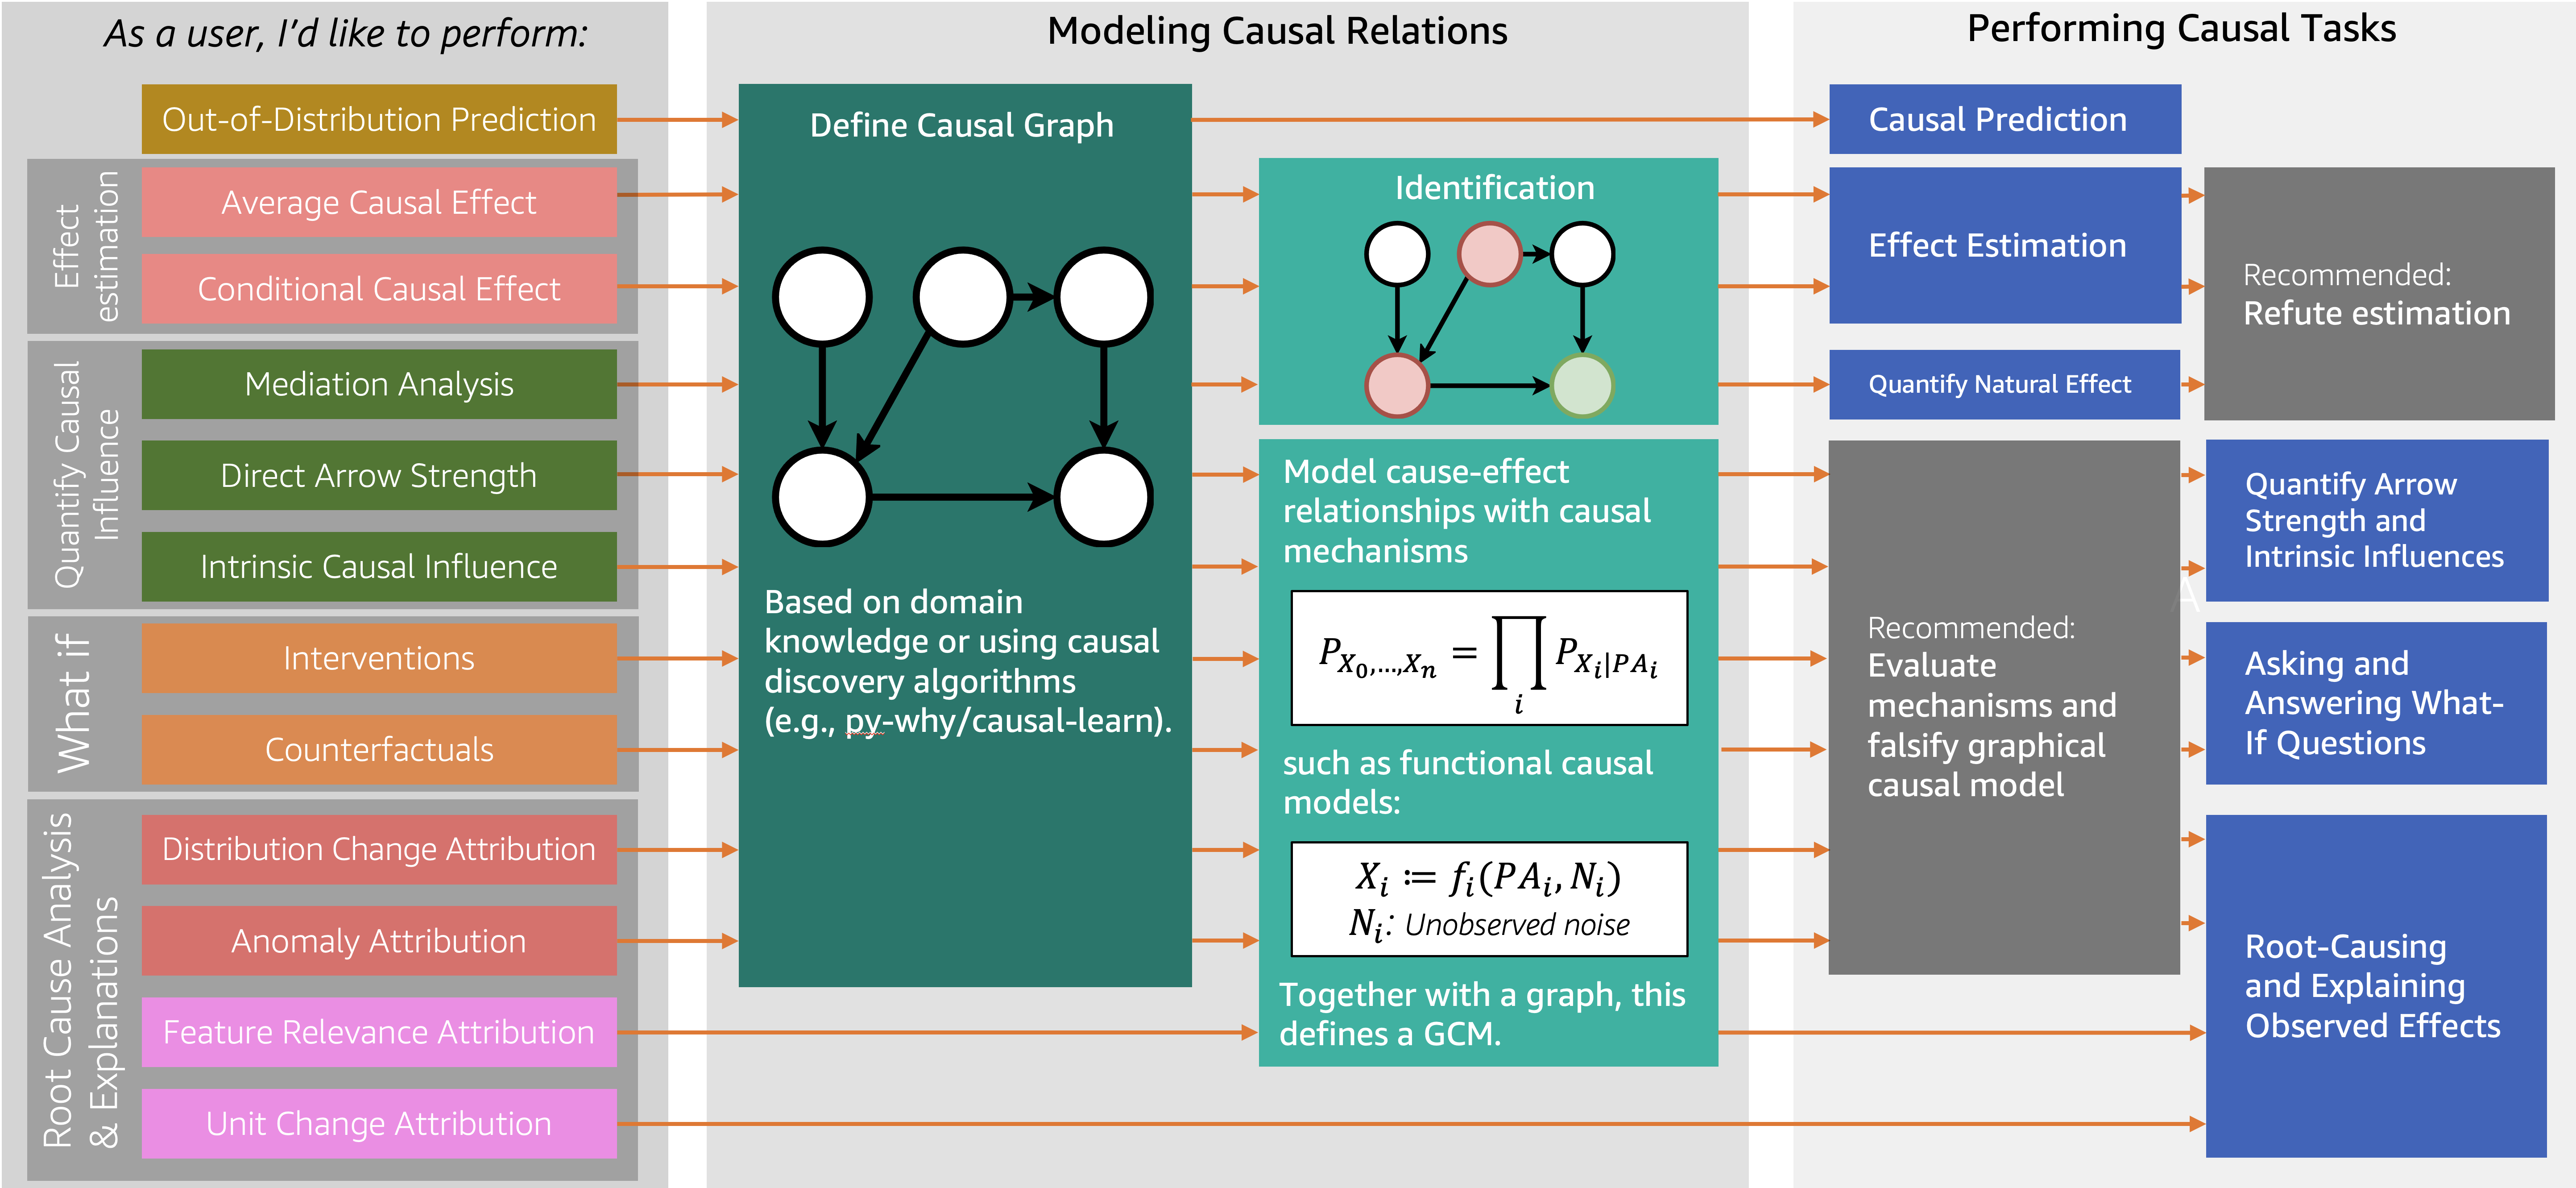
DoWhy supports the following causal tasks:
Effect estimation (identification, average causal effect, conditional average causal effect, instrumental variables and more)
Quantify causal influences (mediation analysis, direct arrow strength, intrinsic causal influence)
What-if analysis (generate samples from interventional distribution, estimate counterfactuals)
Root cause analysis and explanations (attribute anomalies to their causes, find causes for changes in distributions, estimate feature relevance and more)
For more details and how to use these methods in practice, checkout the documentation at https://py-why.github.io/dowhy
Quick Start
DoWhy support Python 3.8+. To install, you can use pip, poetry, or conda.
Latest Release
Install the latest release using pip.
pip install dowhyInstall the latest release using poetry.
poetry add dowhyInstall the latest release using conda.
conda install -c conda-forge dowhyIf you face “Solving environment” problems with conda, then try conda update --all and then install dowhy. If that does not work, then use conda config --set channel_priority false and try to install again. If the problem persists, please add your issue here.
Development Version
If you prefer to use the latest dev version, your dependency management tool will need to point at our GitHub repository.
pip install git+https://github.com/py-why/dowhy@mainRequirements
DoWhy requires a few dependencies. Details on specific versions can be found in pyproject.toml, under the tool.poetry.dependencies section.
If you face any problems, try installing dependencies manually.
pip install '<dependency-name>==<version>'Optionally, if you wish to input graphs in the dot format, then install pydot (or pygraphviz).
For better-looking graphs, you can optionally install pygraphviz. To proceed, first install graphviz and then pygraphviz (on Ubuntu and Ubuntu WSL).
sudo apt install graphviz libgraphviz-dev graphviz-dev pkg-config
pip install --global-option=build_ext \
--global-option="-I/usr/local/include/graphviz/" \
--global-option="-L/usr/local/lib/graphviz" pygraphviz
Example: Effect identification and estimation
Most causal tasks in DoWhy only require a few lines of code to write. Here, we exemplarily estimate the causal effect of a treatment on an outcome variable:
from dowhy import CausalModel
import dowhy.datasets

# Load some sample data
data = dowhy.datasets.linear_dataset(
    beta=10,
    num_common_causes=5,
    num_instruments=2,
    num_samples=10000,
    treatment_is_binary=True)
A causal graph can be defined in different way, but the most common way is via NetworkX. After loading in the data, we use the four main operations for effect estimation in DoWhy: model, identify, estimate and refute:
# I. Create a causal model from the data and given graph.
model = CausalModel(
    data=data["df"],
    treatment=data["treatment_name"],
    outcome=data["outcome_name"],
    graph=data["gml_graph"])  # Or alternatively, as nx.DiGraph

# II. Identify causal effect and return target estimands
identified_estimand = model.identify_effect()

# III. Estimate the target estimand using a statistical method.
estimate = model.estimate_effect(identified_estimand,
                                 method_name="backdoor.propensity_score_matching")

# IV. Refute the obtained estimate using multiple robustness checks.
refute_results = model.refute_estimate(identified_estimand, estimate,
                                       method_name="random_common_cause")
DoWhy stresses on the interpretability of its output. At any point in the analysis, you can inspect the untested assumptions, identified estimands (if any), and the estimate (if any). Here’s a sample output of the linear regression estimator:
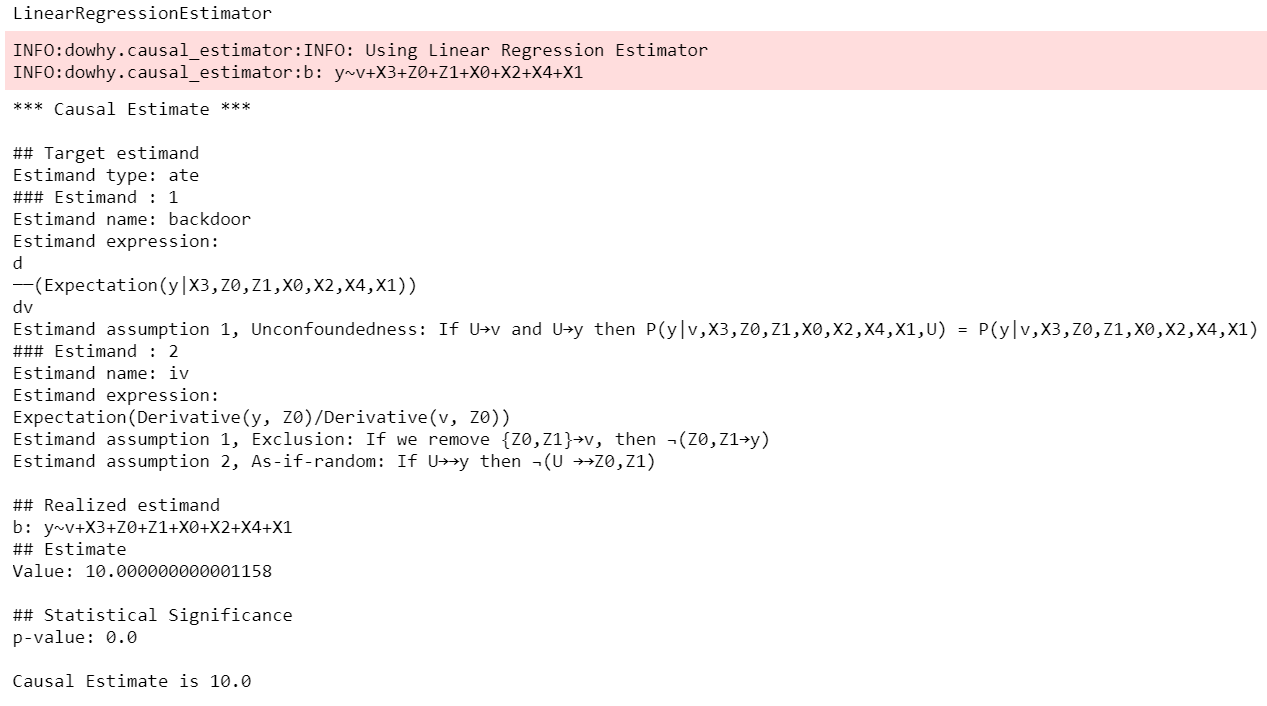
For a full code example, check out the Getting Started with DoWhy notebook.
You can also use Conditional Average Treatment Effect (CATE) estimation methods from EconML, as shown in the Conditional Treatment Effects notebook. Here’s a code snippet.
from sklearn.preprocessing import PolynomialFeatures
from sklearn.linear_model import LassoCV
from sklearn.ensemble import GradientBoostingRegressor
dml_estimate = model.estimate_effect(identified_estimand, method_name="backdoor.econml.dml.DML",
                control_value = 0,
                treatment_value = 1,
                target_units = lambda df: df["X0"]>1,
                confidence_intervals=False,
                method_params={
                    "init_params":{'model_y':GradientBoostingRegressor(),
                                   'model_t': GradientBoostingRegressor(),
                                   'model_final':LassoCV(),
                                   'featurizer':PolynomialFeatures(degree=1, include_bias=True)},
                    "fit_params":{}})
Example: Graphical causal model (GCM) based inference
DoWhy’s graphical causal model framework offers powerful tools to address causal questions beyond effect estimation. It is based on Pearl’s graphical causal model framework and models the causal data generation process of each variable explicitly via causal mechanisms to support a wide range of causal algorithms. For more details, see the book Elements of Causal Inference.
Complex causal queries, such as attributing observed anomalies to nodes in the system, can be performed with just a few lines of code:
import networkx as nx, numpy as np, pandas as pd
from dowhy import gcm

# Let's generate some "normal" data we assume we're given from our problem domain:
X = np.random.normal(loc=0, scale=1, size=1000)
Y = 2 * X + np.random.normal(loc=0, scale=1, size=1000)
Z = 3 * Y + np.random.normal(loc=0, scale=1, size=1000)
data = pd.DataFrame(dict(X=X, Y=Y, Z=Z))

# 1. Modeling cause-effect relationships as a structural causal model
#    (causal graph + functional causal models):
causal_model = gcm.StructuralCausalModel(nx.DiGraph([('X', 'Y'), ('Y', 'Z')]))  # X -> Y -> Z
gcm.auto.assign_causal_mechanisms(causal_model, data)

# 2. Fitting the SCM to the data:
gcm.fit(causal_model, data)

# Optional: Evaluate causal model
print(gcm.evaluate_causal_model(causal_model, data))

# Step 3: Perform a causal analysis.
# results = gcm.<causal_query>(causal_model, ...)
# For instance, root cause analysis:
anomalous_sample = pd.DataFrame(dict(X=[0.1], Y=[6.2], Z=[19]))  # Here, Y is the root cause.

# "Which node is the root cause of the anomaly in Z?":
anomaly_attribution = gcm.attribute_anomalies(causal_model, "Z", anomalous_sample)

# Or sampling from an interventional distribution. Here, under the intervention do(Y := 2).
samples = gcm.interventional_samples(causal_model, interventions={'Y': lambda y: 2}, num_samples_to_draw=100)
The GCM framework offers many more features beyond these examples. For a full code example, check out the Online Shop example notebook.
For more functionalities, example applications of DoWhy and details about the outputs, see the User Guide or checkout Jupyter notebooks.
More Information & Resources
Microsoft Research Blog | Video Tutorial for Effect Estimation | Video Tutorial for Root Cause Analysis | Arxiv Paper | Arxiv Paper (Graphical Causal Model extension) | Slides
Citing this package
If you find DoWhy useful for your work, please cite both of the following two references:
Amit Sharma, Emre Kiciman. DoWhy: An End-to-End Library for Causal Inference. 2020. https://arxiv.org/abs/2011.04216
Patrick Blöbaum, Peter Götz, Kailash Budhathoki, Atalanti A. Mastakouri, Dominik Janzing. DoWhy-GCM: An extension of DoWhy for causal inference in graphical causal models. 2024. MLOSS 25(147):1−7. https://jmlr.org/papers/v25/22-1258.html
Bibtex:
@article{dowhy,
  title={DoWhy: An End-to-End Library for Causal Inference},
  author={Sharma, Amit and Kiciman, Emre},
  journal={arXiv preprint arXiv:2011.04216},
  year={2020}
}

@article{JMLR:v25:22-1258,
author  = {Patrick Bl{{\"o}}baum and Peter G{{\"o}}tz and Kailash Budhathoki and Atalanti A. Mastakouri and Dominik Janzing},
title   = {DoWhy-GCM: An Extension of DoWhy for Causal Inference in Graphical Causal Models},
journal = {Journal of Machine Learning Research},
year    = {2024},
volume  = {25},
number  = {147},
pages   = {1--7},
url     = {http://jmlr.org/papers/v25/22-1258.html}
}
Issues
If you encounter an issue or have a specific request for DoWhy, please raise an issue.
Contributing
This project welcomes contributions and suggestions. For a guide to contributing and a list of all contributors, check out CONTRIBUTING.md and our docs for contributing code. Our contributor code of conduct is available here.
Project details
Verified details
These details have been verified by PyPIProject links
GitHub Statistics
Maintainers
Release history Release notifications | RSS feed


Download files
Download the file for your platform. If you're not sure which to choose, learn more about installing packages.
Source Distribution
Built Distribution
Filter files by name, interpreter, ABI, and platform.
If you're not sure about the file name format, learn more about wheel file names.
Copy a direct link to the current filters
File details
Details for the file dowhy-0.14.tar.gz.
File metadata
- Download URL: dowhy-0.14.tar.gz
- Upload date:
- Size: 13.2 MB
- Tags: Source
- Uploaded using Trusted Publishing? Yes
- Uploaded via: twine/6.1.0 CPython/3.13.7
File hashes
| Algorithm | Hash digest | |
|---|---|---|
| SHA256 |
18f48882bc2cd3452ed3536ae3529a196acfa3b1e21b8978b71934e65cabb665
|
|
| MD5 |
34a59b47ad32509febe81bdcde816c1f
|
|
| BLAKE2b-256 |
251f85ab41e0deb64c01590b05c15c9f302040d25340ae82e5117cb93cd89e2b
|
Provenance
The following attestation bundles were made for dowhy-0.14.tar.gz:
Publisher:
python-publish.yml on py-why/dowhy
-
Statement:
-
Statement type:
https://in-toto.io/Statement/v1 -
Predicate type:
https://docs.pypi.org/attestations/publish/v1 -
Subject name:
dowhy-0.14.tar.gz -
Subject digest:
18f48882bc2cd3452ed3536ae3529a196acfa3b1e21b8978b71934e65cabb665 - Sigstore transparency entry: 684515190
- Sigstore integration time:
-
Permalink:
py-why/dowhy@178ecc9c690a02f2801c1f70da2695f5744186cc -
Branch / Tag:
refs/tags/v0.14 - Owner: https://github.com/py-why
-
Access:
public
-
Token Issuer:
https://token.actions.githubusercontent.com -
Runner Environment:
github-hosted -
Publication workflow:
python-publish.yml@178ecc9c690a02f2801c1f70da2695f5744186cc -
Trigger Event:
release
-
Statement type:
File details
Details for the file dowhy-0.14-py3-none-any.whl.
File metadata
- Download URL: dowhy-0.14-py3-none-any.whl
- Upload date:
- Size: 403.1 kB
- Tags: Python 3
- Uploaded using Trusted Publishing? Yes
- Uploaded via: twine/6.1.0 CPython/3.13.7
File hashes
| Algorithm | Hash digest | |
|---|---|---|
| SHA256 |
9c5855d80601e0feb2d0d232c19e7b660db4cd0ea04ace2ebaefcdb3599ab9db
|
|
| MD5 |
5e9e895dbe75697b79a8816b11464448
|
|
| BLAKE2b-256 |
31e9f07767b26916e5b6548e9892f87d7d77767b3a86d22e934f7c745ac4e270
|
Provenance
The following attestation bundles were made for dowhy-0.14-py3-none-any.whl:
Publisher:
python-publish.yml on py-why/dowhy
-
Statement:
-
Statement type:
https://in-toto.io/Statement/v1 -
Predicate type:
https://docs.pypi.org/attestations/publish/v1 -
Subject name:
dowhy-0.14-py3-none-any.whl -
Subject digest:
9c5855d80601e0feb2d0d232c19e7b660db4cd0ea04ace2ebaefcdb3599ab9db - Sigstore transparency entry: 684515213
- Sigstore integration time:
-
Permalink:
py-why/dowhy@178ecc9c690a02f2801c1f70da2695f5744186cc -
Branch / Tag:
refs/tags/v0.14 - Owner: https://github.com/py-why
-
Access:
public
-
Token Issuer:
https://token.actions.githubusercontent.com -
Runner Environment:
github-hosted -
Publication workflow:
python-publish.yml@178ecc9c690a02f2801c1f70da2695f5744186cc -
Trigger Event:
release
-
Statement type:


