Clean draw of rectangle and polygon contours
Project description
Drawline
Say goodbye to endless searching and trial-and-error with image overlays! Drawline makes it effortless to overlay polyggon contours, rectangles and even auto-handles label colors, font size and line thickness. With the option to override, Drawline takes the hassle out of image drawing customization
Install
pip install drawline
Screenshots
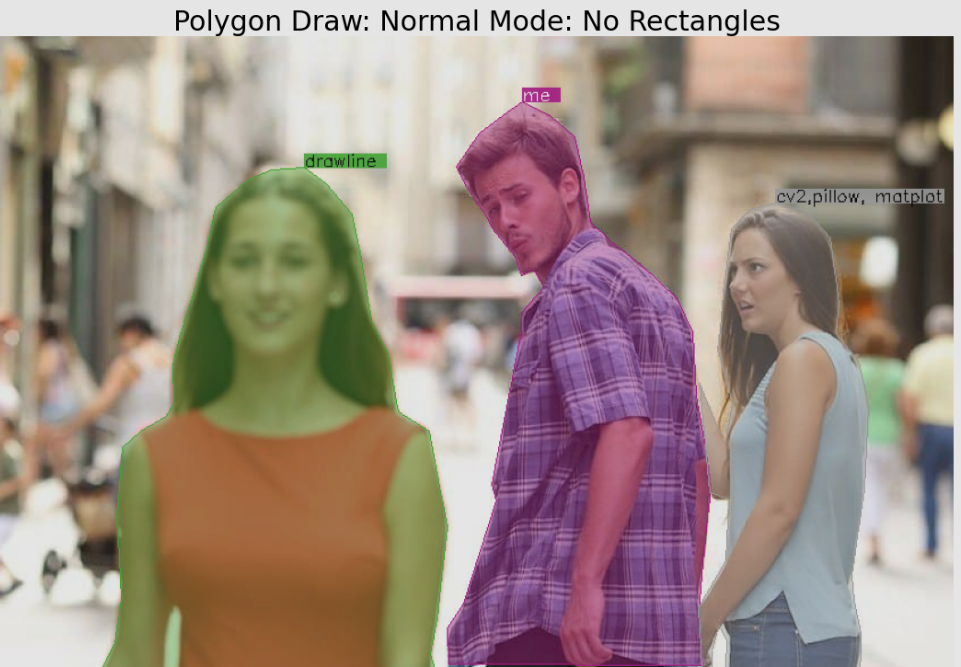
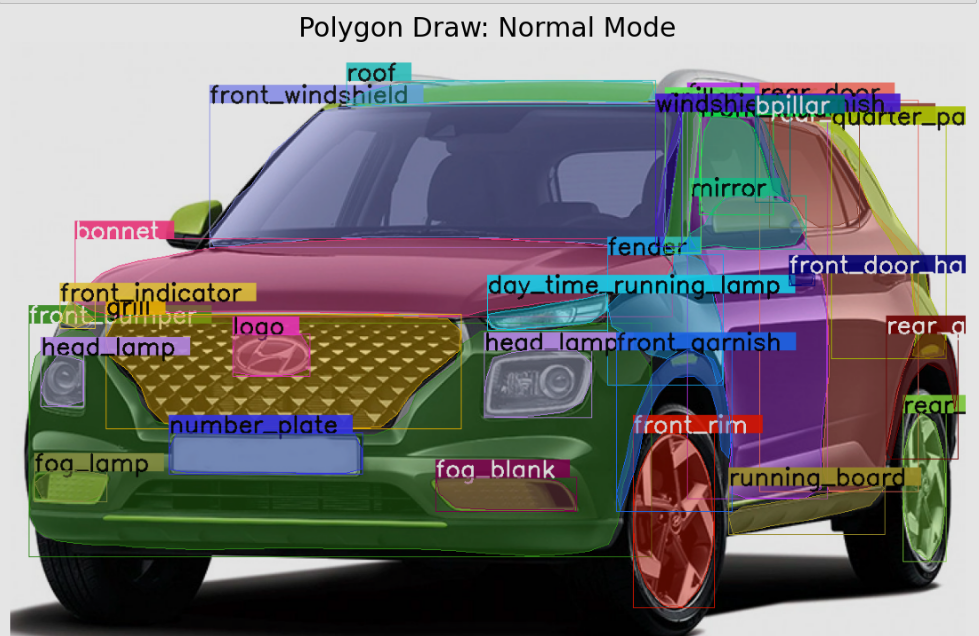
- Polygon draw (Normal mode): Good to use when there are less number of polygons to draw.

# Go to 'How to Use' section for detail code
result_image = draw_poly(image, {YOUR_CONTOURS}, label={YOUR_LABELS}, graph_mode=False, show_rect=False)
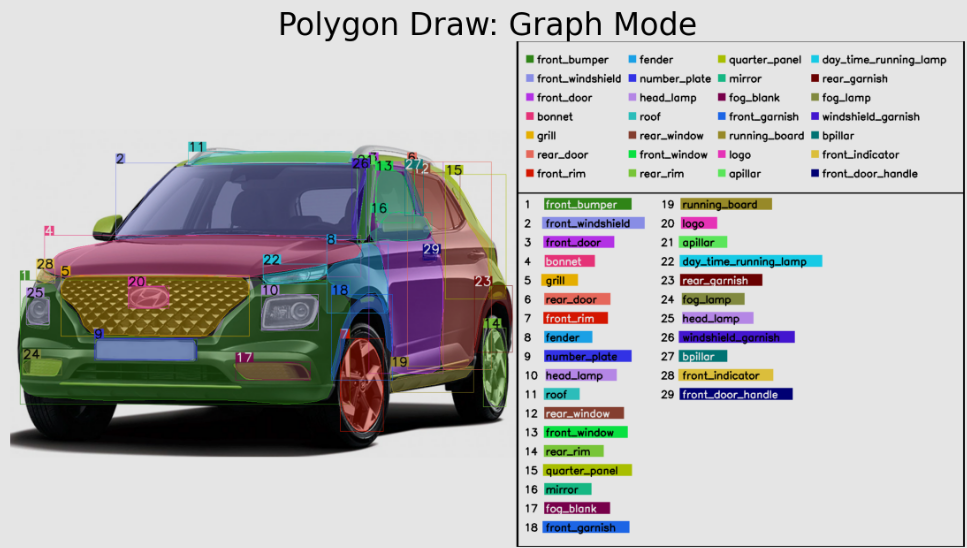
- Polygon draw (Graph mode): Good to use when there are many number of polygons to draw. Overcomes the overlay labels problem.


# Go to 'How to Use' section for detail code
result_image = draw_poly(image, {YOUR_CONTOURS}, label={YOUR_LABELS}, graph_mode=True)
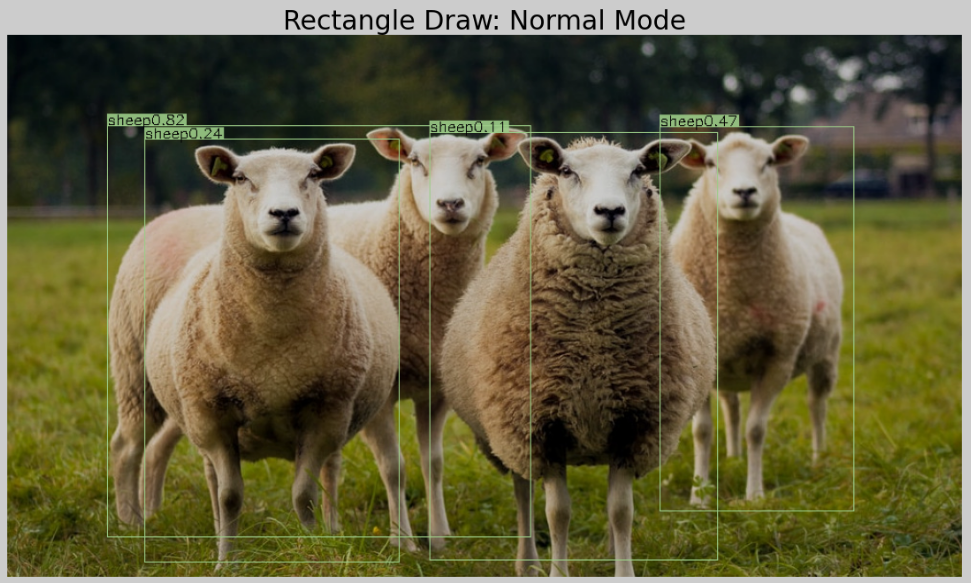
- Rectangle draw (normal mode): You can also simlpy draw a rectangle instead of polygon.

# Go to 'How to Use' section for detail code
result_image = draw_rect(image, {YOUR_RECTANGLE_COORDINATES}, label={YOUR_LABELS})
How to use
Checkout the example: Notebook Example (NB viewer) or Github Viewer
OR
from drawline import draw_poly, draw_rect
import cv2

img_pth = '/PATH/TO/IMAGE.jpg'
image = cv2.imread(img_pth)

# Single  Rectangle example
result_image = draw_rect(image, [XMIN, YMIN, XMAX, YMAX], labels='label_1')

# Multiple Rectangles example
result_image = draw_rect(image,
                         [[XMIN_1, YMIN_1, XMAX_1, YMAX_1],
                          [XMIN_2, YMIN_2, XMAX_2, YMAX_2]],
                         labels=['Label_1', 'Label_2'])


# Single Contours Polygon example
result_image = draw_poly(image, CONTOUR, label='label_1')

# Multiple Contours Polygon points
result_image = draw_poly(image, CONTOURS, label=['label_1', 'label_2', ...])

# Assigning Labels is optional, if not given no label name will be displayed
Default options
def draw_rect(image, points, rgb=None, label_transparency=0.1, thickness=None, labels=None,
              label_rgb=None, label_bg_rgb=None, label_font_size=None,
              random_color=False, graph_mode=False):
    """
    Draws rectangle from given coordinates
    :param image: (Numpy) numpy matrix image
    :param points: (List) List of rectangle coordinates: [[xmin, ymin, xmax, ymax]]
    :param rgb: (Tuple) RGB values: (R, G, B)
    :param label_transparency: (float) transparency for the labels
    :param thickness: (Integer) of line in px: eg: 2
    :param labels: (List) list of strings: []
    :param label_rgb: (Tuple) RGB text color for labels: (R,G,B)
    :param label_bg_rgb: (Tuple) RGB label background color: (R,G,B)
    :param label_font_size: (Integer) Font size of label in px: 2
    :param random_color: (Boolean) pick random colors for lines.
    :param graph_mode: (Boolean) Writes labels to a border instead in the image itself (Good to use when to many boxes
     obstructing the view)

    :return: (numpy) drawn rectangles on image
    """


def draw_poly(image, contours, fill_in=True, label_transparency=0.1, fill_transparency=0.4, rgb=None, thickness=None,
              show_rect=True, labels=None, label_rgb=None, label_bg_rgb=None, label_font_size=None, random_color=False,
              graph_mode=False):
    """
    Draws polygon and fills in color from given contours
    :param image: (Numpy) numpy matrix image
    :param contours: (List) of contours
    :param fill_in: (Boolean) fill color inside the polygon.
    :param label_transparency: (float) transparency for the labels
    :param fill_transparency: (Float) transparency of fill_in color.
    :param rgb: RGB values: (Tuple) rgb color of line and polyfgon (R, G, B)
    :param thickness: (Int) Thickness of line
    :param show_rect: (Boolean) Show rectangle
    :param labels: (List of strings) List of label names
    :param label_rgb: (Tuple) RGB color of labels
    :param label_bg_rgb: (Tuple) RGB color of Label background
    :param label_font_size: (Int) Label font size
    :param random_color: (Boolean) Randomize RGB color
    :param graph_mode: (Boolean) Writes labels to a border instead in the image itself (Good to use when to many boxes
     obstructing the view)

    :return: (Numpy) drawn polygon on image
    """
Project details
Download files
Download the file for your platform. If you're not sure which to choose, learn more about installing packages.
Source Distribution
drawline-0.3.4.tar.gz
(12.6 kB
view details)
Built Distribution
drawline-0.3.4-py3-none-any.whl
(13.2 kB
view details)
File details
Details for the file drawline-0.3.4.tar.gz.
File metadata
- Download URL: drawline-0.3.4.tar.gz
- Upload date:
- Size: 12.6 kB
- Tags: Source
- Uploaded using Trusted Publishing? No
- Uploaded via: twine/4.0.2 CPython/3.9.12
File hashes
| Algorithm | Hash digest | |
|---|---|---|
| SHA256 |
eb8d3d0d8208be3889bfeda4f7241b1fd258df34b397f0e3254a40dd7554a98e
|
|
| MD5 |
9716c32f122fcc3c7b67895b1dc15307
|
|
| BLAKE2b-256 |
5a101f1df0aa4487be4a55f464c0b7e8ebcd569455589e9bddb51e9e6b88da16
|
File details
Details for the file drawline-0.3.4-py3-none-any.whl.
File metadata
- Download URL: drawline-0.3.4-py3-none-any.whl
- Upload date:
- Size: 13.2 kB
- Tags: Python 3
- Uploaded using Trusted Publishing? No
- Uploaded via: twine/4.0.2 CPython/3.9.12
File hashes
| Algorithm | Hash digest | |
|---|---|---|
| SHA256 |
55e9814a94dbb1a1ed32fee1844b8570126339bdd2d1787bc65c643d572e8021
|
|
| MD5 |
b74075983e21a03e40ee914d622c7b4b
|
|
| BLAKE2b-256 |
2edec610bfe0cd10fd9e5a9f8155f9a90950dfab17c21b86acfd7dea755498cc
|


