Simple DICOM tag editor built with wxPython and pydicom
Project description

DVHA Stats
A library of prediction and statistical process control tools. Although based on work in DVH Analytics, all tools in this library are generic and not specifically applicable to any one field.


What does it do?
- Read data from CSV or supply as numpy array
- Plotting
- Simple one-variable plots from data
- Control Charts
- Multivariate Control Charts
- Perform Box-Cox transformations
- Calculate Pearson-R correlation matrices
- Perform Multi-Variable Linear Regressions
Coming Soon:
- PyPI installation
- Multi-Variable Regression plots
- Backward-elimination for Multi-Variable Linear Regressions
- Risk-Adjusted Control Charts using Multi-Variable Linear Regressions
- Machine learning regressions based on scikit-learn
- Complete unit testing
NOTE: This project is brand new and very much under construction.
Source-Code Installation
pip install git+https://github.com/cutright/DVHA-Stats.git
Or clone the project and run:
python setup.py install
Dependencies
Initialize and Plot Data
>>> from dvhastats.stats import DVHAStats
>>> s = DVHAStats("tests/testdata/multivariate_data.csv")
>>> s.get_data_by_var_name('V1')
array([56.5, 48.1, 48.3, 65.1, 47.1, 49.9, 49.5, 48.9, 35.5, 44.5, 40.3,
       43.5, 43.7, 47.5, 39.9, 42.9, 37.9, 48.7, 41.3, 47.1, 35.9, 46.5,
       45.1, 24.3, 43.5, 45.1, 46.3, 41.1, 35.5, 41.1, 37.3, 42.1, 47.1,
       46.5, 43.3, 45.9, 39.5, 50.9, 44.1, 40.1, 45.7, 20.3, 46.1, 43.7,
       43.9, 36.5, 45.9, 48.9, 44.7, 38.1,  6.1,  5.5, 45.1, 46.5, 48.9,
       48.1, 45.7, 57.1, 35.1, 46.5, 29.5, 41.5, 53.3, 45.3, 41.9, 45.9,
       43.1, 43.9, 46.1])

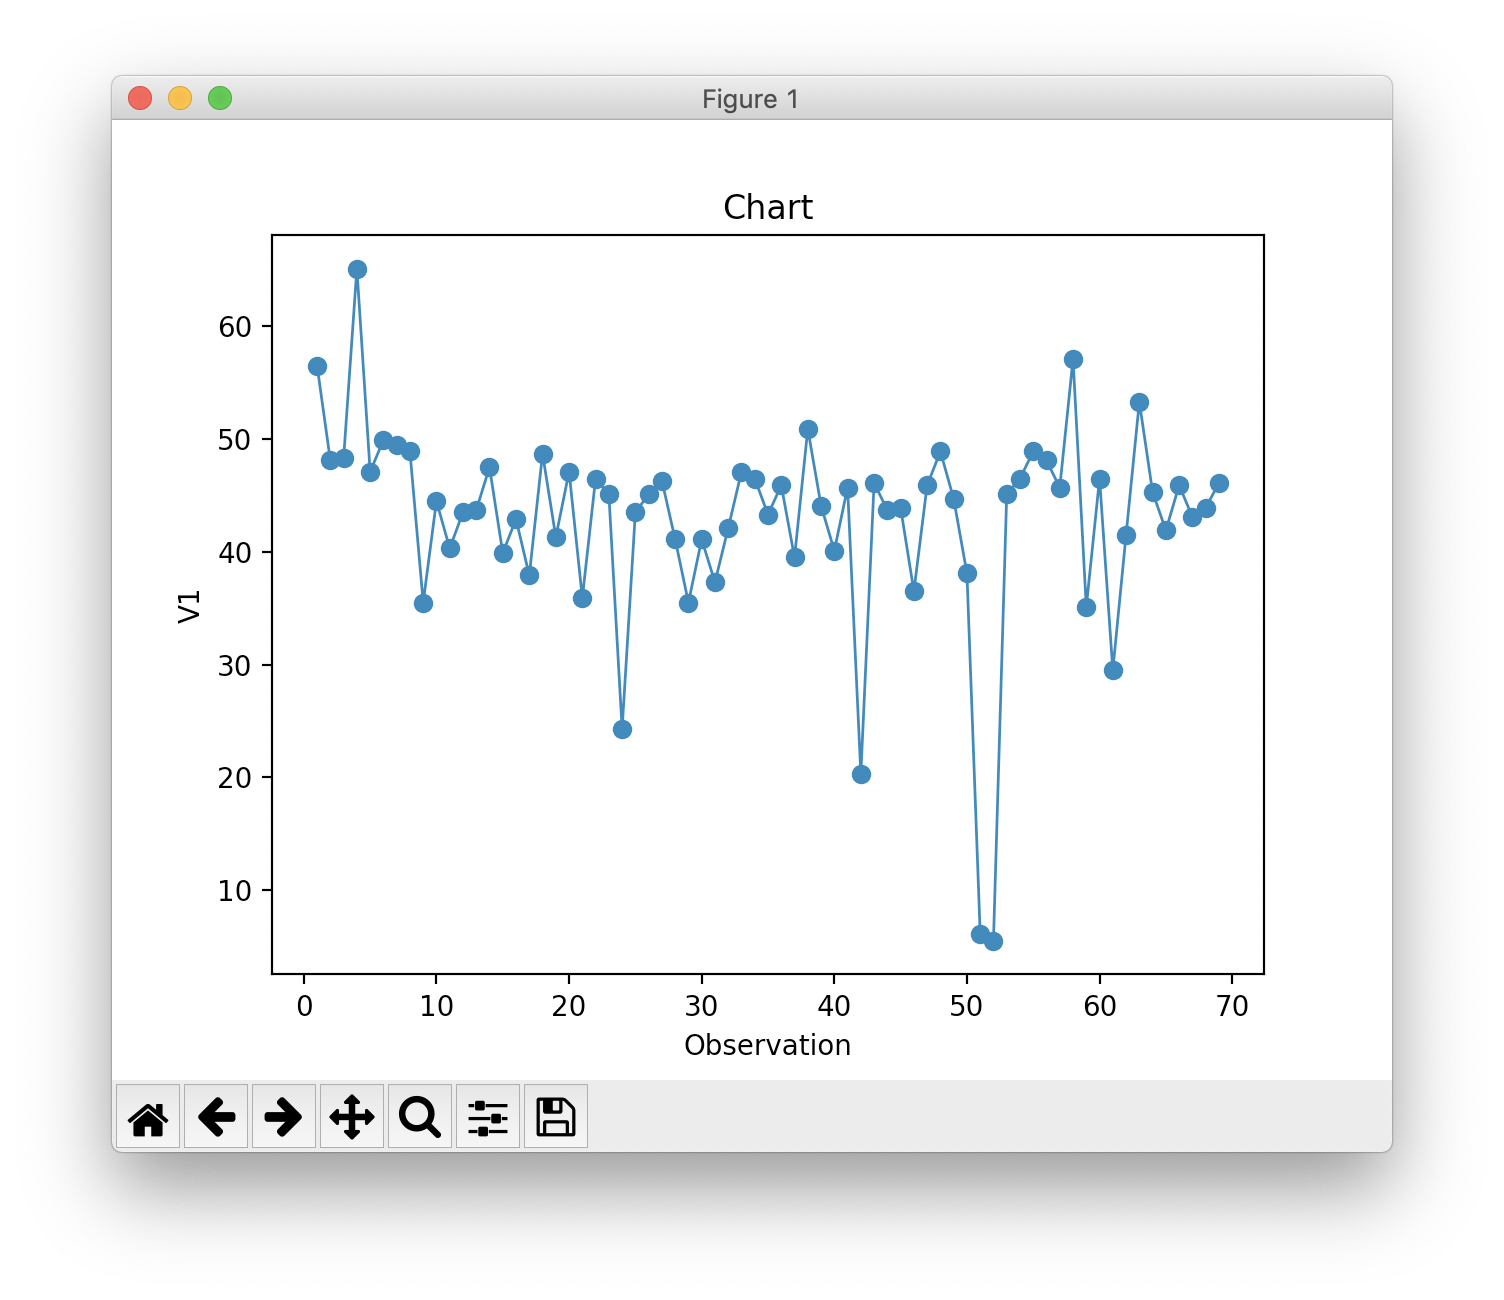
>>> s.show('V1')  # or s.show(0), can provide index or var_name

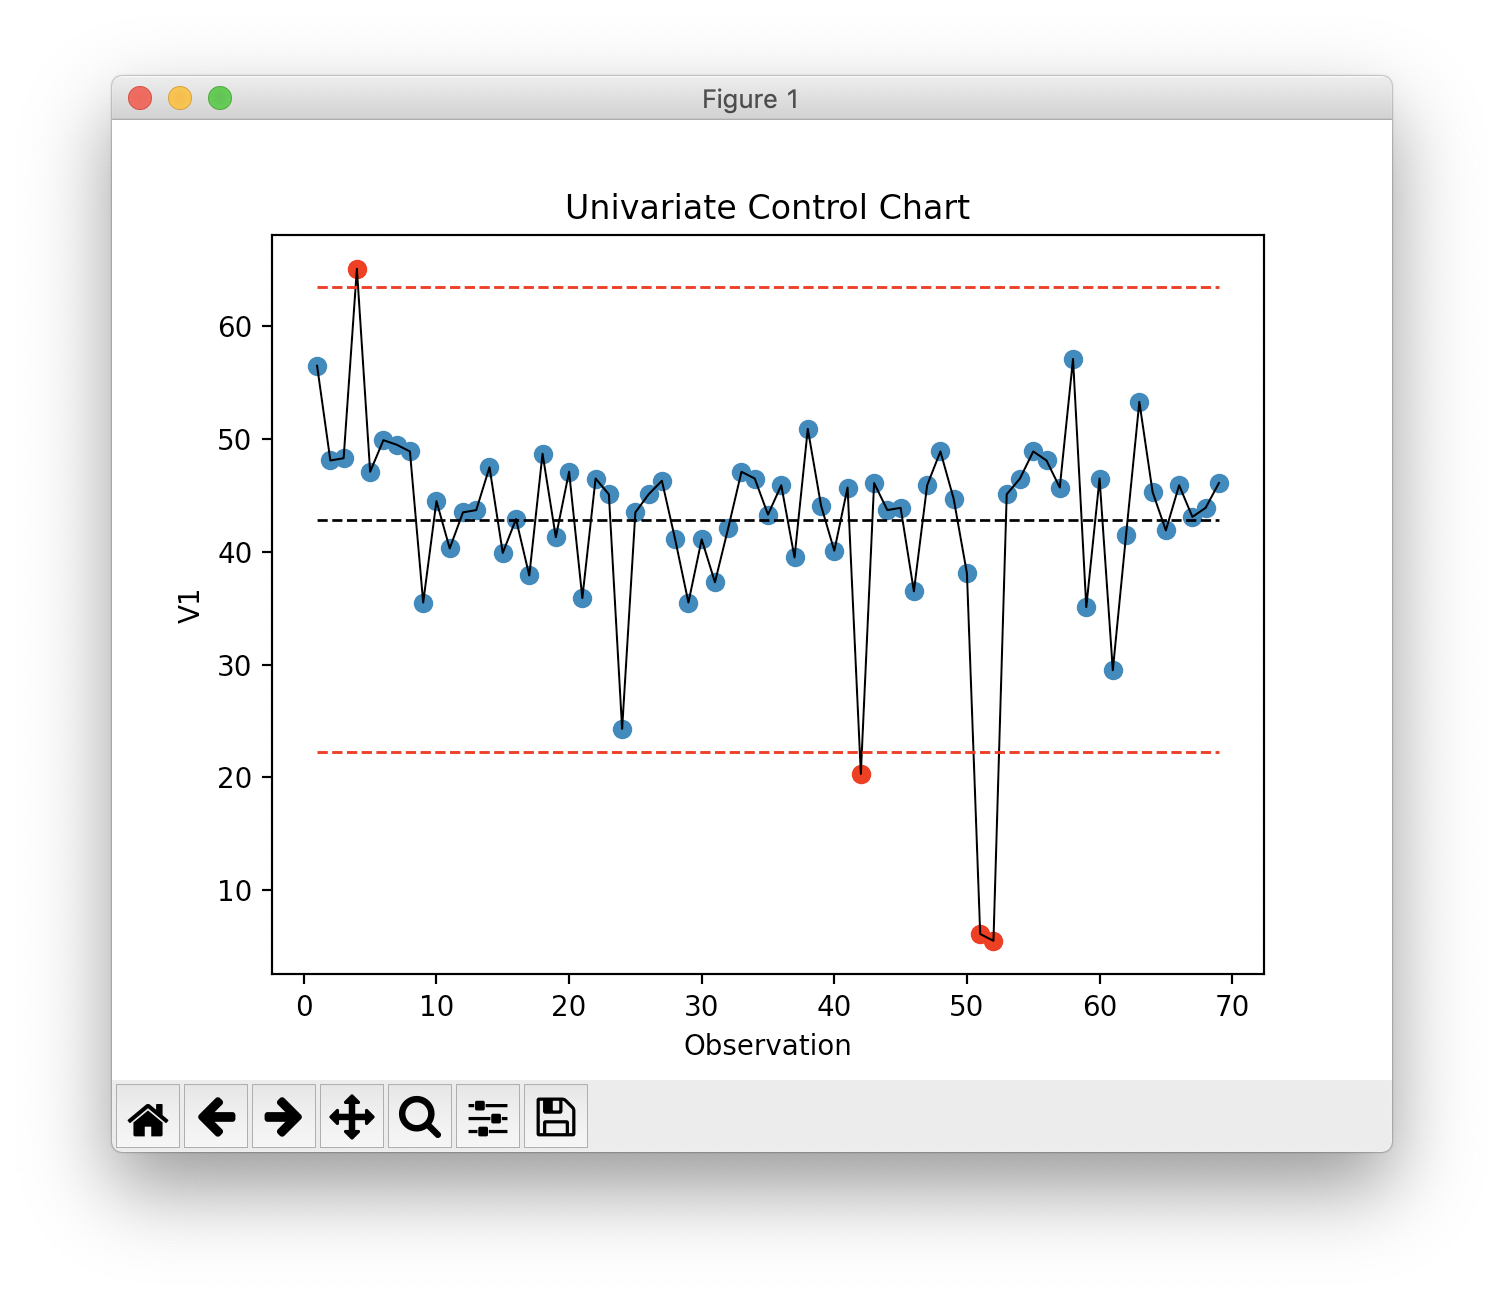
Univariate Control Chart
>>> ucc = s.univariate_control_charts()
>>> print(ucc.keys())
dict_keys(['V1', 'V2', 'V3', 'V4', 'V5', 'V6'])

>>> print(uni_cc['V1'])
center_line: 42.845
control_limits: 22.210, 63.480
out_of_control: [ 3 41 50 51]

ucc["V1"].show()  # or ucc[0].show(), can provide index or var_name

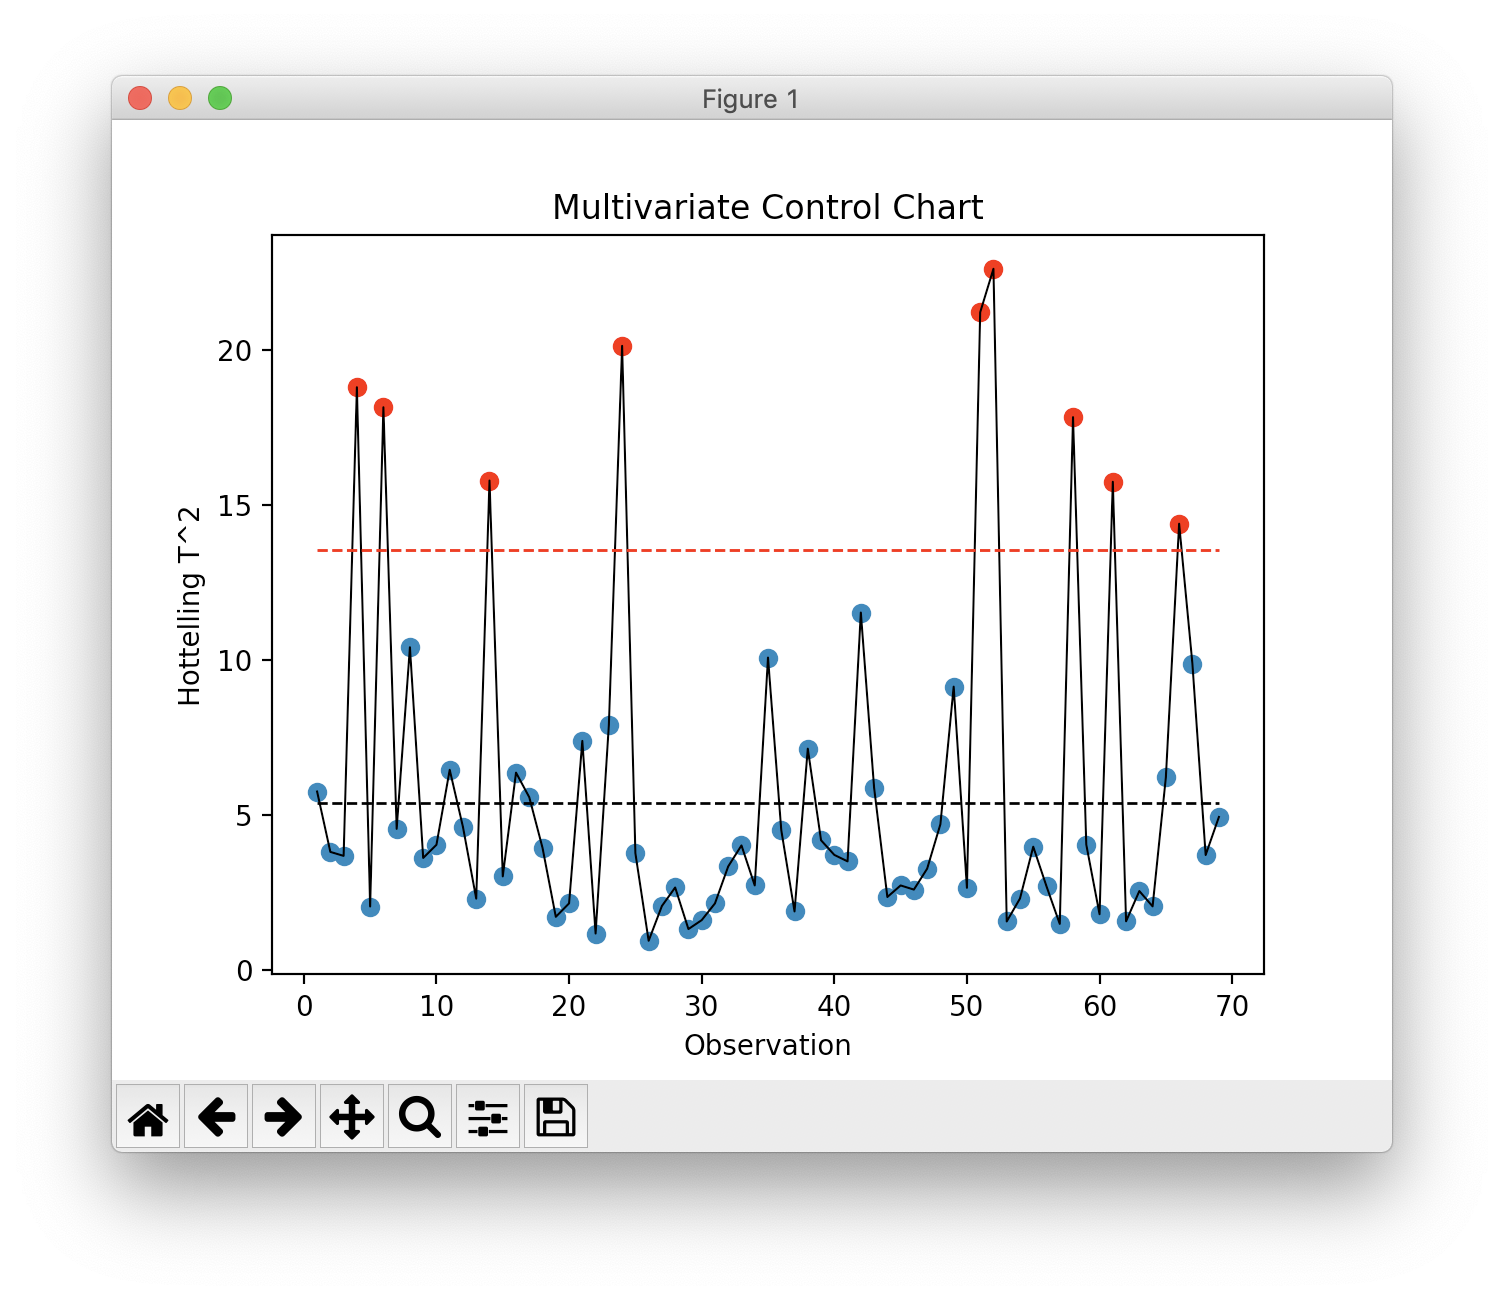
Hotelling T^2
Example to calculate the Hotelling T^2 values from a csv file
>>> ht2 = s.hotelling_t2()
>>> print(ht2)
Q: [ 5.75062092  3.80141786  3.67243782 18.80124504  2.03849294 18.15447155
  4.54475048 10.40783971  3.60614333  4.03138994  6.45171623  4.60475303
  2.29185301 15.7891342   3.0102578   6.36058098  5.56477106  3.92950273
  1.70534379  2.14021007  7.3839626   1.16554558  7.89636669 20.13613585
  3.76034723  0.93179106  2.05542886  2.65257506  1.31049764  1.59880892
  2.13839258  3.33331329  4.01060102  2.71837612 10.0744586   4.50776545
  1.87955428  7.13423455  4.1773818   3.70446025  3.49570988 11.52822658
  5.874624    2.34515306  2.71884639  2.58457841  3.2591779   4.69554484
  9.1358149   2.64106059 21.21960037 22.6229493   1.55545875  2.29606726
  3.96926714  2.69041382  1.47639788 17.83532339  4.03627833  1.78953536
 15.7485067   1.56110637  2.53753085  2.04243193  6.20630748 14.39527077
  9.88243129  3.70056854  4.92888799]
center_line: 5.375
control_limits: 0, 13.555
out_of_control: [ 3  5 13 23 50 51 57 60 65]

>>> ht2.show()

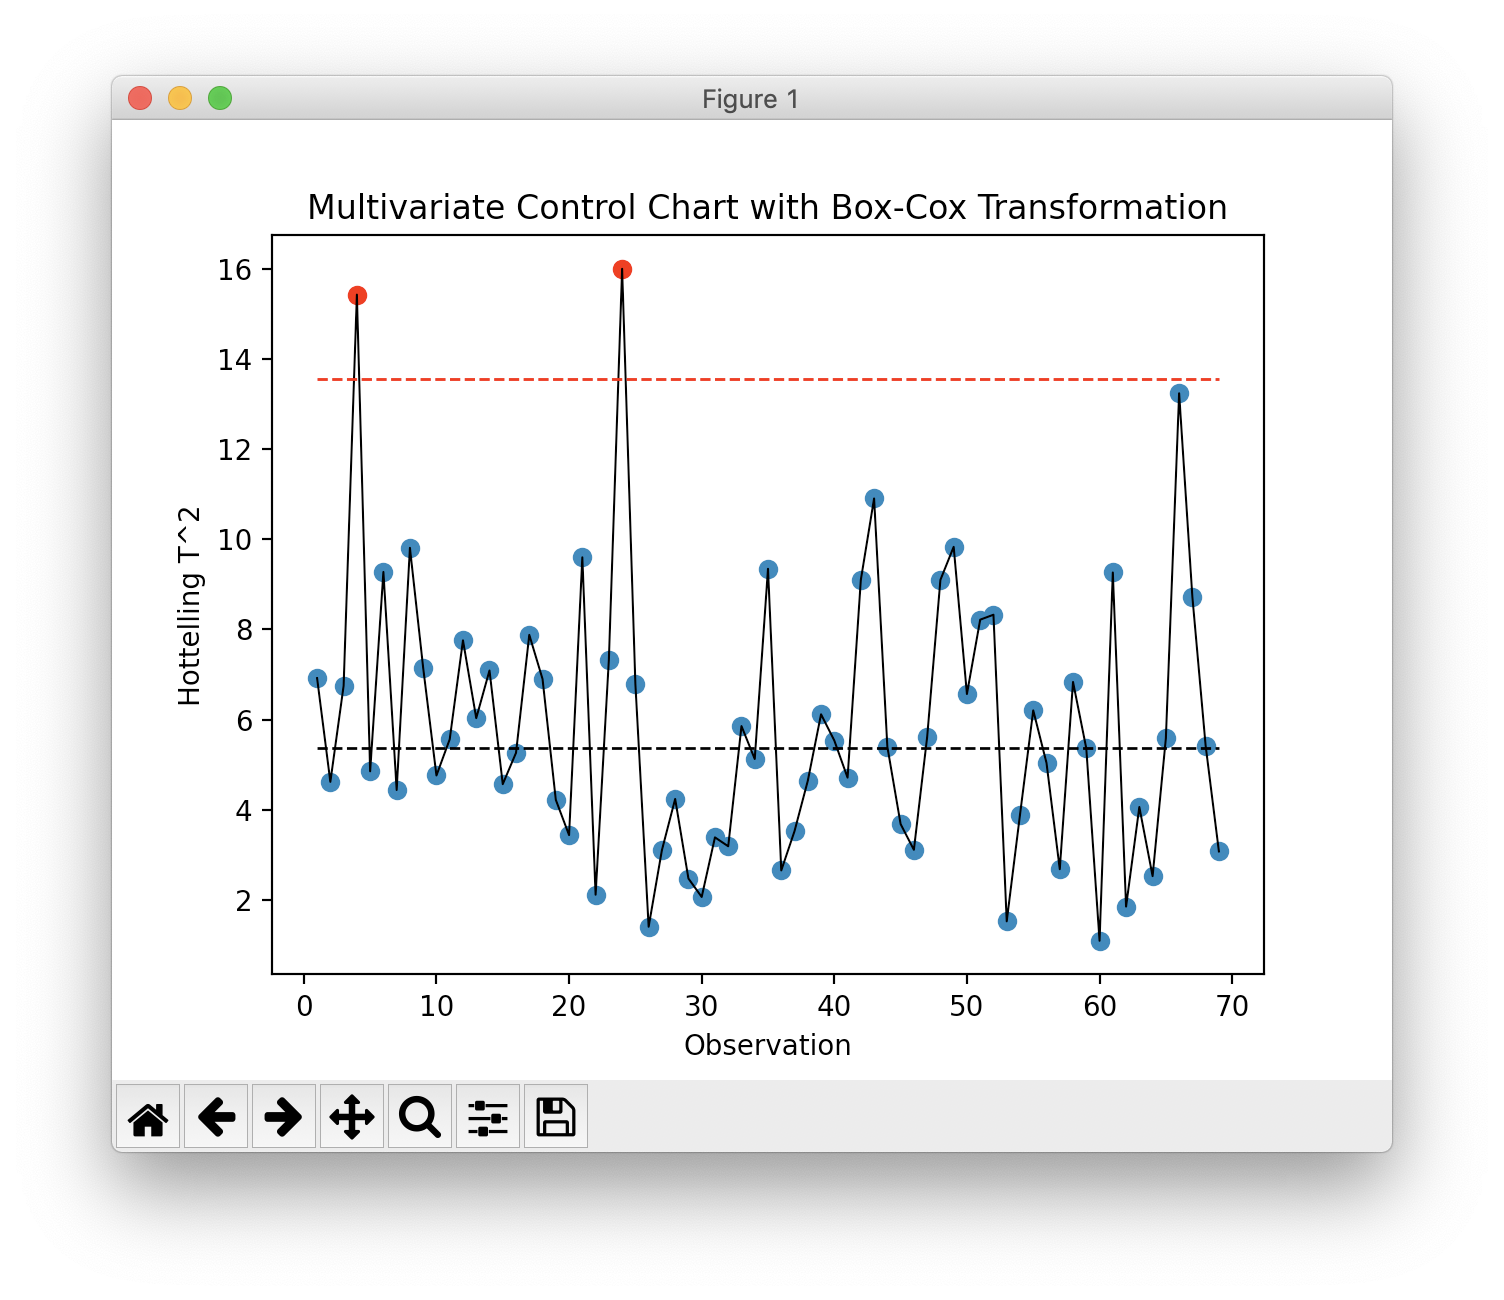
Hotelling T^2 with Box-Cox Transformation
Example to calculate the Hotelling T^2 values and apply a Box-Cox transformation
>>> ht2_bc = s.hotelling_t2(box_cox=True)
>>> ht2_bc.show()

Project details
Release history Release notifications | RSS feed
Download files
Download the file for your platform. If you're not sure which to choose, learn more about installing packages.
Source Distribution
dvha-stats-0.1.0.tar.gz
(15.8 kB
view hashes)
Built Distributions
dvha_stats-0.1.0-py3.7.egg
(25.4 kB
view hashes)
dvha_stats-0.1.0-py3-none-any.whl
(13.6 kB
view hashes)
Close
Hashes for dvha_stats-0.1.0-py3-none-any.whl
| Algorithm | Hash digest | |
|---|---|---|
| SHA256 | d2a8adee5f7c2c7ac26d56725bf6897507e29b32afa38547f9f48e4ffb9974ef |
|
| MD5 | fb16c725af3511fb90d557171e9dbf7e |
|
| BLAKE2b-256 | baed140c535ff3900751581d79fab98f5c60ce623bac00b9ab3e981184531dce |


