Embeddable AI and State-based Understandable Logic toolkit

Project description

EASUL

Note We do not recommend that EASUL is used in production projects in its current state. This documentation is still in progress and we will continue to add and update it over the coming months.
What is EASUL?
It is the Embeddable AI and State-based Understandable Logic toolkit. A data-driven framework targeted at clinical decision support applications. EASUL makes it simple and straightforward to create data-driven plans and 'drive' them or utilise them in your own tools and systems. It has a number of features which make this easier:
- Generalisable, shareable and re-usable data-driven plans describing the data sources, steps, algorithms and states
- Embeddable directly into Python scripts, Jupyter notebooks or as part of an engine
- Extensible to support new plan types, visual elements, data sources, step types, states, actions, algorithms and comparisons
- Algorithmic support for simple logic tests, to compound scores (e.g. clinical risk scores) or machine learning / artificial intelligence models
- human-understandable and interpretable visual elements and state-based outputs which can be embedded into other tools.
- Multi-modal data sources support include simple files and databases, but also real-time data feeds through the data broker with in-built data processing
- Improved performance through model and prediction metadata pre-calculation
- Inbuilt data validation, conversion and encoding/decoding of input data
- Visual elements to help explain processes/workflows, models and their predictions using standard model metrics and
- more recently created interpretability measures (e.g. LIME)
If I use EASUL in my research project which source should I cite?
Please cite our pre-print in arxiv which describes the framework and our evaluation of its application to clinical decision support in pneumonia.
How do I install and use EASUL?
You should be able to use pip to install EASUL. You may want to do this within a Python virtual environment.
pip install easul
You will need to use a Jupyter notebook to run the examples as this will allow visualisations. EASUL comes with an example plan and data sets which can be used to explore its features:
from easul.notebook import *
from easul.examples import create_example_plan

plan = create_example_plan()
visualise_plan(plan, use_external=True)
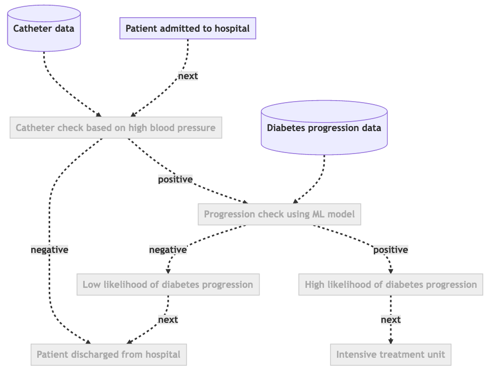
As you can see the plan consists of a number of steps connected together by decisions. The decisions are driven by data sources and algorithms. You can send some data into the plan to get the resulting patient journey:
...
visualise_run(plan, {"catheter": {"systolic_bp": 120},
                     "progression": {"age": 59, "sex": 2, "bmi": 32.1, "bp": 101, "s1": 157, "s2": 93.2, "s3": 38,
                                     "s4": 4, "s5": 4.9, "s6": 87}
                     }, use_external=True)
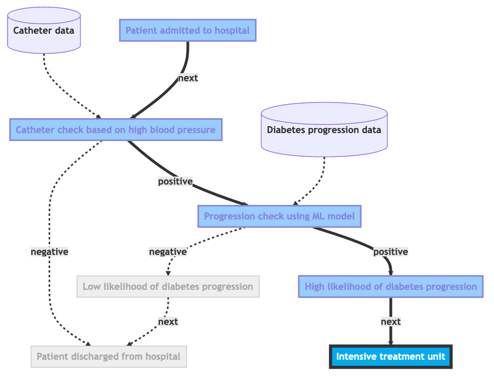
You will now get a new version of the workflow which shows the patient journey resulting if this data is used. You can try using different data to get different patient journeys.
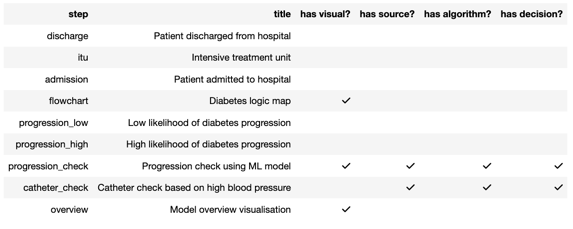
You can then look at plans in more detail to determine what steps they have and whether they have specific components or not (e.g. data sources, visuals, algorithms and decisions):
describe_plan(plan)
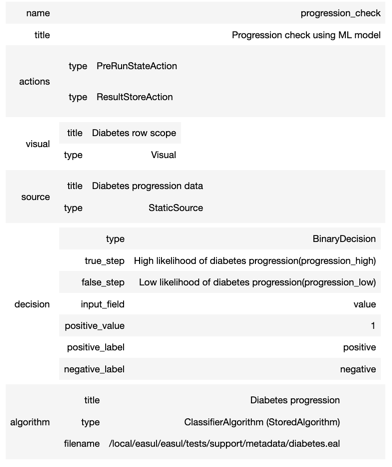
And with that knowledge look at an individual step in more detail to look at the components in more detail:
describe_step("progression_check", plan)
You can also simulate a decision obtained from a specific step and get results (and if defined, visualisations) by running data through a specific step.
To get the step results of the simulation:
simulate_decision("progression_check",plan, {"progression": {"age": 59, "sex": 2, "bmi": 32.1, "bp": 101, "s1": 157, "s2": 93.2, "s3": 38,
                                     "s4": 4, "s5": 4.9, "s6": 87}}, as_data=True)
{'outcome_step': 'progression_check',
 'next_step': 'progression_high',
 'reason': 'positive',
 'result': {'value': 1,
  'label': 'Progression',
  'probabilities': [{'probability': 0.2,
    'label': 'No progression',
    'value': 0},
   {'probability': 0.8, 'label': 'Progression', 'value': 1}],
  'data': {'age': 60.0,
   'sex': 2,
   'bmi': 32.1,
   'bp': 101.0,
   's1': 157.0,
   's2': 93.2,
   's3': 38.0,
   's4': 4.0,
   's5': 4.9,
   's6': 87.0}}}
Creating a plan with a trained model
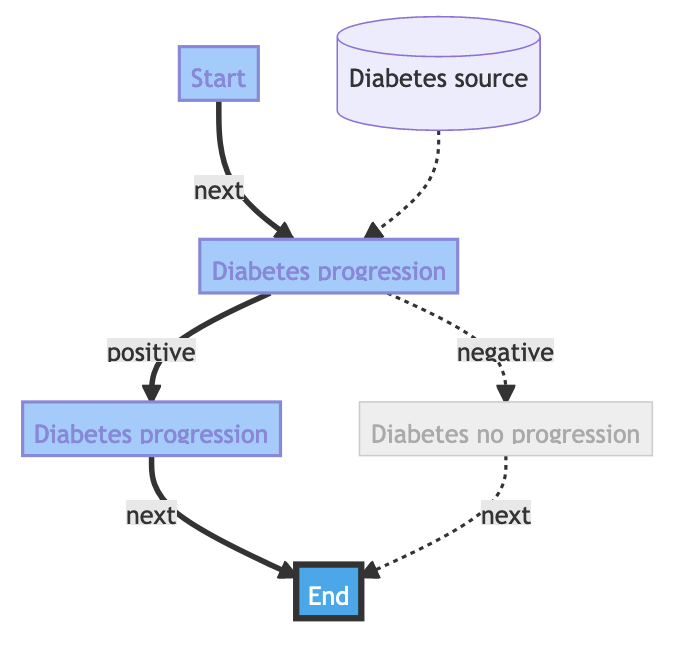
To create a plan from scratch it is simplest to start with an empty plan and add components to it as required. Here we create a simple 5-step plan which contains a simple logistic regression algorithm for diabetes, train it and then depending on the result moves to a progression or a no progression step and then the end step.
We start by creating a plan and then adding steps in reverse to take into account dependencies.
from easul import *

plan = Plan(title="My plan")
plan.add_step("end_step",EndStep(title="End"))
plan.add_step("diab_prog",PreStep(title="Diabetes progression", next_step=plan.get_step("end_step")))
plan.add_step("diab_no_prog",PreStep(title="Diabetes no progression", next_step=plan.get_step("end_step")))
Now we create the diabetes classifier algorithm using an example data set which is provided.
from easul.tests.example import load_diabetes
from sklearn.linear_model import LogisticRegression

diab_dset = load_diabetes(raw=True, as_classifier=True)
The dataset is a container for a pandas DataFrame along with a Cerberus schema describing the fields:
diab_dset.schema

{'age': {'type': 'number', 'help': 'Age in years'},
 'sex': {'type': 'category', 'options': {1: 'Male', 2: 'Female'}, 'help': 'Gender', 'pre_convert': 'integer'},
 'bmi': {'type': 'number', 'help': 'Body mass index'}, 'bp': {'type': 'number', 'help': 'Avg blood pressure'},
 's1': {'type': 'number', 'help': 'tc, total serum cholesterol'},
 's2': {'type': 'number', 'help': 'ldl, low-density lipoproteins'},
 's3': {'type': 'number', 'help': 'hdl, high-density lipoproteins'},
 's4': {'type': 'number', 'help': 'tch, total cholesterol / HDL'},
 's5': {'type': 'number', 'help': 'ltg, possibly log of serum triglycerides level'},
 's6': {'type': 'number', 'help': 'glu, blood sugar level'},
 'y': {'type': 'category', 'help': 'Boolean flag for disease progression', 'pre_convert': 'integer', 'options': {0: 'No progression', 1: 'Progression'}}
}
Data sets are designed to be used for various purposes including training (e.g. they have some simple built in methods including splitting into training and test sets.) and providing input data (e.g. in which they do not contain 'y' values).
diab_train, diab_test = diab_dset.train_test_split(train_size=0.75)

diab_alg = ClassifierAlgorithm(title="Model diabetes progression", model=LogisticRegression(max_iter=2000), schema=diab_train.schema)
diab_alg.fit(diab_train)
The classifier algorithm here wraps the scikit-learn model and the input data schema.
We can test the algorithm at this point without putting it into the plan yet:
diab_alg.single_result(data={"age": 59, "sex": 2, "bmi": 32.1, "bp": 101, "s1": 157, "s2": 93.2, "s3": 38,
                                     "s4": 4, "s5": 4.9, "s6": 87}).asdict()
...

{'value': 1,
 'label': 'Progression',
 'probabilities': [{'probability': 0.2, 'label': 'No progression', 'value': 0},
  {'probability': 0.8, 'label': 'Progression', 'value': 1}],
 'data': {'age': 59.0,
  'sex': 2,
  'bmi': 32.1,
  'bp': 101.0,
  's1': 157.0,
  's2': 93.2,
  's3': 38.0,
  's4': 4.0,
  's5': 4.9,
  's6': 87.0}}
Internally in the process above data set is created which uses the algorithm's schema and ensures that input data validates correctly.
Now we know it is working, we can add an algorithm step to the plan and create a simple empty source for the data:
plan.add_source("diab_step",ConstantSource(title="Diabetes source", data={}))

plan.add_step("diab_step",
    AlgorithmStep(
      source=plan.get_source("diab_step"),
      title="Diabetes progression",
      algorithm=diab_alg,
      decision = BinaryDecision(true_step = plan.get_step("diab_prog"), false_step=plan.get_step("diab_no_prog")),
    )
)
And finally add the start step which triggers the diabetes progression step.
plan.add_step("start_step", StartStep(title="Start", next_step=plan.get_step("diab_step")))
Now we can visualise the plan using provided data:
from easul.notebook import visualise_run, describe_plan
describe_plan(plan)
visualise_run(plan, {"diab_step": {"age": 59, "sex": 2, "bmi": 32.1, "bp": 101, "s1": 157, "s2": 93.2, "s3": 38,
                                     "s4": 4, "s5": 4.9, "s6": 87}})
And run some simulations using input data to see what happens. We get the same result as the initial test for the algorithm.
simulate_decision("diab_step",plan,{"diab_step": {"age": 59, "sex": 2, "bmi": 32.1, "bp": 101, "s1": 157, "s2": 93.2, "s3": 38,
                                     "s4": 4, "s5": 4.9, "s6": 87}}, as_data=True)
...

{'outcome_step': 'diab_step',
 'next_step': 'diab_prog',
 'reason': 'positive',
 'result': {'value': 1,
  'label': 'Progression',
  'probabilities': [{'probability': 0.2,
    'label': 'No progression',
    'value': 0},
   {'probability': 0.8, 'label': 'Progression', 'value': 1}],
  'data': {'age': 59.0,
   'sex': 2,
   'bmi': 32.1,
   'bp': 101.0,
   's1': 157.0,
   's2': 93.2,
   's3': 38.0,
   's4': 4.0,
   's5': 4.9,
   's6': 87.0}}}
By varying the input data we get a different result:
simulate_decision("diab_step",plan,{"diab_step": {"age": 59, "sex": 1, "bmi": 38, "bp": 101, "s1": 157, "s2": 93.2, "s3": 38,
...

{'outcome_step': 'diab_step',
 'next_step': 'diab_prog',
 'reason': 'positive',
 'result': {'value': 1,
  'label': 'Progression',
  'probabilities': [{'probability': 0.04,
    'label': 'No progression',
    'value': 0},
   {'probability': 0.96, 'label': 'Progression', 'value': 1}],
  'data': {'age': 59.0,
   'sex': 1,
   'bmi': 38.0,
   'bp': 101.0,
   's1': 157.0,
   's2': 93.2,
   's3': 38.0,
   's4': 4.0,
   's5': 4.9,
   's6': 87.0}}}
This is a simple example of the kind of model-enabled plans which can be created using EASUL.
Advanced usage
Processing multiple data points is a little more involved because it requires an engine to be utilised in order to drive the journeys.
Before setting up the engine, it is necessary to define data sources which will provide the basis for the patient journeys and inject these into the plan.
'processes' provide the ability to do some transformations on the data prior to their use in their respective steps. Processes are simple callable classes or functions - which operate on input data and return transformed data. EASUL comes with a bank of commonly used processes, but custom functions can be easily used.
Since the engine operates over a time period, it is necessary to provide the start and end times for each patient journey.
The use of processes simplifies the construction of new timestamp fields combining date and time strings with different formats.
from easul import *
from easul.examples import load_data_file
admissions = DataFrameSource(title="Admissions",
                           data=load_data_file("admission.csv", limit=10),
                           processes=[
                               ParseDate(field_name="date_of_birth", format="%Y%m%d"),
                               ParseDate(field_name="admission_date", format="%Y-%m-%d"),
                               ParseTime(field_name="admission_time", format="%H:%M:%S"),
                               ParseDate(field_name="discharge_date", format="%Y-%m-%d"),
                               ParseTime(field_name="discharge_time", format="%H:%M"),
                               CombineDateTime(date_field="admission_date", time_field="admission_time",
                                               output_field="admission_ts"),
                               CombineDateTime(date_field="discharge_date", time_field="discharge_time",
                                               output_field="discharge_ts")
                           ],
                           reference_field="admission_id",
                           )
Now we can setup the other sources required.
    catheter = DataFrameSource(title="Catheter",
                               data=load_data_file("catheter.csv"),
                               reference_field="admission_id",
                               )

    progression = CollatedSource(
        sources={"admissions": admissions, "progression": DataFrameSource(title="Progression",
                                                                    data=load_data_file("progression.csv"),
                                                                    reference_field="admission_id"
                                                                    )},
        processes=[
            Age(from_field="date_of_birth", to_field="admission_date", target_field="age"),
            MapValues(mappings={"M": 1, "F": 2}, field="sex")
        ],
        title="Progression",
    )
The 'progression' source re-uses the 'admissions' source and combines it with another data file through the CollatedSource. It also shows how processes can be used to create derived data e.g. age and sex as numbers rather than characters. This data format is required in order for the diabetes progression machine learning model to operate correctly.
A 'reference_name' corresponding to one of the sources is required to drive the engine. This provides the list of references and the fields containing start and end timestamps.
from easul.engine.local import LocalEngine
plan = create_example_plan() #same plan from above

engine = LocalEngine(
        sources={"admissions": admissions, "catheter": catheter, "progression": progression},
        reference_name="admissions",
        start_ts_field="admission_ts",
        end_ts_field="discharge_ts",
    )


    engine.run(plan)
    states, steps = engine.get_outcomes()
The outputs from this are two lists containing states and steps for each patient admission in the 'admissions' source which can be subsequently analysed.
Is EASUL being actively maintained?
Yes, we are using EASUL as the basis for research grants and current projects and are actively maintaining and developing it with new features. However, it is still work in progress and therefore we do not recommend that it is used in production projects in its current state.
What license is EASUL released under?
The core EASUL library has been released under an LGPL License (Version 3.0) so it can be integrated into other tools and modified in accordance with the permissions stated (see https://www.gnu.org/licenses/lgpl-3.0.html or LICENSE.md for more details).
Third-party tools
EASUL uses MermaidJS (https://mermaid.js.org/) to draw your workflow diagrams. To simplify the setup, this tutorial embeds the JS download from a CDN into HTML, but the default is to use a local version installed from NPM via NodeJS.
We recommend that for instances where data is sensitive that you install and use the MermaidJS CLI using NPM.
Logo design
The EASUL logo is based on an altered version of this image which is licensed under a Creative Commons 4.0 BY-NC license. It incorporates public domain clipart available from https://publicdomainvectors.org/en/free-clipart.
Release history Release notifications | RSS feed


Download files
Download the file for your platform. If you're not sure which to choose, learn more about installing packages.
Source Distribution
Built Distribution
Filter files by name, interpreter, ABI, and platform.
If you're not sure about the file name format, learn more about wheel file names.
Copy a direct link to the current filters
File details
Details for the file easul-1.0.3.tar.gz.
File metadata
- Download URL: easul-1.0.3.tar.gz
- Upload date:
- Size: 395.5 kB
- Tags: Source
- Uploaded using Trusted Publishing? No
- Uploaded via: twine/4.0.2 CPython/3.9.6
File hashes
| Algorithm | Hash digest | |
|---|---|---|
| SHA256 |
8fb912a734fe6f9c692683398d859bd081c3a88d2e98f597ff9d8da9608f0c3d
|
|
| MD5 |
c62c6ff8fc7b9b4c0b182abb25f2be68
|
|
| BLAKE2b-256 |
b2a56ef65ab37338e2d5489d413079122aafc9969db870a8152101c18d74bede
|
File details
Details for the file easul-1.0.3-py3-none-any.whl.
File metadata
- Download URL: easul-1.0.3-py3-none-any.whl
- Upload date:
- Size: 164.4 kB
- Tags: Python 3
- Uploaded using Trusted Publishing? No
- Uploaded via: twine/4.0.2 CPython/3.9.6
File hashes
| Algorithm | Hash digest | |
|---|---|---|
| SHA256 |
ea9932eb6f343a1bc39d8515bc89086c62629bc01af5da405de1051a1b02273b
|
|
| MD5 |
e2c2c17dabd4b87a14fd788a714199d4
|
|
| BLAKE2b-256 |
343b4a0cdbc4790e5d03e91d3e548254cf461f3424f664b73baea3c948bdbdb5
|


