EazeML makes Task of Machine Learning and Data Science super easy.

Project description


Eazeml ;)

eazeml is a Python 3.x based Machine Learning Open Source Library which makes the process of machine learning and Data science Faster, Easy and reduces the difficulty of manual coding.
Installation
Use the package manager pip to install eazeml.
pip install eazeml
Usage
import eazeml as ez
help(ez) ## Prints all function and usage
Note:
Only Few Functions example are shown below, for all methods example and usage please see this example notebooks here.
Some Automated functions
quick_ml()
quick_ml method provides automation to data cleaningn & machine learning process here we just need to provide
- Pandas Dataframe containg data.
- Target-column name we want to make a prediction for.
- flag: which specify prediction type (like 'r' for regression and 'c' for classification).
- n: n specifies no of features you wan't to use for prediction. it use RFE (Reccurssive Feature Elimination) for extacting best 'n' specified column and make prediction using them.
- By default 'n' is set to 0 and will use all quick_ml will use all features for prediction if 'n' not specified
and thats it, function will automatically clean & process data and give you output as a complete summary of processing done, Features used and returns report table and model used for prediction
usage:
ez.quick_ml(dataframe,'target_column','flag')
or
report,model = ez.quick_ml(dataframe,'target_column','flag')
or
report,model = ez.quick_ml(dataframe,'target_column','flag',n)
# performs RFE and selects only 'n' number of column for prediction.
for Google Cobal & Kaggle:
ez.plotly_brower() #enables plotly in colab & kaggle.
report,model = ez.quick_ml(dataframe,'target_column','flag',n)
# performs RFE and selects only 'n' number of column for prediction.
quick_pred()
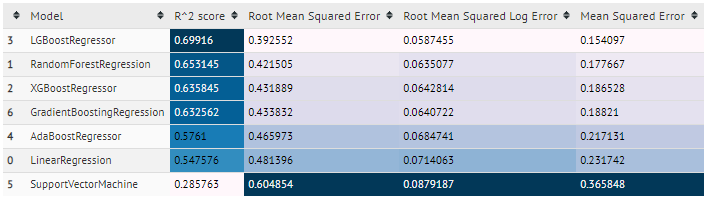
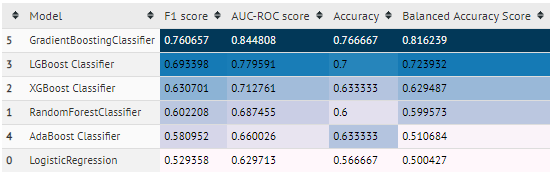
quick_pred method takes cleaned data and prediction flag('r','c') and does prediction using several different algorithms and gives output score using several metrics for each algorithm in tabular format.
example:
- regression
- classification
code:
X = features
y = target column
## flag('r','c')
ez.quick_pred(X,y,'flag')
or
report = ez.quick_pred(X,y,'flag')
## report stores table for future use
deploy_one()
Method Deploys, Machine Learning Model to Production. In one line of code.
Method Creates Fask App which is ready to be deployed to production..
- User just need to pass
- Model - Machine Learning Model
- Features - Features used for Predictions
- 'title' (optional) - Title to set on Web App. By default it's "Make Predictions".
- And Done, Your Deployment ready files will be stored in created folder naned 'deployment-files'.
ez.deploy_one(model,features,'titlle')
kaggle()
Method makes participating in kaggle compitions easy.
kaggle method takes input arguments: traindataset, testdataset,target columname and flag('r','c') and gives output as complete summary of steps performed in prediction and data cleaning process and returns predicted values of test dataframe which can be submitted on kaggle.
ez.kaggle(train,test,'targetcolumn','flag')
or
test_pred,report = ez.kaggle(train,test,'targetcolumn','flag')
## test_pred- consist test file prediction
## report - tabular report score
gen_txt_report()
Method genrates txt file named output.txt containig entire summary report of oprations performed
usage:
%%capture example ## captures output of ell and store in example
quick_ml(df,'target','c')
gen_report(example) ## this creates summary file named output.txt
# file contains all log and output of cell
clean_data()
clean_data automatically cleans data by:
- removing columns having null value greated than 20%
- impute median in missing numeric columns
- impute mode in missing categorical column
dataframe = ez.clean_data(dataframe)
## returns cleaned dataframe
nlp_text()
nlp_text converts Textual data of Column to Tfidf vector after operations:
- Removing Punctutions
- Removing Special Symbol/character
- Lemmatization
- Coverts Uppercase to lowercase
- only column passed is converted to vector not whole dataframe
- need to manually join output data vector with original dataframe
vec = ez.nlp_text(dataframe,'columname')
## returns cleaned Tfidf vector
Some example of Basic functions
importdata()
Method capable of importing tsc,csv,excel file in pandas dataframe object
dataframe = ez.importdata('filename.extension')
## returns cleaned Tfidf vector
info()
info method gives complete information about the data in tabluar format including:
- Number of Rows,Column
- Number of Categorical, Numerical Feature
- null, unique values in each column
- total missing value and missing value percentage in each column.
- Plots graph of Missing data in percentage format.
ez.info(dataframe)
getcolumnstype()
getcolumnstype returns the type of columns and store it in list format. Saves wasting time in manully writing code and determining columns type.
num,cat = getcolumnstype(dataframe)
## num - list of numeric columns
## cat - list of categorical columns
drop_columns() & dropcolumns()
drop_columns takes argument as Percentage in NUm (int) and columns name
- Num - number of null value percentage, above which all columns will be dropped
- (optional) columns name - specify columns sepreated with ',' will be dropped
usage:
dataframe = ez.drop_columns(dataframe,n,'columnnames'..)
example:
- This Example will drop all columns having null value percentage above 20 and drop columns id & name from dataframe.
df = ez.drop_columns(df,n,'id','name')
dropcolumns():
Method just drops specified columns. example:
df = ez.drop_columns(df,'id','name','tp','dsd')
fillnulls()
fillnulls method performs imputation operation of mean ,median,mode or specified value on specified columns together and returns imputed dataframe:
- Example 1: filling median in columns
df = fillnulls(df,'median','col1','col2',...)
# fill median of respective column to respective column
- Example 2: filling mean in columns
df = fillnulls(df,'mean','col1','col2',...)
# fill mean of respective column to respective column
- Example 3: filling mode in columns
df = fillnulls(df,'mode','col1','col2',...)
# fill mode of respective column to respective column
- Example 4: filling specified value in columns
df = fillnulls(df,'unknown','col1','col2',...)
# unknown will be filled inplace of null values in col2, col1
extract_number()
Method Extracts number from column removing any extra string,special char,symbol, etc and returns cleaned column
df = ez.extract_number(df,'income')
# removes $ symbol and return cleaned column in dataframe
corr_heatmap()
Plots Corelation Heatmap of given dataframe.
arguments:
- Dataframe
- Style:
- 'interactive': uses plotly and plots interactive heatmap.
- 'basic': prints colorized tabular format heatmap.
- none: uses seaborn to plot annoted heatmap.
ez.corr_heatmap(df)
# Plots heatmap with seaboron
ez.corr_heatmap(df,'interactive')
# plots interactive heatmap with plotly
ez.corr_heatmap(df,'basic')
# prints colorized tabluar correaltion heatmap
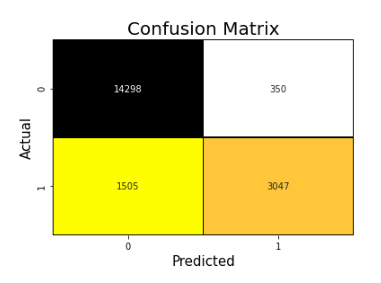
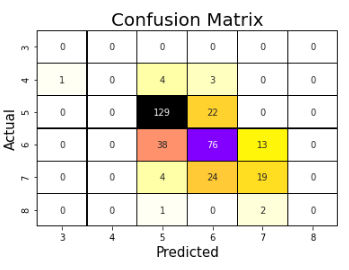
confusion_mat()
Method Plots Visualized Confusion Matrix.
examples:
#y_true- Actual Value
#y_pred- Predicted Value
ez.confusion_mat(y_true,y_pred)
# you can change color using cmap
roc_curve_graph
Method Plots AUC-ROC plot for y_true,y_pred
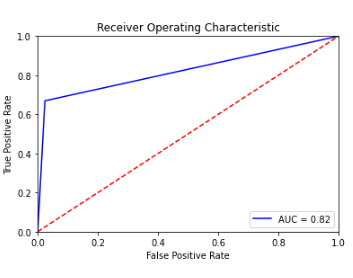
- only works with Binary Classification
ez.roc_curve_graph(y_true,y_pred)
box_hist_plot()
method plots interactive Box plot and histogram using plotly library
ez.box_hist_plot(dataframe,'col1','col2',...)
# plots box plot and histogram for all specified column of dataframe.
classification() & regression()
-
classification():
It is menu based classification, asks user to which model to use for prediction.
It returns y_predicted,y_actual, model used for classification
It also prints all classification score metrics and confusion matrix by default
# X = features
# y = target column
y_pred,y_actual,model = ez.classification(X,y)
-
regression():
It is menu based regression method, asks user for which model to use for prediction.
It retruns y_predicted,y_actual, model used for prediction
It also prints all regression score metrics by default
# X = features
# y = target column
y_pred,y_actual,model = ez.regresssion(X,y)
RFE()
Methods Perfroms Recurrsive Feature Elimination and returns best n columns specified
rfecolumns = ez.rfe(model,X_train,y_train,n)
# n- number of features to be selected (defualt n=10)
# model - model to use RFE with.
classification_result() & regression_result()
Prints all scoring Metrics for when passed y_true & y_predicted
-
classification_result()
Evaluation Matrics:
- F1 score
- AUC-ROC score
- classification report
- plots confusion matrix
- plots auc graph (only if binary classification)
ez.classification_result(y_true,y_pred)
-
regression_result()
Evaluation Matrics:
- R2 score
- Mean Squared Error score
- Root Mean Squared Error score
- Root Mean Squared log Error score
ez.regression_result(y_true,y_pred)
Machine Learning ALgorithms
Eazeml provides use of each algoritm with custom parameter usage:
# first need to define these variables
X = Feature
y = Targetcolumn
X_train,X_test,y_train,y_test = train_test_split(X,y,train_size=10)
ez.regression_result(y_true,y_pred)
- These Machine Learning Algorithms are already set to best param grid from experienced users.
- 'reg' defines regression & 'classifier' defines classifier algorithm.
## pass X_train,y_train,X_test,y_test in which ever algorithm you need.
y_pred,model = ez.linear_reg(X_train,y_train,X_test,y_test)
## return y_predicted and model for further usage.
ez.logistic_reg(X_train,y_train,X_test,y_test)
ez.randomforest_classifier(X_train,y_train,X_test,y_test)
ez.randomforest_reg(X_train,y_train,X_test,y_test)
ez.xgb_classifier(X_train,y_train,X_test,y_test)
ez.xgb_reg(X_train,y_train,X_test,y_test)
ez.lgb_classifier(X_train,y_train,X_test,y_test)
ez.lgb_reg(X_train,y_train,X_test,y_test)
ez.Gradient_boost_classifier(X_train,y_train,X_test,y_test)
ez.Gradient_boost_reg(X_train,y_train,X_test,y_test)
ez.adaboost_classifier(X_train,y_train,X_test,y_test)
ez.adaboost_reg(X_train,y_train,X_test,y_test)
get_IQR
Prints IQR (Inter Quartile Range) values table for each column of dataframe
ez.get_IQR(dataframe)
show_outlier & remove_outlier
- show_outlier()
Method Prints number of outlier in each column of dataframe
ez.show_outlier(dataframe)
- remove_outlier()
Method removes all outliers from dataframe and returns Normally Distributed Dataframe and prints IQR range table.
newdf = ez.remove_outlier(dataframe)
# stores outlier free dataframe in newdf
stat_models()
Prints Statastical Significance table(OLS table) for each column of dataframe with respect to target column
X = features
y = target column
ez.stats_models(y,X)
VIF()
Method Prints VIF(Variation Inflation Variance)value of each column in Table format for each column of dataframe
ez.VIF(dataframe)
Contributing
Pull requests are welcome. For major changes, please open an issue first to discuss what you would like to change.
Please make sure to update tests as appropriate.
License
Release history Release notifications | RSS feed


Download files
Download the file for your platform. If you're not sure which to choose, learn more about installing packages.
Source Distribution
Built Distribution
Filter files by name, interpreter, ABI, and platform.
If you're not sure about the file name format, learn more about wheel file names.
Copy a direct link to the current filters
File details
Details for the file eazeml-0.0.7.tar.gz.
File metadata
- Download URL: eazeml-0.0.7.tar.gz
- Upload date:
- Size: 23.8 kB
- Tags: Source
- Uploaded using Trusted Publishing? No
- Uploaded via: twine/3.1.1 pkginfo/1.5.0.1 requests/2.23.0 setuptools/41.2.0 requests-toolbelt/0.9.1 tqdm/4.46.0 CPython/3.7.6
File hashes
| Algorithm | Hash digest | |
|---|---|---|
| SHA256 |
8455437ff56ed4f703e274c496283f8c0ee9c4c4c4fbbab26a5fdf81658a084a
|
|
| MD5 |
d6d8e19c05c3fedf6bfc17933072b51f
|
|
| BLAKE2b-256 |
4e888997eefdabdb158cf566f8f1418d63d2361128310791bf43a86eb7f91287
|
File details
Details for the file eazeml-0.0.7-py3-none-any.whl.
File metadata
- Download URL: eazeml-0.0.7-py3-none-any.whl
- Upload date:
- Size: 19.7 kB
- Tags: Python 3
- Uploaded using Trusted Publishing? No
- Uploaded via: twine/3.1.1 pkginfo/1.5.0.1 requests/2.23.0 setuptools/41.2.0 requests-toolbelt/0.9.1 tqdm/4.46.0 CPython/3.7.6
File hashes
| Algorithm | Hash digest | |
|---|---|---|
| SHA256 |
e12e068134bcd01d07c1ab908ff905349c785b5acaf3f58c469b9436325c70cf
|
|
| MD5 |
4cebf57cad75f58ca9f3fc80ea9540de
|
|
| BLAKE2b-256 |
60d0d86ef5d5815fcdd9190bd5534acefb0f99080ddef0d8c4e7d424234561a4
|


