Light-weight Python EDA and Visualization Library for Data Scientists

Project description
EDA and Visualization Library


Light-weight Python EDA and Visualization Library for Data Scientists.
The eda_viz module is a light-weight library that will make your data
exploration and visualization tasks lot simpler.
Installation
You can install eda-viz from PyPI:
pip install eda-viz
The library is only tested in Python 3.6.5, and on Mac OS v10.13.6.
How to use
Let's create a sample dataframe:
import pandas as pd
df = pd.DataFrame({
    'categories': ['A', 'B', 'A', 'C', 'D', 'B', 'A'],
    'numbers': [1, 2, 1, 3, 4, 2, 1]
})
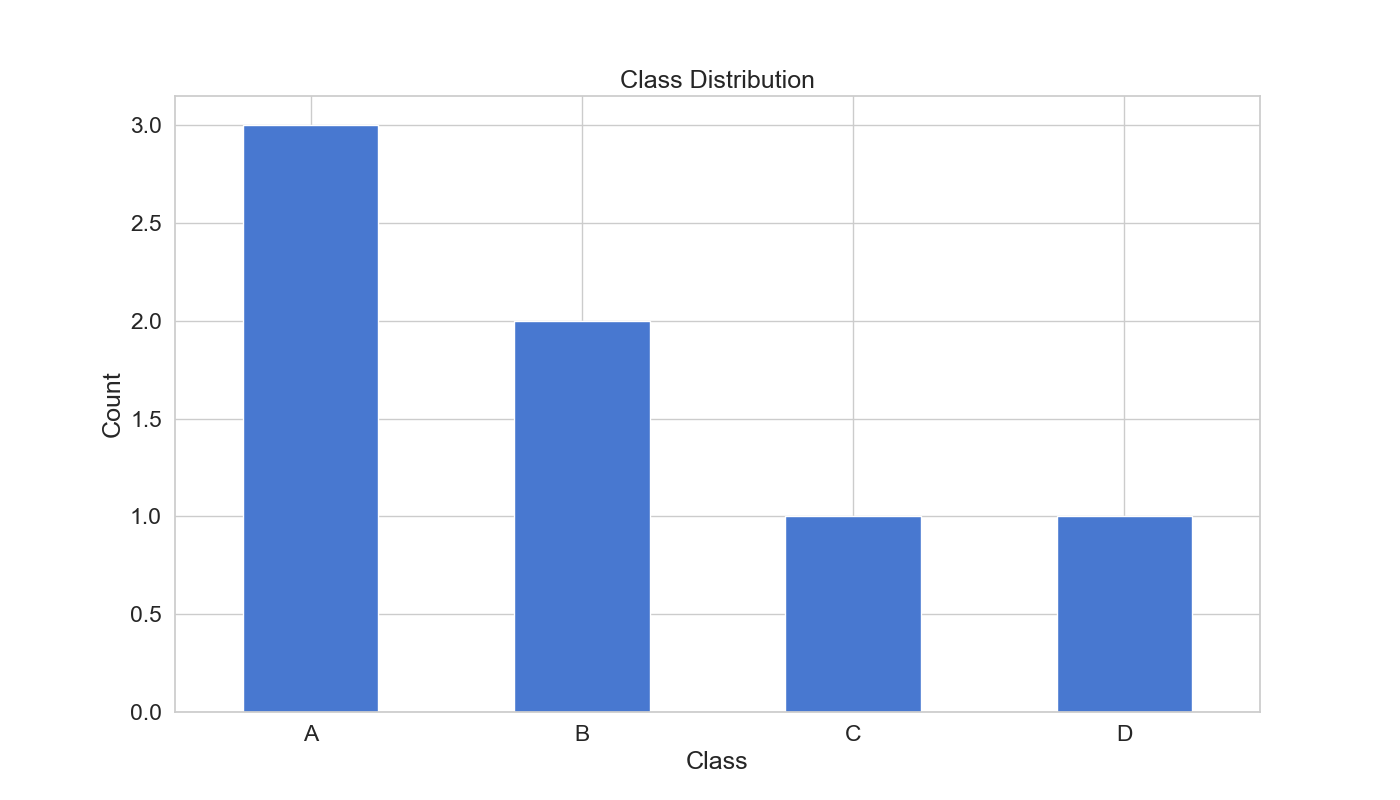
Column Distribution
from eda_viz.viz import column_distribution
column_distribution(df['categories'])
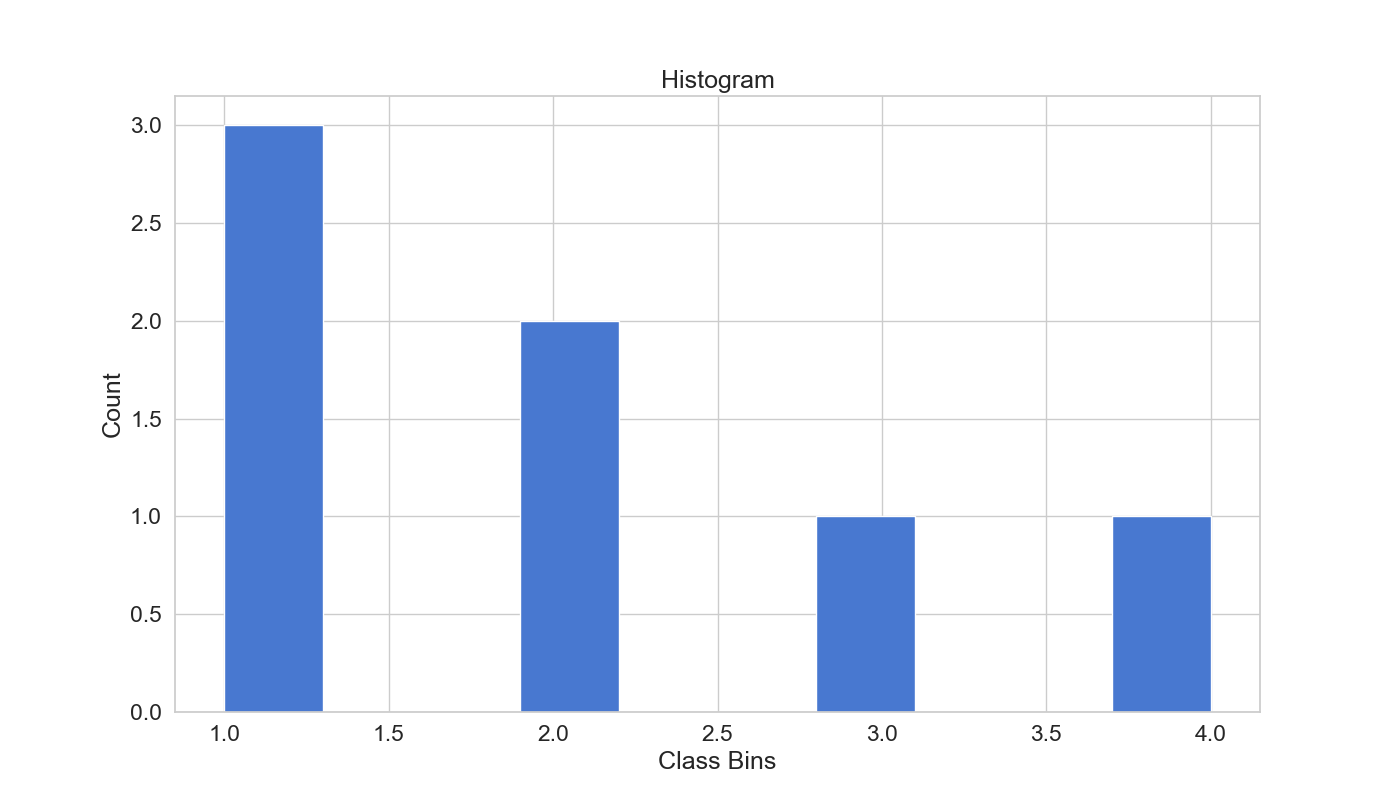
Histogram
from eda_viz.viz import histogram
histogram(df['numbers'])
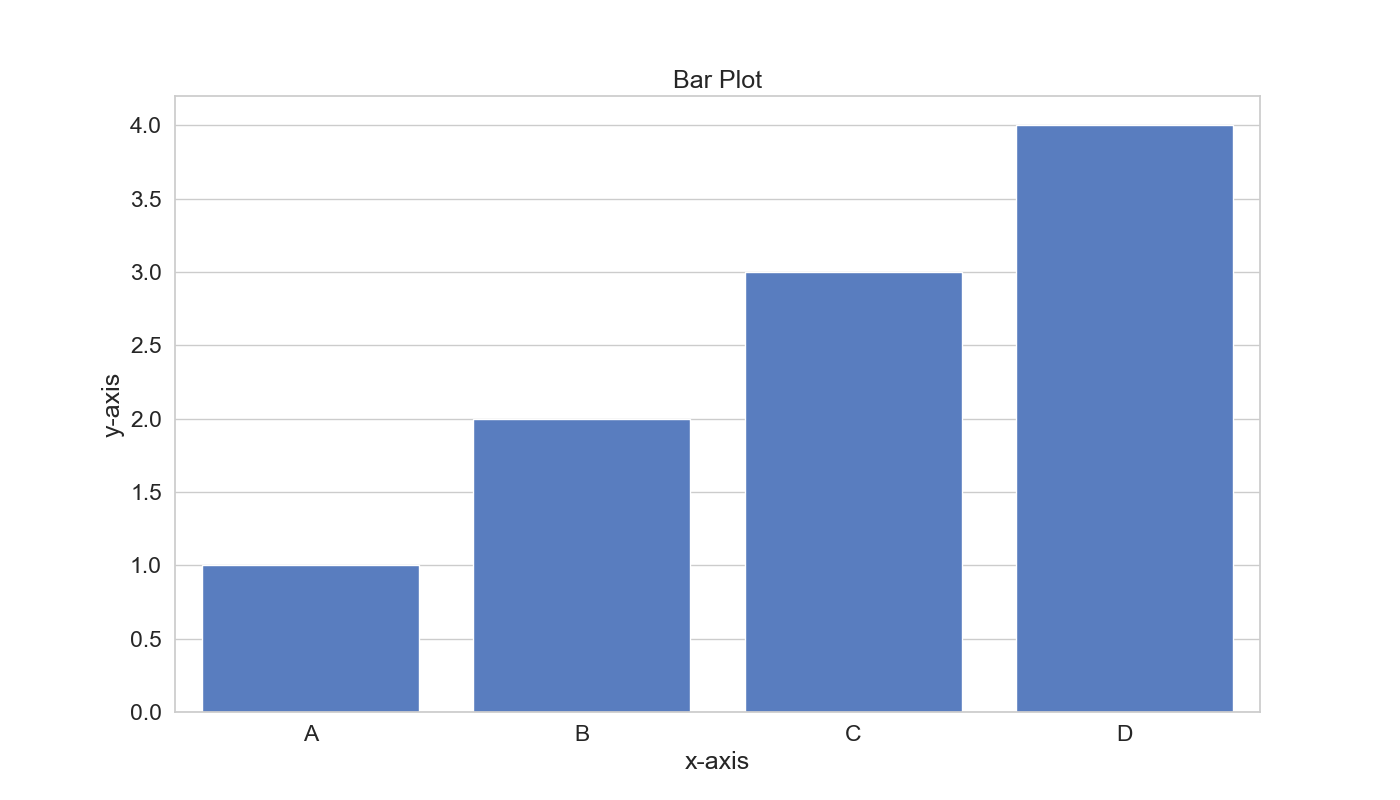
Bar Plot
from eda_viz.viz import bar_plot
bar_plot(df['categories'], df['numbers'])
Other charts are a WIP.


Download files
Download the file for your platform. If you're not sure which to choose, learn more about installing packages.
Source Distribution
eda-viz-0.0.6.1.tar.gz
(3.7 kB
view details)
File details
Details for the file eda-viz-0.0.6.1.tar.gz.
File metadata
- Download URL: eda-viz-0.0.6.1.tar.gz
- Upload date:
- Size: 3.7 kB
- Tags: Source
- Uploaded using Trusted Publishing? No
- Uploaded via: twine/1.13.0 pkginfo/1.5.0.1 requests/2.21.0 setuptools/41.0.0 requests-toolbelt/0.9.1 tqdm/4.31.1 CPython/3.6.3
File hashes
| Algorithm | Hash digest | |
|---|---|---|
| SHA256 |
fc63efd286bdc208e753b706b66538874563e09c505341250383a09cbb91b7cb
|
|
| MD5 |
c4260c675d95501ffe4cfaa71f44e779
|
|
| BLAKE2b-256 |
2066b0ee22c18f34d2b1a7306160ca447ad40e3e502658d80cf5cf0c107588ba
|


