A comprehensive, user-centric Python API for working with enDAQ data and devices

Project description
endaq-plot - Painless Plotting Of Sensor Data
endaq-plot is a package comprising a collection of plotting utilities for sensor data analysis. It leverages Plotly in order to produce interactive plots, and makes creating powerful visualizations simple and easy for those new to Python.
endaq-plot is a sub-package of the larger enDAQ ecosystem. See the endaq package for more details.
Installation
endaq-plot is available on PYPI via pip:
pip install endaq-plot
For the most recent features that are still under development, you can also use pip to install endaq-plot directly from GitHub:
pip install git+https://github.com/MideTechnology/endaq-python-plot.git@development
Usage Examples
For these examples we assume there is a Pandas DataFrame named df which has it's index as time stamps and it's one column being sensor values (e.g. x-axis accleration, or pressure). It also assumes there is a Pandas DataFrame attribute_df which contains all the attribute data about various data files. More information can be found about how to get this data from enDAQ IDE files in the endaq-cloud package.
from endaq.plot import octave_spectrogram, multi_file_plot_attributes, octave_psd_bar_plot
from endaq.plot.utilities import set_theme
Setting The Aesthetic Theme
set_theme(theme='endaq')
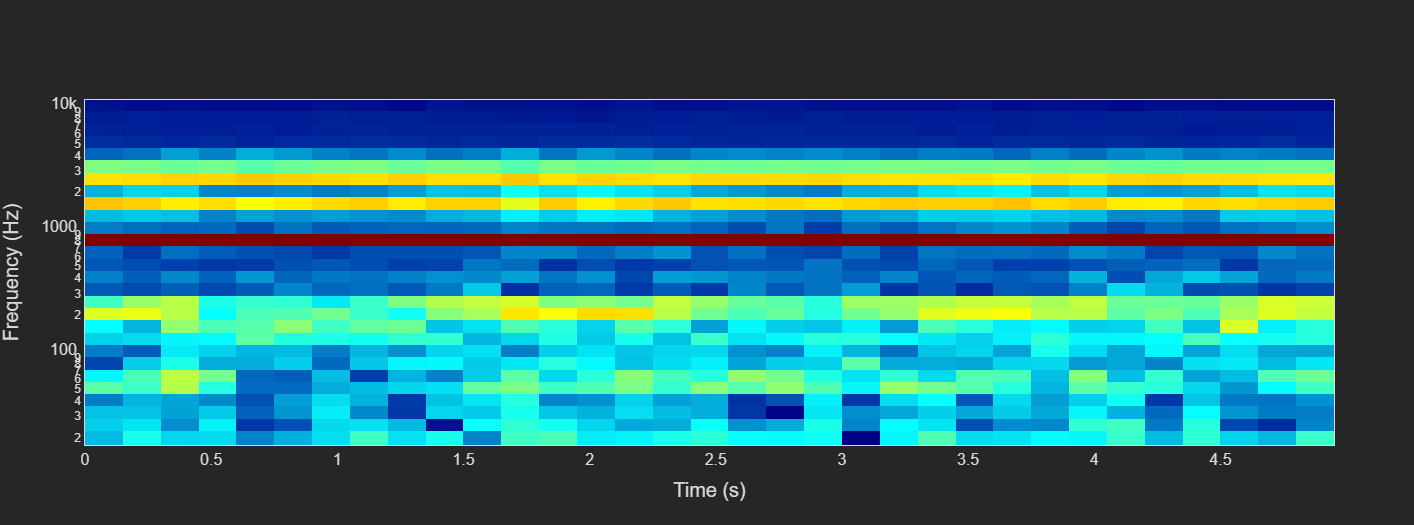
Creating Spectrograms With Octave Spaced Frequencies
freqs, bins, Pxx, fig = octave_spectrogram(df, window=.15)
fig.show()
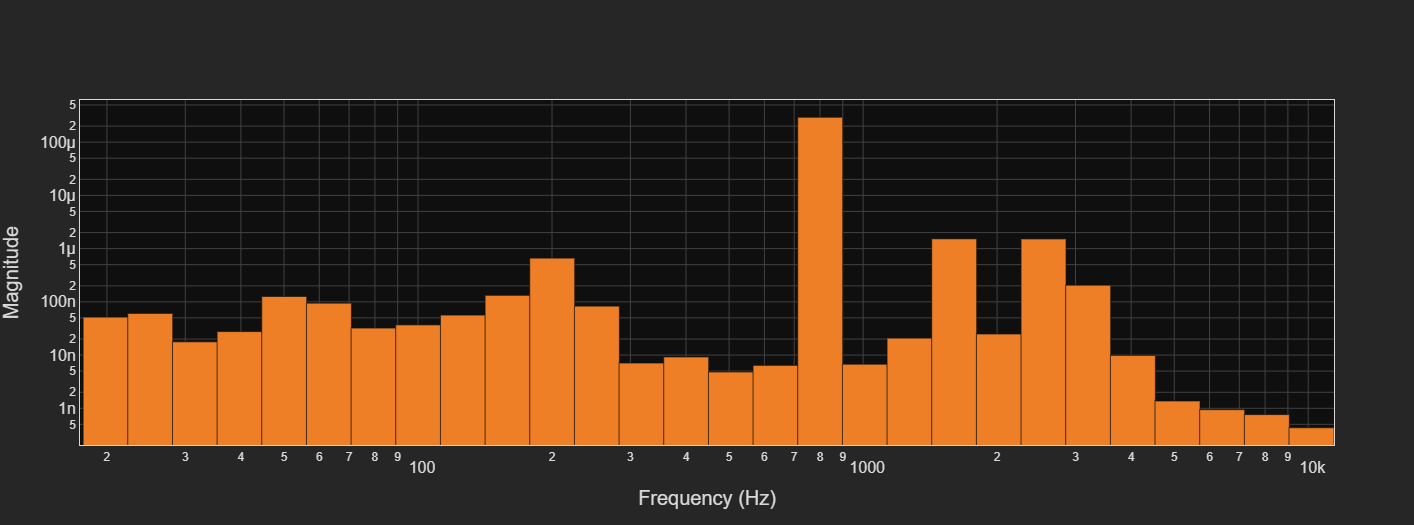
Creating PSD Bar Plots With Octave Spaced Frequencies
fig = octave_psd_bar_plot(df, yaxis_title="Magnitude")
fig.show()
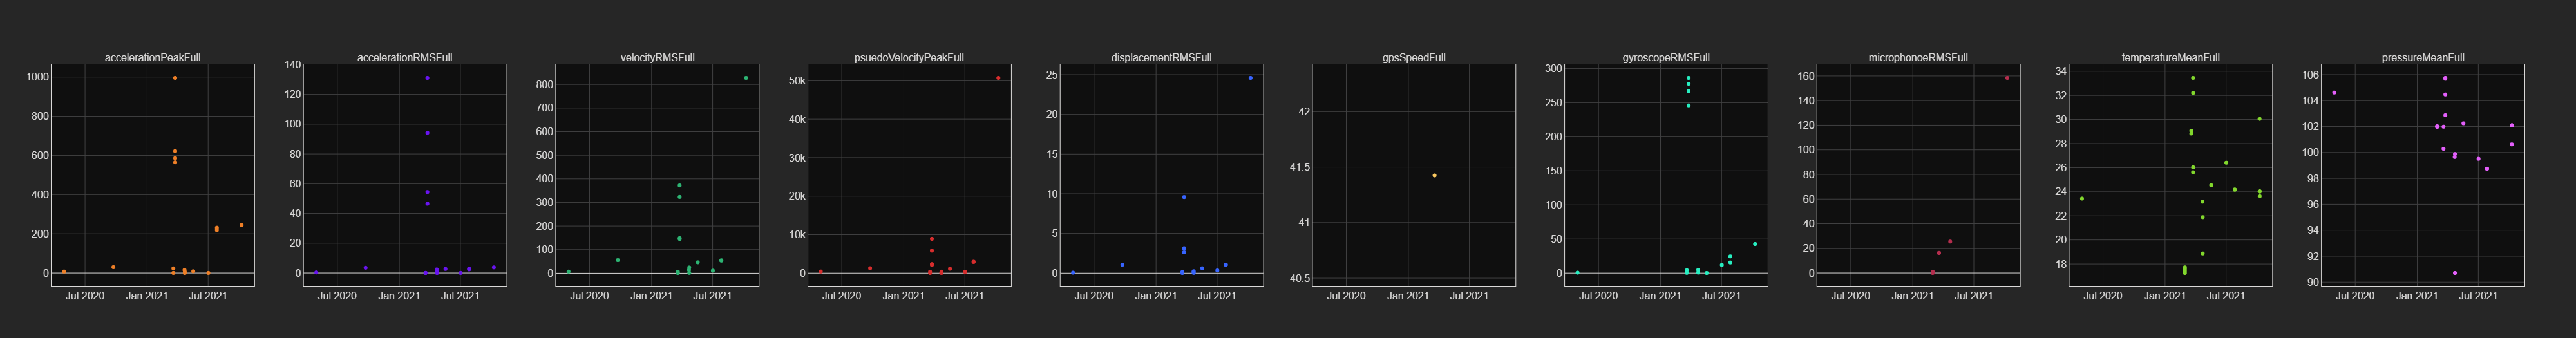
Plot Attributes In Figure With Subplots
fig = multi_file_plot_attributes(attribute_df)
fig.show()
Other Links
- the endaq package - https://github.com/MideTechnology/endaq-python
- the enDAQ homepage - https://endaq.com/
Release history Release notifications | RSS feed


Download files
Download the file for your platform. If you're not sure which to choose, learn more about installing packages.
Source Distribution
Built Distribution
Filter files by name, interpreter, ABI, and platform.
If you're not sure about the file name format, learn more about wheel file names.
Copy a direct link to the current filters
File details
Details for the file endaq-plot-1.1.0.tar.gz.
File metadata
- Download URL: endaq-plot-1.1.0.tar.gz
- Upload date:
- Size: 19.3 kB
- Tags: Source
- Uploaded using Trusted Publishing? No
- Uploaded via: twine/3.5.0 importlib_metadata/4.8.1 pkginfo/1.7.1 requests/2.26.0 requests-toolbelt/0.9.1 tqdm/4.62.3 CPython/3.9.7
File hashes
| Algorithm | Hash digest | |
|---|---|---|
| SHA256 |
8baa70849c11f5c7eb42b68d77fd3577753c0a60afedaa42ec8dd8df5ef4b76c
|
|
| MD5 |
068935b825dfd40d8ebe3649b9bd18cb
|
|
| BLAKE2b-256 |
ac7eee08971a6acddb6b06c94a262023e4dfe6e2dafed815ee8cc3a63ba1f023
|
File details
Details for the file endaq_plot-1.1.0-py3-none-any.whl.
File metadata
- Download URL: endaq_plot-1.1.0-py3-none-any.whl
- Upload date:
- Size: 19.4 kB
- Tags: Python 3
- Uploaded using Trusted Publishing? No
- Uploaded via: twine/3.5.0 importlib_metadata/4.8.1 pkginfo/1.7.1 requests/2.26.0 requests-toolbelt/0.9.1 tqdm/4.62.3 CPython/3.9.7
File hashes
| Algorithm | Hash digest | |
|---|---|---|
| SHA256 |
9dbdde7e7f810b2551420a07ce053dd94a38c7d3367b926f69c39b8075723b2e
|
|
| MD5 |
95520a78f7ee2c8e010000b1fa30e9b0
|
|
| BLAKE2b-256 |
0a2ee895d9eb69d2986164050e77a1eab130fd1aee1c4cbfafcf14e8a2af4812
|


