EPA region definitions and representations in

Project description
epa-regions-python
EPA regions from Natural Earth data with GeoPandas / regionmask.


Code
python -m epa_regions -r 50m --states-only --save
Installation
With conda (recommended):
conda activate ...
conda install -c conda-forge geopandas regionmask pooch pyogrio
pip install epa-regions
pip install epa-regions does not install any dependencies,
as it is expected that you will have installed them with conda.
geopandas: needed if you want to useepa_regions.get()pooch: for downloading/caching the shapefiles forepa_regions.get()pyogrio: for faster reading of shapefilesregionmask: needed if you want to useepa_regions.to_regionmask()
Note that epa_regions.look_up() requires only pandas,
and you can access the region definitions
(region number, office, and state/territory constituents)
at epa_regions.REGIONS without any 3rd-party dependencies.
python -m epa_regions needs matplotlib.
Usage
import epa_regions

# GeoPandas GeoDataFrame
epa = epa_regions.get(resolution="50m")

# Convert to regionmask Regions for use with gridded data
epa = epa_regions.to_regionmask(epa)
Point data
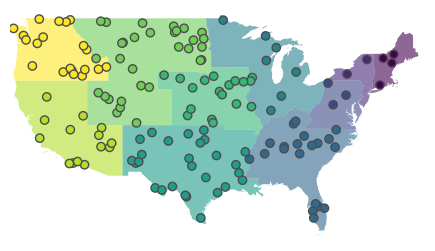
Code
import geopandas as gpd
import matplotlib.pyplot as plt
import numpy as np

import epa_regions

rng = np.random.default_rng(seed=123)

epa = epa_regions.get(resolution="50m")

# CONUS
lonmin, lonmax = -125, -66
latmin, latmax = 24, 50
n = 250
lon = rng.uniform(lonmin, lonmax, n)
lat = rng.uniform(latmin, latmax, n)
points = gpd.GeoDataFrame(
    geometry=gpd.points_from_xy(lon, lat, crs="EPSG:4326")
)

fig, ax = plt.subplots(constrained_layout=True, figsize=(4, 2.5))

epa.plot(column="number", ax=ax, alpha=0.6)
points.sjoin(epa, predicate="within").plot(column="number", ax=ax, ec="0.3", lw=1)

ax.set(xlim=(lonmin, lonmax), ylim=(latmin, latmax))
ax.axis("off")

fig.savefig("points.png", dpi="figure", bbox_inches="tight")
Gridded data
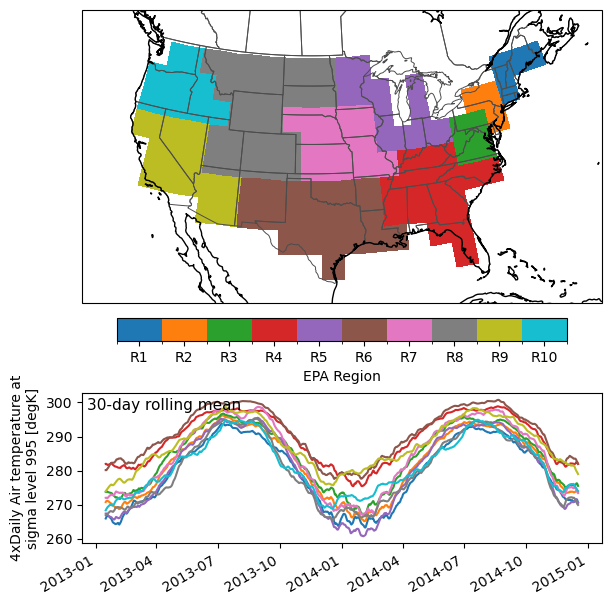
Code
import cartopy.crs as ccrs
import cartopy.feature as cfeature
import matplotlib.pyplot as plt
import numpy as np
import pandas as pd
import xarray as xr

import epa_regions

epa = epa_regions.to_regionmask(epa_regions.get(resolution="50m"))

# CONUS
lonmin, lonmax = -125, -66
latmin, latmax = 24, 50

ds = (
    xr.tutorial.open_dataset("air_temperature")
    .sel(lon=slice(lonmin + 360, lonmax + 360), lat=slice(latmax, latmin))
)
mask = epa.mask(ds.isel(time=0))

proj = ccrs.LambertConformal(central_longitude=-100)
tran = ccrs.PlateCarree()

fig = plt.figure(figsize=(6, 6), constrained_layout=True)

ax = fig.add_subplot(3, 1, (1, 2), projection=proj)

mask.plot.pcolormesh(
    levels=np.arange(mask.min() - 0.5, mask.max() + 1),
    ax=ax,
    transform=ccrs.PlateCarree(),
    cmap="tab10",
    cbar_kwargs=dict(
        orientation="horizontal",
        fraction=0.075,
        pad=0.05,
        ticks=np.arange(mask.min(), mask.max() + 1),
        format="R{x:.0f}",
        label="EPA Region",
    ),
)

ax.add_feature(cfeature.STATES, linewidth=0.7, edgecolor="0.3")
ax.coastlines()
ax.set_extent([lonmin, lonmax - 2, latmin, latmax], crs=tran)
ax.set_title("")

ax = fig.add_subplot(3, 1, 3)

(dt,) = np.unique(ds.time.diff("time"))

window = pd.Timedelta("30D")
(
    ds["air"].groupby(mask)
    .mean()
    .rolling(time=int(window / dt), center=True)
    .mean()
    .plot(
        hue="mask",
        ax=ax,
        add_legend=False,
    )
)

ax.set_xlabel("")
ax.text(
    0.01,
    0.97,
    f"{window.total_seconds() / 86400:g}-day rolling mean",
    ha="left",
    va="top",
    transform=ax.transAxes,
    fontsize=11,
)

fig.savefig("gridded.png", dpi="figure", bbox_inches="tight")


Download files
Download the file for your platform. If you're not sure which to choose, learn more about installing packages.
Source Distribution
Built Distribution
Filter files by name, interpreter, ABI, and platform.
If you're not sure about the file name format, learn more about wheel file names.
Copy a direct link to the current filters
File details
Details for the file epa_regions-0.0.5.tar.gz.
File metadata
- Download URL: epa_regions-0.0.5.tar.gz
- Upload date:
- Size: 10.6 kB
- Tags: Source
- Uploaded using Trusted Publishing? No
- Uploaded via: python-requests/2.32.3
File hashes
| Algorithm | Hash digest | |
|---|---|---|
| SHA256 |
b40a1534822ad31e03fa0120a2936847a2d7eb0be4f6c84c589deaa81ed64671
|
|
| MD5 |
985fe226a35b0d04a5ab8e7d32193c22
|
|
| BLAKE2b-256 |
103cc23b04782b6d158c14e786b7adbefaf4d30e0ec5fd1e0c864d9ab8978e6e
|
File details
Details for the file epa_regions-0.0.5-py3-none-any.whl.
File metadata
- Download URL: epa_regions-0.0.5-py3-none-any.whl
- Upload date:
- Size: 9.1 kB
- Tags: Python 3
- Uploaded using Trusted Publishing? No
- Uploaded via: python-requests/2.32.3
File hashes
| Algorithm | Hash digest | |
|---|---|---|
| SHA256 |
452f6ccb1410a3e4fd850008b52168d82920de94c715a49e0cbb7b622082b763
|
|
| MD5 |
0658524cc0a1973b528e0c5348d50c00
|
|
| BLAKE2b-256 |
4db1d47de900c3fd9f451be2ad55377ef76d0a31028c09474a1633572ca604b7
|


