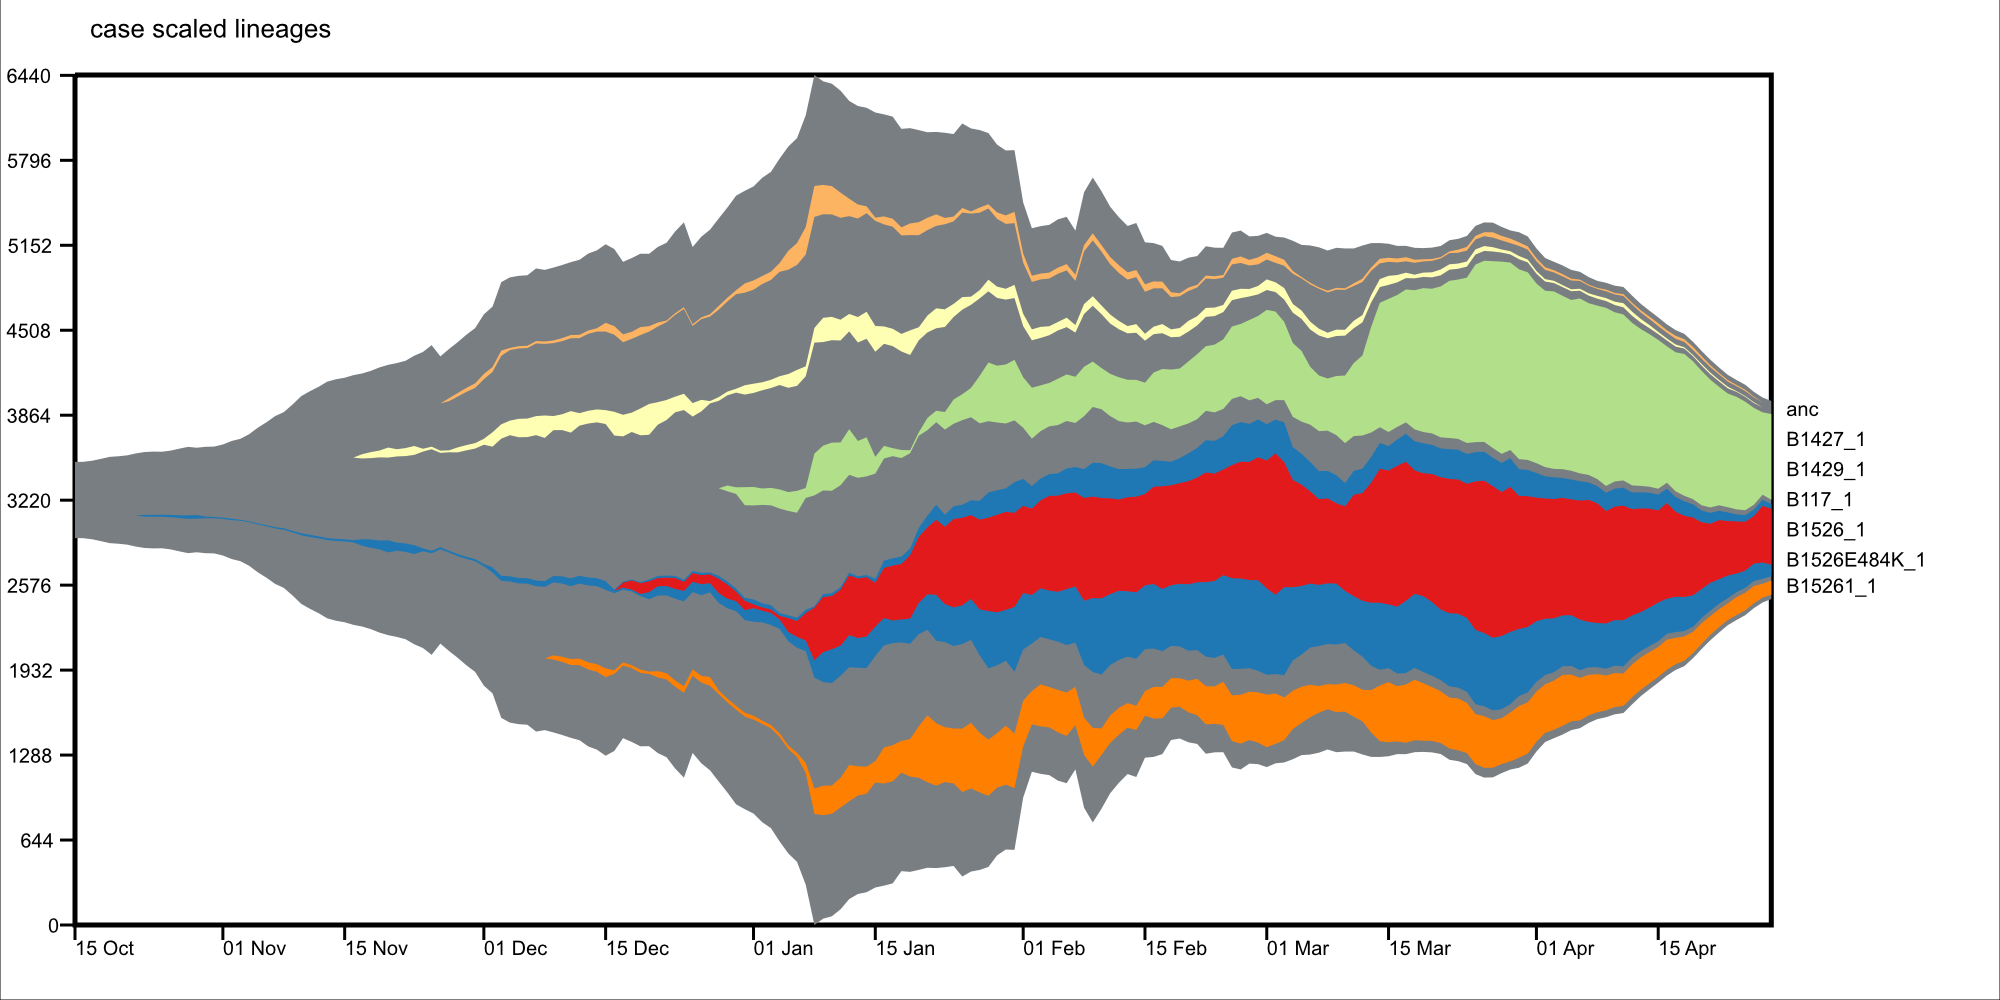
Visualize lineages overtime, with phylogentic context, based on viral genomes

Project description
epiMuller README
About
Author
Jennifer L. Havens
Purpose
Visualize lineages overtime, with phylogentic context, based on viral genomes.
Language
Python3
Inputs
timetree, ancestral state reconstruction (Nextstain JSON file or annotated TreeTime nexus file), sample collection dates and, PANGO lineages (optional)
Workflow overview
- epimuller-parse (optional): parse fasta names with 'bar isodate' suffix into usable fasta and metadata files.
- epimuller: wrapper for epimuller-define and epimuller-draw.
- epimuller-define: assigns samples to clades based on ancestral reconstruction of specified aa mutations or trait (hierarchy), and counts number of samples in a clade withen each time frame (abundance).
- epimuller-draw: plots the frequency clades overtime, as specifed by abundance and hierarchy inputs from epimuller-define.
Source code avaliblity
Documentation avaliblity
Quick start
pip3 install epimuller

epimuller [-h] [-oDir OUTDIRECTORY] -oP OUTPREFIX
    (-n INNEXTSTRAIN | -a ANNOTATEDTREE) -m
    INMETA [-p INPANGOLIN] [--noPangolin]
    [-k TRAITOFINTERSTKEY]
    [-f TRAITOFINTERSTFILE] [-g GENEBOUNDRY]
    [-mut VOCLIST [VOCLIST ...]]
    [-t TIMEWINDOW]
    [-s STARTDATE] [-e ENDDATE] [-mt MINTIME]
    [-min MINTOTALCOUNT] [-c CASES_NAME]
    [--avgWindow AVGWINDOW]
    [-l {date,time,bimonthly}]
    [-lp {Right,Max,Start,End}] [--WIDTH WIDTH]
    [--HEIGHT HEIGHT] [--LEGENDWIDTH LEGENDWIDTH]
    [--MARGIN MARGIN] [--FONTSIZE FONTSIZE]
    [--LABELSHIFT LABELSHIFT]
SOME EXAMPLES
Examples for full run
To see steps used to prep files for these examples look at scripts/Example_CommandsFromScratch.txt on gitHub.
Visulize default aa mutation list
epimuller \
	-n inputData/GISAID_NYCPHL_04_29/02_nextstrainResults \
	-m inputData/GISAID_NYCPHL_04_29/gisaid_2021_04_30_00_rename.tsv \
	-oDir 03_results_NYCPHL_April29 \
	-oP 01_defaultAAList \
	-c inputData/CITY_US-NY_NYC_outbreakinfo_epidemiology_data_2021-04-30.tsv
Visulize a trait: lineage
epimuller \
	-n inputData/GISAID_NYCPHL_04_29/02_nextstrainResults \
	-m inputData/GISAID_NYCPHL_04_29/gisaid_2021_04_30_00_rename.tsv \
	-oDir 03_results_NYCPHL_April29 \
	-oP 02_pangolin \
	-c inputData/CITY_US-NY_NYC_outbreakinfo_epidemiology_data_2021-04-30.tsv \
	--traitOfInterstFile traits.json \
	--traitOfInterstKey lineage \
	-lp Max \
	-min 100 \
Visulize your own aa mutation list
epimuller \
	-n inputData/GISAID_NYCPHL_04_29/02_nextstrainResults \
	-m inputData/GISAID_NYCPHL_04_29/gisaid_2021_04_30_00_rename.tsv \
	-oDir 03_results_NYCPHL_April29 \
	-oP 03_selectedAA \
	-c inputData/CITY_US-NY_NYC_outbreakinfo_epidemiology_data_2021-04-30.tsv \
	-mut 'SE484K' 'S*452*' \
	-min 50 \
	-mt 20
Visulize default aa mutation list with TreeTime input
epimuller \
	-a inputData/GISAID_NYCPHL_04_29/06_treetimeDates_aa/timetree.nexus \
	-oDir 04_results_NYCPHL_April29 \
	-oP defaultAA_treetime \
	-m inputData/GISAID_NYCPHL_04_29/gisaid_2021_04_30_00_rename.tsv \
	-g data/geneAAboundries.json \
	--FONTSIZE 18
Visulize a trait: lineage with TreeTime input
epimuller \
	-a inputData/GISAID_NYCPHL_04_29/06_treetimeDates_aa/timetree.nexus \
	-oDir 03_results_NYCPHL_April29 \
	-oP 05_pangolin_treetime \
	-m inputData/GISAID_NYCPHL_04_29/gisaid_2021_04_30_00_rename.tsv \
	--traitOfInterstKey lineage \
	--noPangolin #does not label with mode of pangolin lineages in clade, label clade with defining lineage only
Known edge cases / featrues to add
Known edge cases which are not correctly dealt with or features I intend to address (eventually). If you run into anything else please let me know with an issue on gitHub.
	- feel free to ignore the undefined.svg that gets made - it is related to checking the size of the text to space out labels

	- allow combination of aa mutants, not just 1
	- define polytomy behavior
	- option for user defined col names in metadata
	- auto detect
Addtional features
Color
If you would like to specify color for clade: in --parentHierarchy_name file (of epimuller-draw/drawMuller.py input) add col with name: "color" and hex color value (starting with #) for clades you want to specify.
Parse GISAID fasta for metadata
epimuller-parse If you have downloaded sequences from GISAID under the search tab, you can parse out the names into a metadata file (format tested as of 2021-04-30).
epimuller arguments
epimuller [-h] [-oDir OUTDIRECTORY] -oP OUTPREFIX
    (-n INNEXTSTRAIN | -a ANNOTATEDTREE) -m
    INMETA [-p INPANGOLIN] [--noPangolin]
    [-k TRAITOFINTERSTKEY]
    [-f TRAITOFINTERSTFILE] [-g GENEBOUNDRY]
    [-mut VOCLIST [VOCLIST ...]]
    [-t TIMEWINDOW]
    [-s STARTDATE] [-e ENDDATE] [-mt MINTIME]
    [-min MINTOTALCOUNT] [-c CASES_NAME]
    [--avgWindow AVGWINDOW]
    [-l {date,time,bimonthly}]
    [-lp {Right,Max,Start,End}] [--WIDTH WIDTH]
    [--HEIGHT HEIGHT] [--LEGENDWIDTH LEGENDWIDTH]
    [--MARGIN MARGIN] [--FONTSIZE FONTSIZE]
    [--LABELSHIFT LABELSHIFT]

arguments:
  -h, --help            show this help message and exit
  -n INNEXTSTRAIN, --inNextstrain INNEXTSTRAIN
    nextstrain results with tree.nwk and
    [traitOfInterst].json (default: None)
  -a ANNOTATEDTREE, --annotatedTree ANNOTATEDTREE
    nexus file name with annotation:
    [&!traitOfInterst=value], as output by treetime
    (default: None)

Options for full repot:
  -oDir OUTDIRECTORY, --outDirectory OUTDIRECTORY
    folder for output (default: ./)
  -oP OUTPREFIX, --outPrefix OUTPREFIX
    prefix of out files withen outDirectory (default:
    None)

Options passed to epimuller-define:
  -m INMETA, --inMeta INMETA
    metadata tsv with 'strain' and 'date'cols, optional:
    cols of trait of interst; and pangolin col
    named:'pangolin_lineage', 'lineage' or 'pangolin_lin'
    (default: None)
  -p INPANGOLIN, --inPangolin INPANGOLIN
    pangolin output lineage_report.csv file, if argument
    not supplied looks in inMeta for col with
    'pangolin_lineage', 'pangolin_lin', or 'lineage'
    (default: metadata)
  --noPangolin          do not add lineage to clade names (default: False)
  -k TRAITOFINTERSTKEY, --traitOfInterstKey TRAITOFINTERSTKEY
    key for trait of interst in json file OR (if
    -a/--annotatedTree AND key is mutations with aa (not
    nuc): use 'aa_muts') (default: aa_muts)
  -f TRAITOFINTERSTFILE, --traitOfInterstFile TRAITOFINTERSTFILE
    [use with -n/--inNextstrain] name of
    [traitOfInterstFile].json in '-n/--inNextstrain'
    folder (default: aa_muts.json)
  -g GENEBOUNDRY, --geneBoundry GENEBOUNDRY
    [use with -a/--annotatedTree AND -k/--traitOfInterst
    aa_muts] json formated file specifing start end
    postions of genes in alignment for annotatedTree (see
    example data/geneAAboundries.json) (default: None)
  -mut VOCLIST [VOCLIST ...], --VOClist VOCLIST [VOCLIST ...]
    list of aa of interest in form
    [GENE][*ORAncAA][site][*ORtoAA] ex. S*501*, gaps
    represed by X, wild card aa represented by * (default:
    None)
  -t TIMEWINDOW, --timeWindow TIMEWINDOW
    number of days for sampling window (default: 7)
  -s STARTDATE, --startDate STARTDATE
    start date in iso format YYYY-MM-DD or 'firstDate'
    which sets start date to first date in metadata
    (default: 2020-03-01)
  -e ENDDATE, --endDate ENDDATE
    end date in iso format YYYY-MM-DD or 'lastDate' which
    sets end date as last date in metadata (default:
    lastDate)

Options passed to epimuller-draw:
  -mt MINTIME, --MINTIME MINTIME
    minimum time point to start plotting (default: 30)
  -min MINTOTALCOUNT, --MINTOTALCOUNT MINTOTALCOUNT
    minimum total count for group to be included (default:
    50)
  -c CASES_NAME, --cases_name CASES_NAME
    file with cases - formated with 'date' in ISO format
    and 'confirmed_rolling' cases, in tsv format (default:
    None)
  --avgWindow AVGWINDOW
    width of rolling mean window in terms of
    --timeWindow's (recomend using with small
    --timeWindow) ; default: sum of counts withen
    timeWindow (ie no average) (default: None)
  -l {date,time,bimonthly}, --xlabel {date,time,bimonthly}
    Format of x axis label: ISO date format or timepoints
    from start, or dd-Mon-YYYY on 1st and 15th (default:
    date)
  -lp {Right,Max,Start,End}, --labelPosition {Right,Max,Start,End}
    choose position of clade labels (default: Right)

Options passed to epimuller-draw for page setup:
  --WIDTH WIDTH         WIDTH of page (px) (default: 1500)
  --HEIGHT HEIGHT       HEIGHT of page (px) (default: 1000)
  --LEGENDWIDTH LEGENDWIDTH
    LEGENDWIDTH to the right of plotting area (px)
    (default: 220)
  --MARGIN MARGIN       MARGIN around all sides of plotting area (px)
    (default: 60)
  --FONTSIZE FONTSIZE
  --LABELSHIFT LABELSHIFT
    nudge label over by LABELSHIFT (px) (default: 15)
epimuller-define: make abundance and hiearchy files
epimuller-define  [-h] [-oDir OUTDIRECTORY] -oP OUTPREFIX
           (-n INNEXTSTRAIN | -a ANNOTATEDTREE) -m INMETA
           [-p INPANGOLIN] [--noPangolin]
           [-k TRAITOFINTERSTKEY] [-f TRAITOFINTERSTFILE]
           [-g GENEBOUNDRY] [-mut VOCLIST [VOCLIST ...]]
           [-t TIMEWINDOW]
           [-s STARTDATE] [-e ENDDATE]

optional arguments:
  -h, --help            show this help message and exit
  -oDir OUTDIRECTORY, --outDirectory OUTDIRECTORY
    folder for output (default: ./)
  -oP OUTPREFIX, --outPrefix OUTPREFIX
    prefix of out files withen outDirectory (default:
    None)
  -n INNEXTSTRAIN, --inNextstrain INNEXTSTRAIN
    nextstrain results with tree.nwk and
    [traitOfInterstFile].json (default: None)
  -a ANNOTATEDTREE, --annotatedTree ANNOTATEDTREE
    nexus file name with annotation:
    [&!traitOfInterstKey=value], as output by treetime
    (default: None)
  -m INMETA, --inMeta INMETA
    metadata tsv with 'strain' and 'date'cols, optional:
    col for [traitOfInterstKey]; and pangolin col named:
    'pangolin_lineage' 'lineage' or 'pangolin_lin'
    (default: None)
  -p INPANGOLIN, --inPangolin INPANGOLIN
    pangolin output lineage_report.csv file, if argument
    not supplied looks in inMeta for col with
    'pangolin_lineage', 'pangolin_lin', or 'lineage'
    (default: metadata)
  --noPangolin          do not add lineage to clade names (default: False)
  -k TRAITOFINTERSTKEY, --traitOfInterstKey TRAITOFINTERSTKEY
    key for trait of interst in json file OR (if
    -a/--annotatedTree AND key is mutations with aa (not
    nuc): use 'aa_muts') (default: aa_muts)
  -f TRAITOFINTERSTFILE, --traitOfInterstFile TRAITOFINTERSTFILE
    [use with -n/--inNextstrain] name of
    [traitOfInterstFile].json in '-n/--inNextstrain'
    folder (default: aa_muts.json)
  -g GENEBOUNDRY, --geneBoundry GENEBOUNDRY
    [use with -a/--annotatedTree AND -k/--traitOfInterst
    aa_muts] json formated file specifing start end
    postions of genes in alignment for annotatedTree (see
    example data/geneAAboundries.json) (default: None)
  -mut VOCLIST [VOCLIST ...], --VOClist VOCLIST [VOCLIST ...]
    list of aa of interest in form
    [GENE][*ORAncAA][site][*ORtoAA] ex. S*501*, gaps
    represented by X, wild card aa represented by *
    (default: None)
  -t TIMEWINDOW, --timeWindow TIMEWINDOW
    number of days for sampling window (default: 7)
  -s STARTDATE, --startDate STARTDATE
    start date in iso format YYYY-MM-DD or 'firstDate'
    which is in metadata (default: 2020-03-01)
  -e ENDDATE, --endDate ENDDATE
    end date in iso format YYYY-MM-DD or 'lastDate' which
    is in metadata (default: lastDate)
epimuller-draw: plot
epimuller-draw  [-h] -p PARENTHIERARCHY_NAME -a ABUNDANCE_NAME
    [-c CASES_NAME] [--avgWindow AVGWINDOW] -o OUTFOLDER
    [-mt MINTIME] [-min MINTOTALCOUNT]
    [-l {date,time,bimonthly}] [-lp {Right,Max,Start,End}]
    [--WIDTH WIDTH] [--HEIGHT HEIGHT]
    [--LEGENDWIDTH LEGENDWIDTH] [--LABELSHIFT LABELSHIFT]
    [--MARGIN MARGIN] [--FONTSIZE FONTSIZE]

arguments:
  -h, --help            show this help message and exit
  -p PARENTHIERARCHY_NAME, --parentHierarchy_name PARENTHIERARCHY_NAME
    csv output from mutationLinages_report.py with child
    parent col (default: None)
  -a ABUNDANCE_NAME, --abundance_name ABUNDANCE_NAME
    csv output from mutationLinages_report.py with
    abundances of clades (default: None)
  -c CASES_NAME, --cases_name CASES_NAME
    file with cases - formated with 'date' in ISO format
    and 'confirmed_rolling' cases, in tsv format (default:
    None)
  --avgWindow AVGWINDOW
    width of rolling mean window in terms of
    --timeWindow's (recomend using with small
    --timeWindow) ; default: sum of counts withen
    timeWindow (ie no average) (default: None)
  -o OUTFOLDER, --outFolder OUTFOLDER
    csv output from mutationLinages_report.py with child
    parent col (default: None)
  -mt MINTIME, --MINTIME MINTIME
    minimum time point to start plotting (default: 30)
  -min MINTOTALCOUNT, --MINTOTALCOUNT MINTOTALCOUNT
    minimum total count for group to be included (default:
    50)
  -l {date,time,bimonthly}, --xlabel {date,time,bimonthly}
    Format of x axis label: ISO date format or timepoints
    from start, or dd-Mon-YYYY on 1st and 15th (default:
    date)
  -lp {Right,Max,Start,End}, --labelPosition {Right,Max,Start,End}
    choose position of clade labels (default: Right)

Options for page setup:
  --WIDTH WIDTH         WIDTH of page (px) (default: 1500)
  --HEIGHT HEIGHT       HEIGHT of page (px) (default: 1000)
  --LEGENDWIDTH LEGENDWIDTH
    LEGENDWIDTH to the right of plotting area (px)
    (default: 220)
  --LABELSHIFT LABELSHIFT
    nudge label over by LABELSHIFT (px) (default: 15)
  --MARGIN MARGIN       MARGIN around all sides of plotting area (px)
    (default: 60)
  --FONTSIZE FONTSIZE
Install methods
With Bioconda
conda install -c bioconda epimuller
With pip
pip3 install epimuller

#If there is an issue with cairo, try:

pip3 install pycairo
pip3 install epimuller
From source
Download source code from gitHub or pypi
#open as needed for download format
tar -zxvf epimuller-[version].tar.gz

cd epimuller-[version]

python3 setup.py install
Run scripts directly
Note you will have to install all dependencies.
Download source code from gitHub or pypi
#open as needed for download format
tar -zxvf epimuller-[version].tar.gz

cd epimuller-[version]

#to run epimuller
python3 ./scripts/mutationLinages_report.py [arugments]

#to run epimuller-parse
python3 ./scripts/parseFastaNames.py  [arugments]

#to run epimuller-define
python3 ./scripts/defineAndCountClades.py  [arugments]

#to run epimuller-draw
python3 ./scripts/drawMuller.py  [arugments]
Citation
Please link to this github if you have used epimuller in your research.
Extra notes on GISAID
If you do use GISAID data please acknowledge the contributers, such as with language suggested by GISAID.


Download files
Download the file for your platform. If you're not sure which to choose, learn more about installing packages.
Source Distribution
Built Distribution
Filter files by name, interpreter, ABI, and platform.
If you're not sure about the file name format, learn more about wheel file names.
Copy a direct link to the current filters
File details
Details for the file epimuller-0.0.8.tar.gz.
File metadata
- Download URL: epimuller-0.0.8.tar.gz
- Upload date:
- Size: 57.0 kB
- Tags: Source
- Uploaded using Trusted Publishing? No
- Uploaded via: twine/3.4.1 importlib_metadata/4.0.1 pkginfo/1.7.0 requests/2.25.1 requests-toolbelt/0.9.1 tqdm/4.60.0 CPython/3.7.10
File hashes
| Algorithm | Hash digest | |
|---|---|---|
| SHA256 |
b02a8625e95d2a6f7c8f5e26020710ce31431e4599d3165af64fa3922a8f77fe
|
|
| MD5 |
03328a87ebfbfb7b40c186bf62f01f70
|
|
| BLAKE2b-256 |
c7b05338475c50b72b0d6f3d8e4b2cba06fab692f6a2caf018ffb09c4e43af89
|
File details
Details for the file epimuller-0.0.8-py3-none-any.whl.
File metadata
- Download URL: epimuller-0.0.8-py3-none-any.whl
- Upload date:
- Size: 28.9 kB
- Tags: Python 3
- Uploaded using Trusted Publishing? No
- Uploaded via: twine/3.4.1 importlib_metadata/4.0.1 pkginfo/1.7.0 requests/2.25.1 requests-toolbelt/0.9.1 tqdm/4.60.0 CPython/3.7.10
File hashes
| Algorithm | Hash digest | |
|---|---|---|
| SHA256 |
704466e6e1749e5e0c01be4c77ab4764c4cdfcc6aea64cd534737ae4d95aaefd
|
|
| MD5 |
4bb26af70ac45e5ea06376fb868a5993
|
|
| BLAKE2b-256 |
68b65f14c047de0d8e28116b99bba29a65e86dd433798c467a56c5a64cb0c796
|


