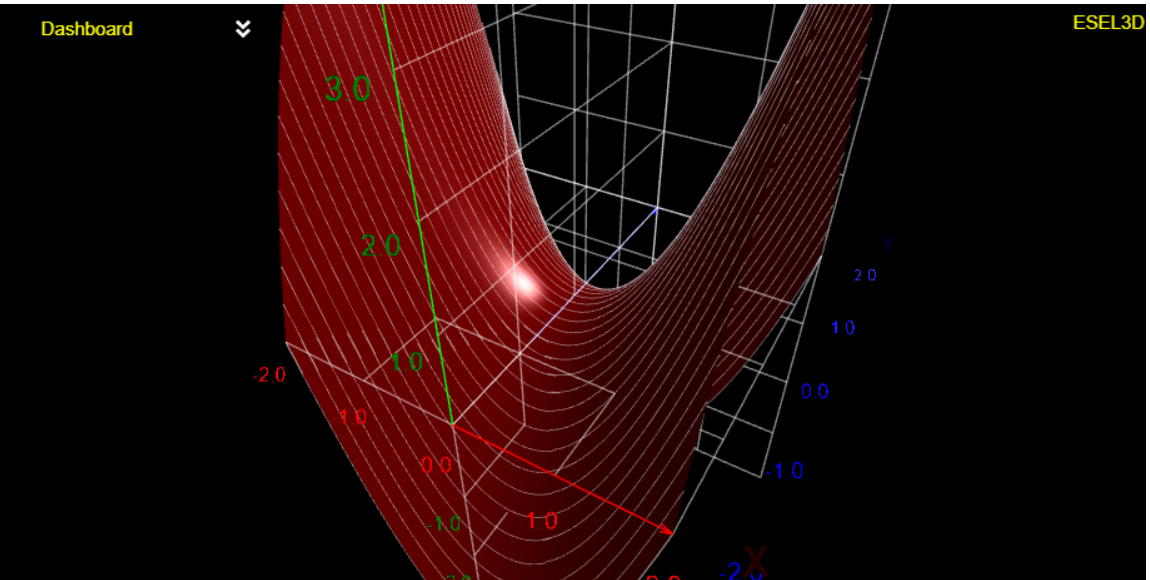
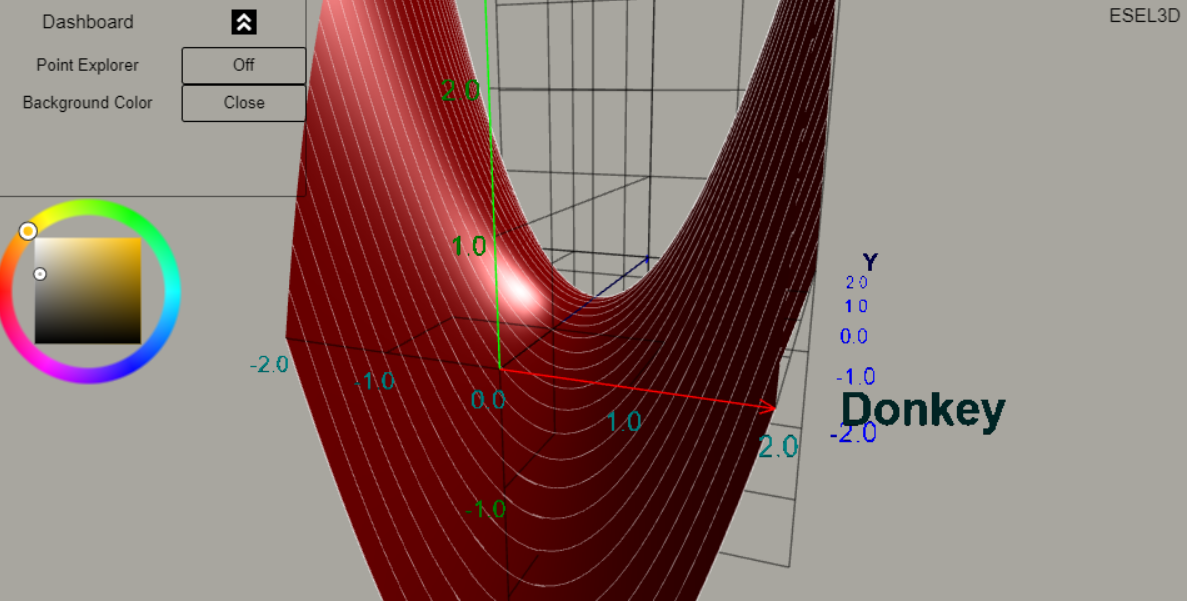
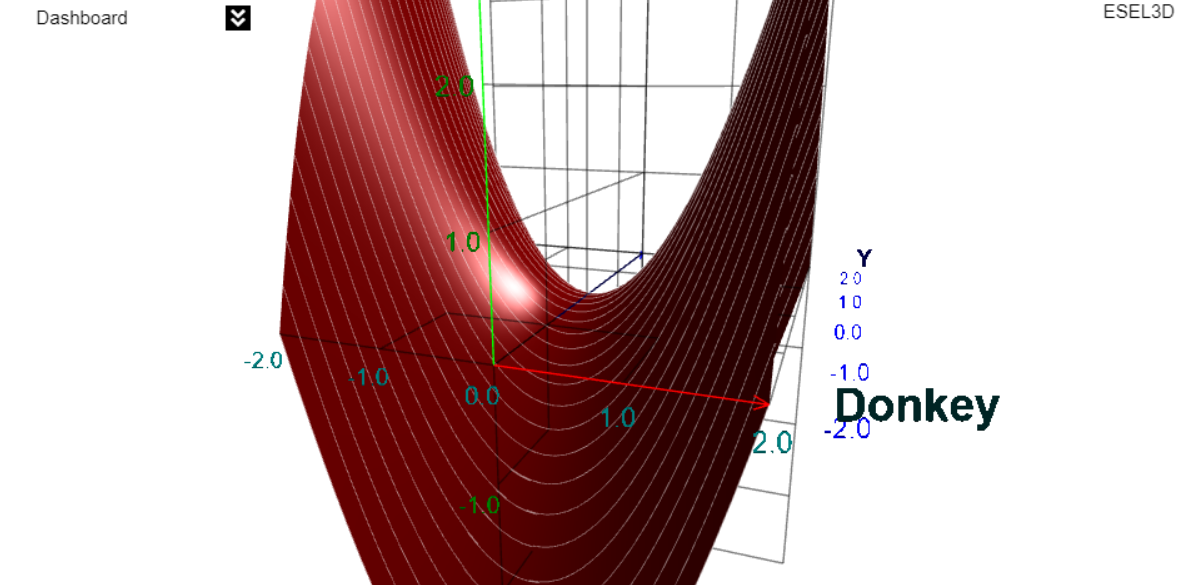
A 3D plotter for Google Colab and Jupyter Notebook
Project description
esel3d
Esel3D is an interactive playground to visualize math in three spatial dimensions. It is a 3D plotter for curves, surfaces, shapes and more. The redering uses BabylonJS game engine to produce vibrant visuals and provides intuitive controls right inside a Jupyter or Google Colab cell.
Navigate
Explore and view the plot from all angles in 3D space.
Configurate
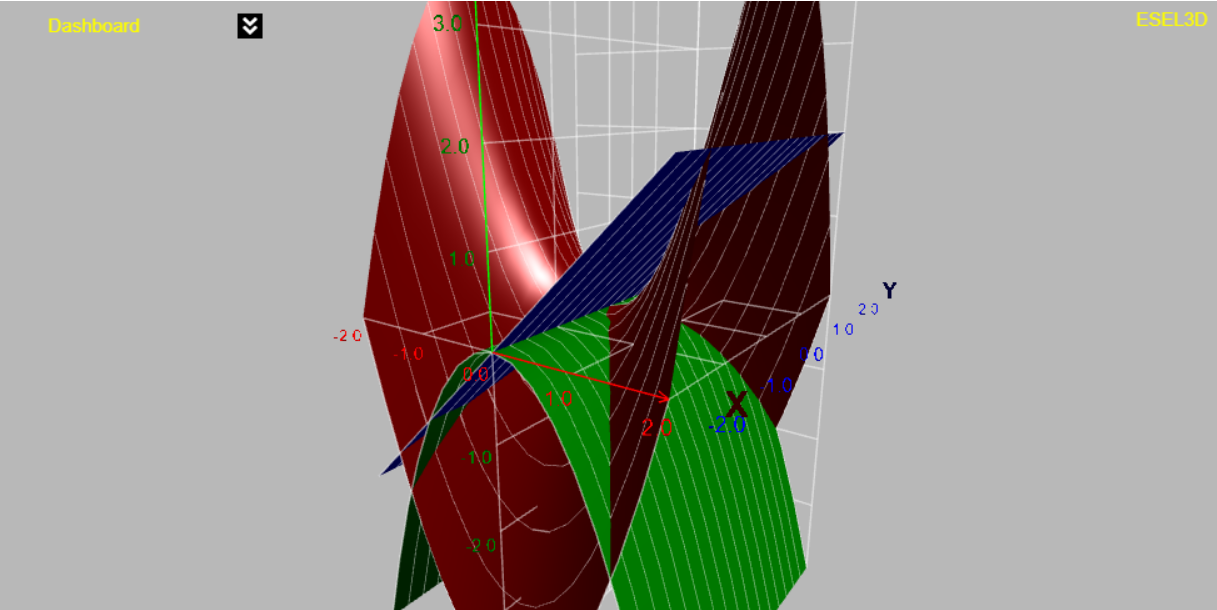
Add custom labels. Change the color scheme of the axis. Chose the background color which is the most appealing. Plot up to 3 sufaces.
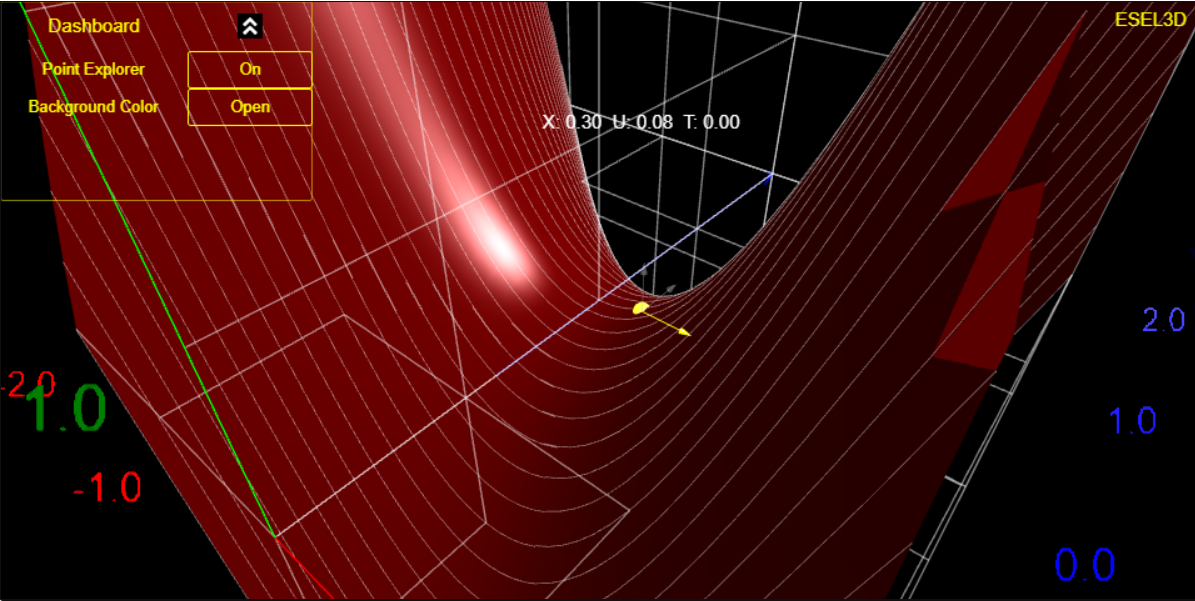
Inspect
With the point explorer gizmo, users can view point location.
Tutorials and Examples
Tuts and examples will be provided in the form of YouTube videos with accompanying example notebooks.
TODO
- Add animation option
- Make 3D cylindrical grid
- Make 3D polar grid
- Make vector field plot
Project details
Release history Release notifications | RSS feed
Download files
Download the file for your platform. If you're not sure which to choose, learn more about installing packages.


