
ExecTiming
An advanced timer for Python that makes it easy to determine execution times.
Python has a built-in package named timeit which provides a way to
"Measure execution time of small code snippets." It can be great for quick
tests, but lacks more expansive features like curve fitting, statistical information,
and the ability to use in existing projects. ExecTiming seeks to change that by
including most of the features of timeit and adding many more like decorators,
argument calling and replacement, best-fit-curve determination, and in-project use.
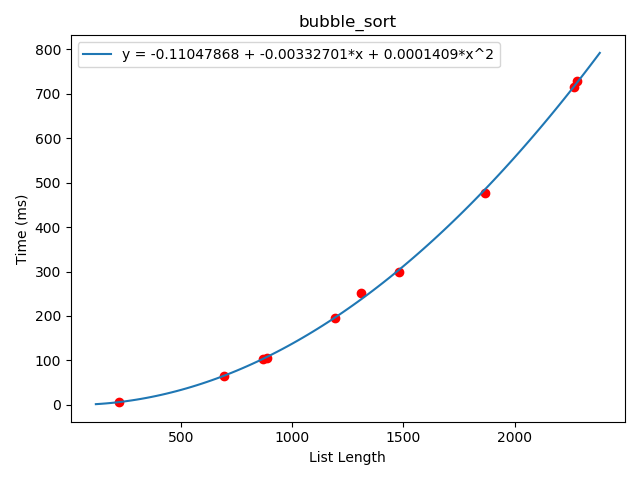
Features
StaticTimerwhich provides the ability to time functions via a decorator, strings, or just seeing the amount of time elapsed between a call to.start_elapsed()andelapsed()Timerwhich gives a way to log measured times and then display statistical data, perform curve-fitting for functions with parameters as the independent variables and the measured time as the dependent variable, and all the features the StaticTimer has.- All output can be re-directed by changing
output_stream, which can be any file-like object or anything with a.write()method. - A wrapper for
logging.infoandlogging.debugis included to redirect output to those sources - Measured times can be displayed in seconds
s, millisecondsms, microsecondsus, or nanosecondsns. - The same block can be executed multiple times to get a more accurate reading.
This is done by setting
iterations_per_run. After that many iterations, the elapsed time is measured. - Multiple runs can be carried out and averaged to remove outlying results.
Wiki
Glossary
Installation
pip install exectiming
For full functionality:
scipy- for best-fit-curvescikit-learn- for best-fit-curvenumpy- for best-fit-curvematplotlib- for plotting
However, basic functionality will still exist even if those dependencies aren't found
Static decorate
from exectiming.exectiming import StaticTimer
from random import randint

@StaticTimer.decorate(runs=5, average_runs=False, call_callable_args=True, log_arguments=True)
def factorial(n):
    if n == 1:
        return 1
    else:
        return n * factorial.__wrapped__(n-1)

factorial(lambda: randint(3, 40))
#    0.01663 ms - factorial(33) ... [runs=  1, iterations=  1] | Run 1
#    0.00544 ms - factorial(19) ... [runs=  1, iterations=  1] | Run 2
#    0.00736 ms - factorial(28) ... [runs=  1, iterations=  1] | Run 3
#    0.00448 ms - factorial(17) ... [runs=  1, iterations=  1] | Run 4
#    0.01087 ms - factorial(38) ... [runs=  1, iterations=  1] | Run 5
- Functions, even recursive ones, can be wrapped so that any time they are called they get timed
- You can replace arguments with functions which can be automatically called and the argument replaced
to allow testing like shown above,
call_callable_args=True - Arguments show up in the output to provide more information,
log_arguments=True
Static time_it
from exectiming.exectiming import StaticTimer

StaticTimer.time_it("pow(2, 64)", runs=10, iterations_per_run=10000)
#  107.10668 ms - pow(2, 64) ... [runs= 10, iterations=10000]

StaticTimer.time_it("2**64", runs=10, iterations_per_run=10000)
#   68.75266 ms - 2**64 ... [runs= 10, iterations=10000]

StaticTimer.time_it("1<<64", runs=10, iterations_per_run=10000)
#   65.53690 ms - 1<<64 ... [runs= 10, iterations=10000]
- Strings can be timed
- Multiple runs can be measured then averaged together to get a more accurate result
- Anything needed names can be passed in by setting
globals=,locals=, orsetup=. The first two must be maps of names to objects. The second is a string that is executed once because the stringblockis timed.
time_it can be used to re-write the decorator above example like so:
StaticTimer.time_it(factorial, lambda: randint(3, 40), call_callable_args=True, average_runs=False, runs=5, log_arguments=True)
Assume
from exectiming.exectiming import Timer
timer = Timer()
Transformers, statistics, and best fit
@timer.decorate(runs=5, log_arguments=True, call_callable_args=True)
def bubble_sort(array):
    while True:
        switched = False
        for i in range(0, len(array)-1):
            if array[i] > array[i+1]:
                array[i], array[i+1] = array[i+1], array[i]
                switched = True

        if not switched:
            break

    return array

bubble_sort(lambda: [randint(0, 1000) for _ in range(randint(100, 5000))])

timer.output(split_index="bubble_sort", transformers={0: len})
# bubble_sort:
#     1333.19493 ms - bubble_sort(2141) ... [runs=  1, iterations=  1]
#     1413.75243 ms - bubble_sort(2546) ... [runs=  1, iterations=  1]
#     4247.70385 ms - bubble_sort(4530) ... [runs=  1, iterations=  1]
#       34.01533 ms - bubble_sort(421)  ... [runs=  1, iterations=  1]
#      675.07202 ms - bubble_sort(1752) ... [runs=  1, iterations=  1]

timer.statistics()
# bubble_sort[runs=5, total=7703.73856 ms]:
#      Min | Max | Average = 34.01533 | 4247.70385 | 1540.74771 ms
#       Standard Deviation = 1442.66797 ms
#                 Variance = 2081.29087 ms

print(timer.best_fit_curve(transformers=len))
# ('Polynomial', {'a': 2.8042911992314363e-07, 'b': -9.670141667209306e-05, 'c': 0.024305228337961525})
Timerstores the output until requested- Function parameters can be transformed in the output. In the above example,
transformers={0: len}indicates that the positional argument at index0should have its value in the output replaced by the result of calling the function with that parameter. The output otherwise would have been something likebubble_sort([1, 2, 3, 4, 5, ...]) transformers=lenis also valid as all of the arguments can be transformed withlen, so there is no need to specify which index/key the function should be used for.- Basic statistics can be displayed
- A best-fit-curve can be determined. To use this, all logged function parameters must be integers. In this case, one was an a list, so it was transformed so that the analysis was done on the length of the list, instead of the list itself.
- The resulting best fit curve is, if
x=len(list),y = ax^2 + bx + c. We can extrapolate execution time using this curve to determine how long it would take to sort a list of lengthx=10000, which would be0.0000002804*10000^2 - 0.0000967*10000 + 0.0243. That is27.10 sor27100 ms
Plotting factorial
@timer.decorate(runs=100, iterations_per_run=10, call_callable_args=True, log_arguments=True)
def factorial(n):
    if n == 1:
        return 1
    else:
        return n * factorial.__wrapped__(n-1)

factorial(lambda: randint(1, 100))
timer.plot(plot_curve=True, time_unit=timer.US, equation_rounding=5)
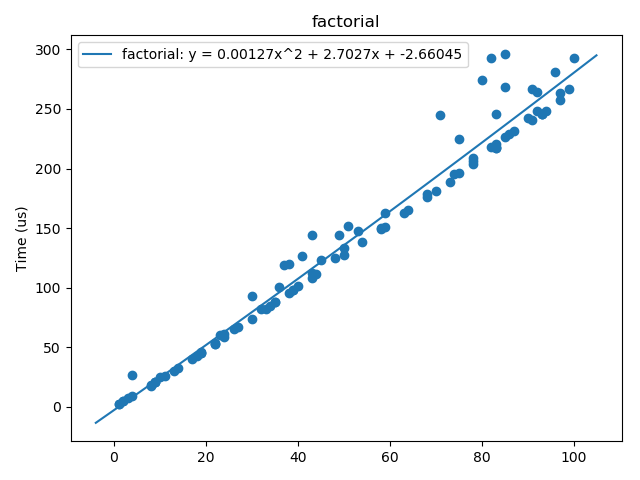
.plot()provides a quick way to plot the measured times against an argument that is the independent variable- The best fit curve and equation can be automatically determined and added
by setting
plot_curve=True
Plotting bubble_sort
# using bubble_sort from above, just with runs=10

bubble_sort(lambda: [randint(0, 100) for _ in range(randint(100, 2500))])
curve = timer.best_fit_curve(transformers=len)
timer.plot(transformer=len, plot_curve=True, curve=curve, x_label="List Length")
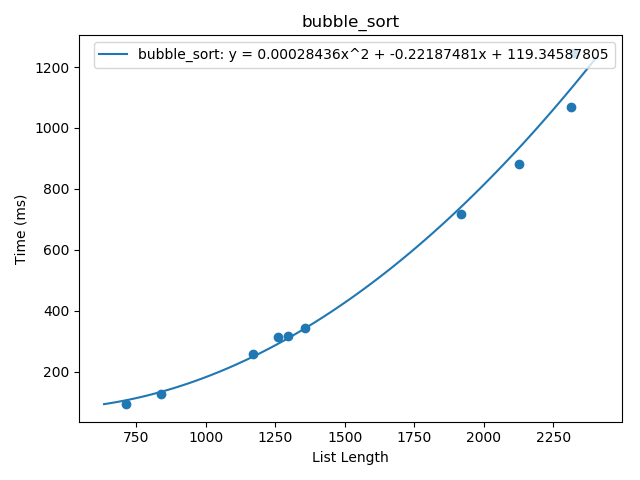
- The curve can be determined beforehand and then passed into
plot() plot()needstransformer=lenbecause the independent and dependent variables must be integers, solenis used to make it it one
Plotting binary_search
@timer.decorate(runs=100, iterations_per_run=5, log_arguments=True, call_callable_args=True)
def binary_search(sorted_array, element):
    lower, upper = 0, len(sorted_array)
    middle = upper // 2

    while middle >= lower and middle != upper:
        if element == sorted_array[middle]:
            return middle
        elif element > sorted_array[middle]:
            lower = middle + 1  # lower must be beyond middle because the middle wasn't right
        else:
            upper = middle - 1  # upper must be lower than the middle because the middle wasn't right

        middle = (upper + lower) // 2

    return None  # couldn't find it

binary_search(lambda: [i for i in range(randint(0, 10000))], lambda: randint(0, 10000))
timer.plot(plot_curve=True, curve=timer.best_fit_curve(exclude={1}, transformers=len), key=0,
           transformer=len, time_unit=timer.US, x_label="List Length", equation_rounding=4,
           title="Binary Search - Random Size, Random Element")
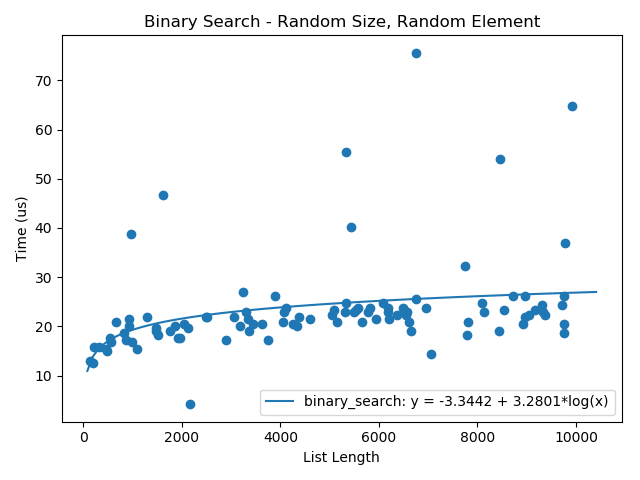
binary_search()takes two arguments, sobest_fit_curveis set to ignore the second one, at index 1, and to transform the argument at index 0 usinglen- Once the curve is determined, the split must be plotted. Again, there are
two arguments, so
key=0says to use the first as the independent variable andtransformer=lenwill transform the list into an integer - Additionally, the title and x-axis labels are specified and rounding set lower
- The equation displayed on the plot uses the timescale specified by
time_unit
Plotting multiple splits
from exectiming.exectiming import Timer
from random import randint


timer = Timer()


def bubble_sort(array):
    while True:
        switched = False
        for i in range(0, len(array)-1):
            if array[i] > array[i+1]:
                array[i], array[i+1] = array[i+1], array[i]
                switched = True

        if not switched:
            break

    return array


def selection_sort(array):
    for i in range(len(array) - 1):
        # find min
        min_i = i
        for j in range(i+1, len(array)):
            if array[j] < array[min_i]:
                min_i = j

        # swap
        array[i], array[min_i] = array[min_i], array[i]

    return array


timer.time_it(bubble_sort, lambda: [randint(0, 1000) for _ in range(randint(100, 3000))], call_callable_args=True,
              log_arguments=True, runs=10)
timer.time_it(selection_sort, lambda: [randint(0, 1000) for _ in range(randint(100, 3000))], call_callable_args=True,
              log_arguments=True, runs=10)
timer.time_it(sorted, lambda: [randint(0, 1000) for _ in range(randint(100, 3000))], call_callable_args=True,
              log_arguments=True, runs=10)


bubble_sort_curve = timer.best_fit_curve("bubble_sort", transformers=len)
selection_sort_curve = timer.best_fit_curve("selection_sort", transformers=len)
sorted_curve = timer.best_fit_curve("sorted", transformers=len)

timer.plot("bubble_sort", plot_curve=True, curve=bubble_sort_curve, multiple=True, transformer=len)
timer.plot("selection_sort", plot_curve=True, curve=selection_sort_curve, multiple=True, transformer=len)
timer.plot("sorted", plot_curve=True, curve=sorted_curve, title="Sorting Algorithms", x_label="List Length",
           transformer=len)
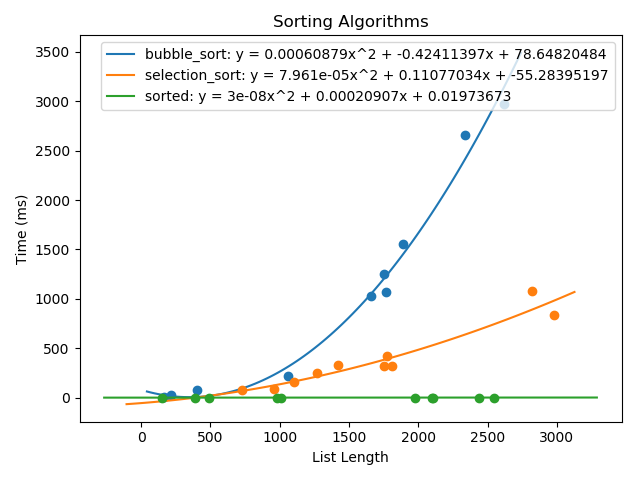
- Multiple splits and curves can be plotted by setting
multiple=Truefor all but the last call to.plot(). title,x_label, andy_labelof the last call will be used
TODO
- Add parameter checking to
.plot()and.best_fit_curve()to make sure arguments are integers to avoid difficult to decipher errors - Change
.best_fit_curve()to allowtransformersto be a callable - Change
.output()to not requiresplit_indexiftransformers={0:len}. Allowtransformersto be just a function, if there is only one argument, or a map or a map of a map. - Change
.sort_runs()to reflect that values don't have to be integers, they just have to be comparable. If they aren't, then a transformer is needed. This change is mainly cosmetic. (BJ - nothing actually needed changed) - Add
.predict(params, arguments)toTimer. Should basically be a pass-through call to.calculate_point()on the correct best-fit-curve - Collapse
exclude_argsandexclude_kwargsdown into justexclude. The difference between positional and keyword arguments can be determined as int vs. str. - Change how coefficients are returned for
BestFitLinear, maybe use xindex/key - Add context manager
- Make scipy, numpy, and scikit-learn optional, just prohibit
best_fit_curveif they aren't there - Add graphing feature with matplotlib, Linear will only be graphed if there is a single argument
- Add the ability to sort runs so they are display in some sort of order. Maybe allow sorting by time or by an argument
1 maintainer

Metadata
1 maintainer
Release files for exectiming 2.0.1
For a detailed explanation of source distributions (sdists) and built distributions (wheels), please see the package formats documentation.
Source distribution (sdist)
| File | Size | Uploaded | Provenance | Actions |
|---|---|---|---|---|
| exectiming-2.0.1.tar.gz | 26.6 kB | Without provenance | Details for exectiming-2.0.1.tar.gz |
Built distribution (wheel)
| File | Interpreter | ABI | Platform | Actions Reset |
|---|---|---|---|---|
| exectiming-2.0.1-py3-none-any.whl | Python 3 | none | any | Details for exectiming-2.0.1-py3-none-any.whl |
Total release size: 63.5 kB
Release files / exectiming-2.0.1.tar.gz
| Download URL | exectiming-2.0.1.tar.gz |
|---|---|
| Size | 26.6 kB |
| Tags | Source |
|
SHA-256 checksum How to use checksums |
5027d7d7e0581de4b7a11c8ab50e539e22d6ed646a4119ee3b71aac44fe33590
|
|
BLAKE2b-256 checksum How to use checksums |
7a579953097cda02c03d09b19159b75388e55b06b2ea7f8651d8c83f118e255f
|
| Upload date | |
|
Uploaded using Trusted Publishing? What is trusted publishing? |
No |
| Uploaded via |
twine/1.13.0 pkginfo/1.5.0.1 requests/2.19.1 setuptools/41.0.1 requests-toolbelt/0.9.1 tqdm/4.32.1 CPython/3.7.0
|
Release files / exectiming-2.0.1-py3-none-any.whl
| Download URL | exectiming-2.0.1-py3-none-any.whl |
|---|---|
| Size | 36.9 kB |
| Tags | Python 3 |
|
SHA-256 checksum How to use checksums |
afb0987c5986efad97c493f882b939dd1820b9e931f9e2e3b5b231050b47bc3a
|
|
BLAKE2b-256 checksum How to use checksums |
204f274fada4f50ba937a6f0bb222cf6febd0ffc3c2ff8e9683e823a55805146
|
| Upload date | |
|
Uploaded using Trusted Publishing? What is trusted publishing? |
No |
| Uploaded via |
twine/1.13.0 pkginfo/1.5.0.1 requests/2.19.1 setuptools/41.0.1 requests-toolbelt/0.9.1 tqdm/4.32.1 CPython/3.7.0
|
Security for exectiming 2.0.1
Provenance
Provenance describes where a file came from. On PyPI, provenance is shared via attestations, which provide a verifiable record of the build or publishing details. View details, limitations and caveats.
No provenance found
None of the files in this release were uploaded with provenance metadata.
A note on package security
PyPI is a repository for distributing packages, not a service for auditing them. While third-party security researchers and our staff do their best to detect and remove malicious packages, PyPI cannot guarantee the quality, security or suitability of any given package.
To learn more about protecting yourself from malicious actors, visit our package security documentation.














