
- fgivenx:
Functional Posterior Plotter
- Version:
- 2.5.2
- Homepage:
- Documentation:







Description
fgivenx is a python package for plotting posteriors of functions. It is currently used in astronomy, but will be of use to any scientists performing Bayesian analyses which have predictive posteriors that are functions.
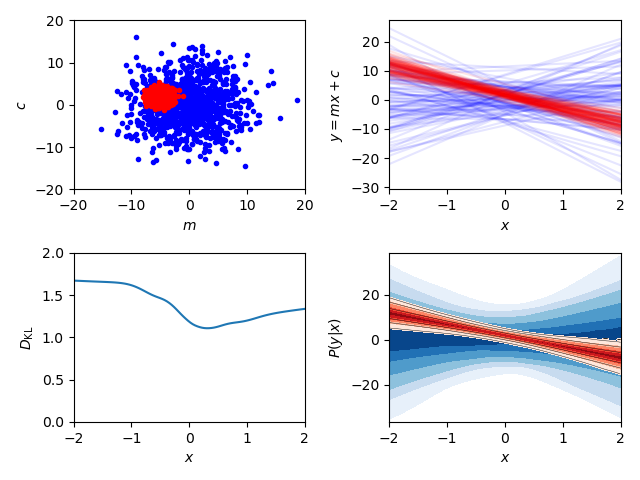
This package allows one to plot a predictive posterior of a function, dependent on sampled parameters. We assume one has a Bayesian posterior Post(theta|D,M) described by a set of posterior samples {theta_i}~Post. If there is a function parameterised by theta y=f(x;theta), then this script will produce a contour plot of the conditional posterior P(y|x,D,M) in the (x,y) plane.
The driving routines are fgivenx.plot_contours, fgivenx.plot_lines and fgivenx.plot_dkl. The code is compatible with getdist, and has a loading function provided by fgivenx.samples_from_getdist_chains.
Getting Started
Users can install using pip:
pip install fgivenxfrom source:
git clone https://github.com/handley-lab/fgivenx
cd fgivenx
pip install .
or for those on Arch linux it is available on the AUR
You can check that things are working by running the test suite (You may encounter warnings if the optional dependency joblib is not installed):
pip install .[test]
export MPLBACKEND=Agg
pytest
Check the dependencies listed in the next section are installed. You can then use the fgivenx module from your scripts.
Some users of OSX or Anaconda may find QueueManagerThread errors if Pillow is not installed (run pip install pillow).
If you want parallelisation (joblib), progress bars (tqdm) or getdist compatibility (getdist), install the relevant optional dependencies:
pip install .[parallel,progress_bar,getdist_chains]To install everything (all optional extras plus docs and test dependencies), use the dev extra:
pip install .[dev]You may encounter warnings if you don’t have the optional dependency joblib installed.
Dependencies
Basic requirements:
Python 3.10+
Documentation:
Tests:
Optional extras:
Documentation
Full Documentation is hosted at ReadTheDocs. To build your own local copy of the documentation you’ll need to install sphinx. You can then run:
cd docs
make html
Citation
If you use fgivenx to generate plots for a publication, please cite as:
Handley, (2018). fgivenx: A Python package for functional posterior
plotting . Journal of Open Source Software, 3(28), 849,
https://doi.org/10.21105/joss.00849
or using the BibTeX:
@article{fgivenx,
    doi = {10.21105/joss.00849},
    url = {http://dx.doi.org/10.21105/joss.00849},
    year  = {2018},
    month = {Aug},
    publisher = {The Open Journal},
    volume = {3},
    number = {28},
    author = {Will Handley},
    title = {fgivenx: Functional Posterior Plotter},
    journal = {The Journal of Open Source Software}
}
Example Usage
Plot user-generated samples
import numpy
import matplotlib.pyplot as plt
from fgivenx import plot_contours, plot_lines, plot_dkl


# Model definitions
# =================
# Define a simple straight line function, parameters theta=(m,c)
def f(x, theta):
    m, c = theta
    return m * x + c


numpy.random.seed(1)

# Posterior samples
nsamples = 1000
ms = numpy.random.normal(loc=-5, scale=1, size=nsamples)
cs = numpy.random.normal(loc=2, scale=1, size=nsamples)
samples = numpy.array([(m, c) for m, c in zip(ms, cs)]).copy()

# Prior samples
ms = numpy.random.normal(loc=0, scale=5, size=nsamples)
cs = numpy.random.normal(loc=0, scale=5, size=nsamples)
prior_samples = numpy.array([(m, c) for m, c in zip(ms, cs)]).copy()

# Set the x range to plot on
xmin, xmax = -2, 2
nx = 100
x = numpy.linspace(xmin, xmax, nx)

# Set the cache
cache = 'cache/test'
prior_cache = cache + '_prior'

# Plotting
# ========
fig, axes = plt.subplots(2, 2)

# Sample plot
# -----------
ax_samples = axes[0, 0]
ax_samples.set_ylabel(r'$c$')
ax_samples.set_xlabel(r'$m$')
ax_samples.plot(prior_samples.T[0], prior_samples.T[1], 'b.')
ax_samples.plot(samples.T[0], samples.T[1], 'r.')

# Line plot
# ---------
ax_lines = axes[0, 1]
ax_lines.set_ylabel(r'$y = m x + c$')
ax_lines.set_xlabel(r'$x$')
plot_lines(f, x, prior_samples, ax_lines, color='b', cache=prior_cache)
plot_lines(f, x, samples, ax_lines, color='r', cache=cache)

# Predictive posterior plot
# -------------------------
ax_fgivenx = axes[1, 1]
ax_fgivenx.set_ylabel(r'$P(y|x)$')
ax_fgivenx.set_xlabel(r'$x$')
cbar = plot_contours(f, x, prior_samples, ax_fgivenx,
                     colors=plt.cm.Blues_r, lines=False,
                     cache=prior_cache)
cbar = plot_contours(f, x, samples, ax_fgivenx, cache=cache)

# DKL plot
# --------
ax_dkl = axes[1, 0]
ax_dkl.set_ylabel(r'$D_\mathrm{KL}$')
ax_dkl.set_xlabel(r'$x$')
ax_dkl.set_ylim(bottom=0, top=2.0)
plot_dkl(f, x, samples, prior_samples, ax_dkl,
         cache=cache, prior_cache=prior_cache)


ax_lines.sharex(ax_fgivenx)
ax_dkl.sharex(ax_fgivenx)
ax_lines.sharey(ax_fgivenx)
ax_fgivenx.sharey(ax_samples)

fig.tight_layout()
fig.savefig('plot.png')
Plot GetDist chains
import numpy
import matplotlib.pyplot as plt
from fgivenx import plot_contours, samples_from_getdist_chains

file_root = './plik_HM_TT_lowl/base_plikHM_TT_lowl'
samples, weights = samples_from_getdist_chains(['logA', 'ns'], file_root)

def PPS(k, theta):
    logA, ns = theta
    return logA + (ns - 1) * numpy.log(k)

k = numpy.logspace(-4,1,100)
cbar = plot_contours(PPS, k, samples, weights=weights)
cbar = plt.colorbar(cbar,ticks=[0,1,2,3])
cbar.set_ticklabels(['',r'$1\sigma$',r'$2\sigma$',r'$3\sigma$'])

plt.xscale('log')
plt.ylim(2,4)
plt.ylabel(r'$\ln\left(10^{10}\mathcal{P}_\mathcal{R}\right)$')
plt.xlabel(r'$k / {\rm Mpc}^{-1}$')
plt.tight_layout()
plt.savefig('planck.png')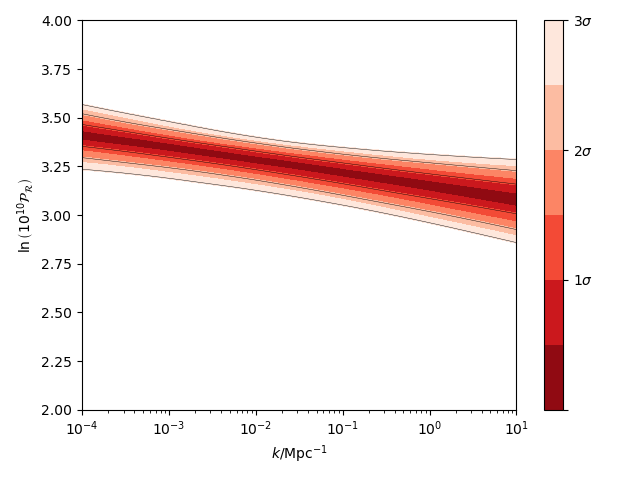
Contributing
Want to contribute to fgivenx? Awesome! There are many ways you can contribute via the GitHub repository, see below.
Opening issues
Open an issue to report bugs or to propose new features.
Proposing pull requests
Pull requests are very welcome. Note that if you are going to propose drastic changes, be sure to open an issue for discussion first, to make sure that your PR will be accepted before you spend effort coding it.
Changelog
- v2.2.0:
Paper accepted
- v2.1.17:
100% coverage
- v2.1.16:
Tests fixes
- v2.1.15:
Additional plot tests
- v2.1.13:
Further bug fix in test suite for image comparison
- v2.1.12:
Bug fix in test suite for image comparison
- v2.1.11:
Documentation upgrades
- v2.1.10:
Added changelog
Metadata
Release files for fgivenx 2.5.2
For a detailed explanation of source distributions (sdists) and built distributions (wheels), please see the package formats documentation.
Source distribution (sdist)
| File | Size | Uploaded | |
|---|---|---|---|
| fgivenx-2.5.2.tar.gz | 24.0 kB | Details |
Built distribution (wheel)
| File | Interpreter | ABI | Platform | Reset |
|---|---|---|---|---|
| fgivenx-2.5.2-py3-none-any.whl | Python 3 | none | any | Details |
Total release size: 50.8 kB
Release files / fgivenx-2.5.2.tar.gz
| Download URL | fgivenx-2.5.2.tar.gz |
|---|---|
| Size | 24.0 kB |
| Tags | Source |
|
SHA-256 checksum How to use checksums |
0e2ce781d4022337c6a5676f9aa050c6de12461cef0a8f1f721952a14c7f91bd
|
|
BLAKE2b-256 checksum How to use checksums |
a65ae4fed4aeabfd6f478547f9ccf930ac8bdadced6c4b5e47fdae30609b2c24
|
| Upload date | |
|
Uploaded using Trusted Publishing? What is trusted publishing? |
Yes |
| Uploaded via |
twine/6.1.0 CPython/3.13.12
|
Provenance
Provenance describes where a file came from. On PyPI, provenance is shared via attestations, which provide a verifiable record of the build or publishing details. View details, limitations and caveats.


PyPI Publish Attestation
PyPI verified that this artifact, at this checksum, originated from the publisher listed below.
Signed by GitHub Actions, verified by PyPI on May 26, 2026.
Transparency logRelease files / fgivenx-2.5.2-py3-none-any.whl
| Download URL | fgivenx-2.5.2-py3-none-any.whl |
|---|---|
| Size | 26.8 kB |
| Tags | Python 3 |
|
SHA-256 checksum How to use checksums |
6d135409c8e1817975fef5ad0c3878b92961786de2c009a7e1a440c98336913f
|
|
BLAKE2b-256 checksum How to use checksums |
c50830d65c9a378e80a8877e1c961869f9a8b96e53535196b10b67e85cd978a9
|
| Upload date | |
|
Uploaded using Trusted Publishing? What is trusted publishing? |
Yes |
| Uploaded via |
twine/6.1.0 CPython/3.13.12
|
Provenance
Provenance describes where a file came from. On PyPI, provenance is shared via attestations, which provide a verifiable record of the build or publishing details. View details, limitations and caveats.
PyPI Publish Attestation
PyPI verified that this artifact, at this checksum, originated from the publisher listed below.
Signed by GitHub Actions, verified by PyPI on May 26, 2026.
Transparency log













