A memory profiler for data batch processing applications.

Project description
The Fil memory profiler for Python
Your code reads some data, processes it, and uses too much memory. In order to reduce memory usage, you need to figure out:
- Where peak memory usage is, also known as the high-water mark.
- What code was responsible for allocating the memory that was present at that peak moment.
That's exactly what Fil will help you find. Fil an open source memory profiler designed for data processing applications written in Python, and includes native support for Jupyter.
At the moment it only runs on Linux and macOS, and while it supports threading, it does not yet support multiprocessing or multiple processes in general.
"Within minutes of using your tool, I was able to identify a major memory bottleneck that I never would have thought existed. The ability to track memory allocated via the Python interface and also C allocation is awesome, especially for my NumPy / Pandas programs."
—Derrick Kondo
For more information, including an example of the output, see https://pythonspeed.com/products/filmemoryprofiler/
- Fil vs. other Python memory tools
- Installation
- Using Fil
- Reducing memory usage in your code
- How Fil works
Fil vs. other Python memory tools
There are two distinct patterns of Python usage, each with its own source of memory problems.
In a long-running server, memory usage can grow indefinitely due to memory leaks. That is, some memory is not being freed.
- If the issue is in Python code, tools like
tracemallocand Pympler can tell you which objects are leaking and what is preventing them from being leaked. - If you're leaking memory in C code, you can use tools like Valgrind.
Fil, however, is not aimed at memory leaks, but at the other use case: data processing applications. These applications load in data, process it somehow, and then finish running.
The problem with these applications is that they can, on purpose or by mistake, allocate huge amounts of memory. It might get freed soon after, but if you allocate 16GB RAM and only have 8GB in your computer, the lack of leaks doesn't help you.
Fil will therefore tell you, in an easy to understand way:
- Where peak memory usage is, also known as the high-water mark.
- What code was responsible for allocating the memory that was present at that peak moment.
- This includes C/Fortran/C++/whatever extensions that don't use Python's memory allocation API (
tracemalloconly does Python memory APIs).
This allows you to optimize that code in a variety of ways.
Installation
Assuming you're on macOS or Linux, and are using Python 3.6 or later, you can use either Conda or pip (or any tool that is pip-compatible and can install manylinux2010 wheels).
Conda
To install on Conda:
$ conda install -c conda-forge filprofiler
Pip
To install the latest version of Fil you'll need Pip 19 or newer. You can check like this:
$ pip --version
pip 19.3.0
If you're using something older than v19, you can upgrade by doing:
$ pip install --upgrade pip
If that doesn't work, try running that in a virtualenv.
Assuming you have a new enough version of pip:
$ pip install filprofiler
Using Fil
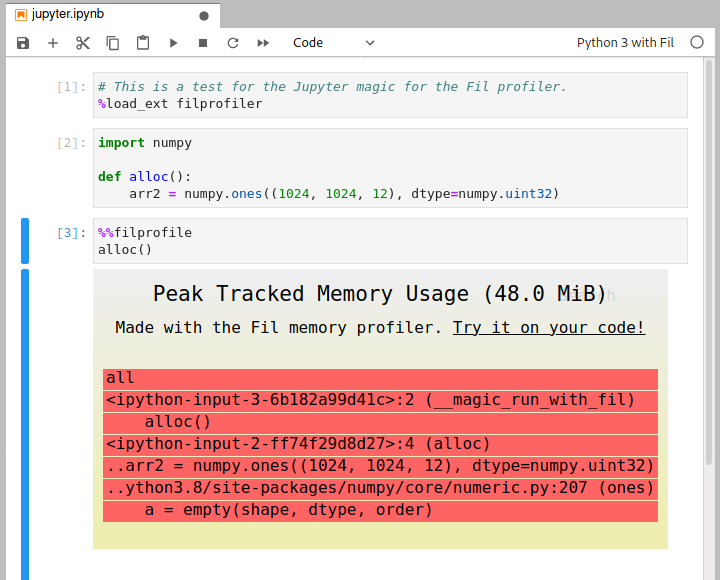
Measuring peak (high-water mark) memory usage in Jupyter
To measure memory usage of some code in Jupyter you need to do three things:
- Use an alternative kernel, "Python 3 with Fil". You can choose this kernel when you create a new notebook, or you can switch an existing notebook in the Kernel menu; there should be a "Change Kernel" option in there in both Jupyter Notebook and JupyterLab.
- Load the extension by doing
%load_ext filprofiler. - Add the
%%filprofilemagic to the top of the cell with the code you wish to profile.
Measuring peak (high-water mark) memory usage for Python scripts
Instead of doing:
$ python yourscript.py --input-file=yourfile
Just do:
$ fil-profile run yourscript.py --input-file=yourfile
And it will generate a report.
As of version 0.11, you can also run it like this:
$ python -m filprofiler run yourscript.py --input-file=yourfile
Debugging out-of-memory crashes
New in v0.14 and later: Just run your program under Fil, and it will generate a SVG at the point in time when memory runs out, and then exit with exit code 53:
$ fil-profile run oom.py
...
=fil-profile= Wrote memory usage flamegraph to fil-result/2020-06-15T12:37:13.033/out-of-memory.svg
Fil uses three heuristics to determine if the process is close to running out of memory:
- A failed allocation, indicating insufficient memory is available.
- The operating system or memory-limited cgroup (e.g. a Docker container) only has 100MB of RAM available.
- The process swap is larger than available memory, indicating heavy swapping by the process.
In general you want to avoid swapping, and e.g. explicitly use
mmap()if you expect to be using disk as a backfill for memory.
Reducing memory usage in your code
You've found where memory usage is coming from—now what?
If you're using data processing or scientific computing libraries, I have written a relevant guide to reducing memory usage.
How Fil works
Fil uses the LD_PRELOAD/DYLD_INSERT_LIBRARIES mechanism to preload a shared library at process startup.
This shared library captures all memory allocations and deallocations and keeps track of them.
At the same time, the Python tracing infrastructure (used e.g. by cProfile and coverage.py) to figure out which Python callstack/backtrace is responsible for each allocation.
For performance reasons, only the largest allocations are reported, with a minimum of 99% of allocated memory reported. The remaining <1% is highly unlikely to be relevant when trying to reduce usage; it's effectively noise.
Fil and threading, with notes on NumPy and Zarr {#threading}
In general, Fil will track allocations in threads correctly.
First, if you start a thread via Python, running Python code, that thread will get its own callstack for tracking who is responsible for a memory allocation.
Second, if you start a C thread, the calling Python code is considered responsible for any memory allocations in that thread. This works fine... except for thread pools. If you start a pool of threads that are not Python threads, the Python code that created those threads will be responsible for all allocations created during the thread pool's lifetime.
Therefore, in order to ensure correct memory tracking, Fil disables thread pools in BLAS (used by NumPy), BLOSC (used e.g. by Zarr), OpenMP, and numexpr.
They are all set to use 1 thread, so calls should run in the calling Python thread and everything should be tracked correctly.
This has some costs:
- This can reduce performance in some cases, since you're doing computation with one CPU instead of many.
- Insofar as these libraries allocate memory proportional to number of threads, the measured memory usage might be wrong.
Fil does this for the whole program when using fil-profile run.
When using the Jupyter kernel, anything run with the %%filprofile magic will have thread pools disabled, but other code should run normally.
What Fil tracks
Fil will track memory allocated by:
- Normal Python code.
- C code using
malloc()/calloc()/realloc()/posix_memalign(). - C++ code using
new(including viaaligned_alloc()). - Anonymous
mmap()s. - Fortran 90 explicitly allocated memory (tested with gcc's
gfortran).
Still not supported, but planned:
mremap()(resizing ofmmap()).- File-backed
mmap(). The semantics are somewhat different than normal allocations or anonymousmmap(), since the OS can swap it in or out from disk transparently, so supporting this will involve a different kind of resource usage and reporting. - Other forms of shared memory, need to investigate if any of them allow sufficient allocation.
- Anonymous
mmap()s created via/dev/zero(not common, since it's not cross-platform, e.g. macOS doesn't support this). memfd_create(), a Linux-only mechanism for creating in-memory files.- Possibly
memalign,valloc(),pvalloc(),reallocarray(). These are all rarely used, as far as I can tell.
License
Copyright 2020 Hyphenated Enterprises LLC
Licensed under the Apache License, Version 2.0 (the "License"); you may not use this file except in compliance with the License. You may obtain a copy of the License at
http://www.apache.org/licenses/LICENSE-2.0
Unless required by applicable law or agreed to in writing, software distributed under the License is distributed on an "AS IS" BASIS, WITHOUT WARRANTIES OR CONDITIONS OF ANY KIND, either express or implied. See the License for the specific language governing permissions and limitations under the License.
Release history Release notifications | RSS feed


Download files
Download the file for your platform. If you're not sure which to choose, learn more about installing packages.
Source Distributions
Built Distributions
Filter files by name, interpreter, ABI, and platform.
If you're not sure about the file name format, learn more about wheel file names.
Copy a direct link to the current filters
File details
Details for the file filprofiler-0.14.1-cp39-cp39-manylinux2010_x86_64.whl.
File metadata
- Download URL: filprofiler-0.14.1-cp39-cp39-manylinux2010_x86_64.whl
- Upload date:
- Size: 2.7 MB
- Tags: CPython 3.9, manylinux: glibc 2.12+ x86-64
- Uploaded using Trusted Publishing? No
- Uploaded via: twine/3.3.0 pkginfo/1.6.1 requests/2.25.1 setuptools/51.1.2 requests-toolbelt/0.9.1 tqdm/4.56.0 CPython/3.8.7
File hashes
| Algorithm | Hash digest | |
|---|---|---|
| SHA256 |
89bcd84190ae6431ea607f59003185a370c5f1b080f929453470116be1db61f9
|
|
| MD5 |
bf215a2b709b538ace669b237e3a47d2
|
|
| BLAKE2b-256 |
e069ce982750de0aec2a3f032bc395660238b4a87b7d53436925cd8f19d33d57
|
File details
Details for the file filprofiler-0.14.1-cp39-cp39-macosx_10_14_x86_64.whl.
File metadata
- Download URL: filprofiler-0.14.1-cp39-cp39-macosx_10_14_x86_64.whl
- Upload date:
- Size: 334.5 kB
- Tags: CPython 3.9, macOS 10.14+ x86-64
- Uploaded using Trusted Publishing? No
- Uploaded via: twine/3.3.0 pkginfo/1.6.1 requests/2.25.1 setuptools/51.1.2 requests-toolbelt/0.9.1 tqdm/4.56.0 CPython/3.9.1
File hashes
| Algorithm | Hash digest | |
|---|---|---|
| SHA256 |
d64b130ab7885cc67344c07b002d463d4ece6b29d7848e46985670757a716841
|
|
| MD5 |
13187bed28a11d9265353c15df622dca
|
|
| BLAKE2b-256 |
c03cffcf659e46cbdbabeb0b44079558df0c4cde10d0f892583503f1d2214a47
|
File details
Details for the file filprofiler-0.14.1-cp38-cp38-manylinux2010_x86_64.whl.
File metadata
- Download URL: filprofiler-0.14.1-cp38-cp38-manylinux2010_x86_64.whl
- Upload date:
- Size: 2.7 MB
- Tags: CPython 3.8, manylinux: glibc 2.12+ x86-64
- Uploaded using Trusted Publishing? No
- Uploaded via: twine/3.3.0 pkginfo/1.6.1 requests/2.25.1 setuptools/51.1.2 requests-toolbelt/0.9.1 tqdm/4.56.0 CPython/3.8.7
File hashes
| Algorithm | Hash digest | |
|---|---|---|
| SHA256 |
347c99e658e1ea07965ea0120406ee0d579a34ab20373eab48bd6c5fea9740b7
|
|
| MD5 |
f93488882cf069b0ce6fde4e5baae965
|
|
| BLAKE2b-256 |
453c147dda469d4d35e3066d1f89f446a40cef6e1c230cca5f0d047d92b57168
|
File details
Details for the file filprofiler-0.14.1-cp38-cp38-macosx_10_14_x86_64.whl.
File metadata
- Download URL: filprofiler-0.14.1-cp38-cp38-macosx_10_14_x86_64.whl
- Upload date:
- Size: 334.5 kB
- Tags: CPython 3.8, macOS 10.14+ x86-64
- Uploaded using Trusted Publishing? No
- Uploaded via: twine/3.3.0 pkginfo/1.6.1 requests/2.25.1 setuptools/51.1.2 requests-toolbelt/0.9.1 tqdm/4.56.0 CPython/3.8.7
File hashes
| Algorithm | Hash digest | |
|---|---|---|
| SHA256 |
4900792e26ab9242343667c67bb7fa4aa45f6947c2e52355eada99831119becc
|
|
| MD5 |
54aa638b356448be35216f9c1c3cdf07
|
|
| BLAKE2b-256 |
1494addeb5bf6200ba3097035b32926524afe34e8b112092b8a3280d6035a01f
|
File details
Details for the file filprofiler-0.14.1-cp37-cp37m-manylinux2010_x86_64.whl.
File metadata
- Download URL: filprofiler-0.14.1-cp37-cp37m-manylinux2010_x86_64.whl
- Upload date:
- Size: 2.7 MB
- Tags: CPython 3.7m, manylinux: glibc 2.12+ x86-64
- Uploaded using Trusted Publishing? No
- Uploaded via: twine/3.3.0 pkginfo/1.6.1 requests/2.25.1 setuptools/51.1.2 requests-toolbelt/0.9.1 tqdm/4.56.0 CPython/3.8.7
File hashes
| Algorithm | Hash digest | |
|---|---|---|
| SHA256 |
c363e3da13a543f5ee957b2e4329001062e4596e92605c0a22ba1087b3ae9b84
|
|
| MD5 |
06a8170673adbfa76a78e6c592840da7
|
|
| BLAKE2b-256 |
322cccdc5fe71c5b032d1db70c273836e7e3e04d63b10050813a8664ad0ab448
|
File details
Details for the file filprofiler-0.14.1-cp37-cp37m-macosx_10_14_x86_64.whl.
File metadata
- Download URL: filprofiler-0.14.1-cp37-cp37m-macosx_10_14_x86_64.whl
- Upload date:
- Size: 334.5 kB
- Tags: CPython 3.7m, macOS 10.14+ x86-64
- Uploaded using Trusted Publishing? No
- Uploaded via: twine/3.3.0 pkginfo/1.6.1 requests/2.25.1 setuptools/51.1.2 requests-toolbelt/0.9.1 tqdm/4.56.0 CPython/3.7.9
File hashes
| Algorithm | Hash digest | |
|---|---|---|
| SHA256 |
44ab4104c850f73d32d1ae9b452e8e20c80ce7c190e4530f8177a12adb5b73f1
|
|
| MD5 |
a952d873f7a04bf9af3919a360857fea
|
|
| BLAKE2b-256 |
fe74ce1a7e4f990ee93e7baf9426740a8cfbd57f276934b467ee0e8f4731c344
|
File details
Details for the file filprofiler-0.14.1-cp36-cp36m-manylinux2010_x86_64.whl.
File metadata
- Download URL: filprofiler-0.14.1-cp36-cp36m-manylinux2010_x86_64.whl
- Upload date:
- Size: 2.7 MB
- Tags: CPython 3.6m, manylinux: glibc 2.12+ x86-64
- Uploaded using Trusted Publishing? No
- Uploaded via: twine/3.3.0 pkginfo/1.6.1 requests/2.25.1 setuptools/51.1.2 requests-toolbelt/0.9.1 tqdm/4.56.0 CPython/3.8.7
File hashes
| Algorithm | Hash digest | |
|---|---|---|
| SHA256 |
8ad561071d2cbfae3a299b47368c98766e31ae9fcf24bf240d1dc45ebb717528
|
|
| MD5 |
c960c1b95ef91daee6545ed2d1264f49
|
|
| BLAKE2b-256 |
edcaa57b532582eef8cf4a764fbf55cc14ae61a11ad3a5808f53b8822425f460
|
File details
Details for the file filprofiler-0.14.1-cp36-cp36m-macosx_10_14_x86_64.whl.
File metadata
- Download URL: filprofiler-0.14.1-cp36-cp36m-macosx_10_14_x86_64.whl
- Upload date:
- Size: 334.5 kB
- Tags: CPython 3.6m, macOS 10.14+ x86-64
- Uploaded using Trusted Publishing? No
- Uploaded via: twine/3.3.0 pkginfo/1.6.1 requests/2.25.1 setuptools/51.1.2 requests-toolbelt/0.9.1 tqdm/4.56.0 CPython/3.6.12
File hashes
| Algorithm | Hash digest | |
|---|---|---|
| SHA256 |
bda9036949775e934a646f9eeae615425eaf72164a36b25039cb00b926ed7231
|
|
| MD5 |
91113c0b6b369936fb6f7b71c2cb771d
|
|
| BLAKE2b-256 |
f2fb1b1dfb5fb880c1544d770e5c41891867553c7f8566b8c292c9ca68efd900
|


