This is a database of 300.000+ symbols containing Equities, ETFs, Funds, Indices, Currencies, Cryptocurrencies and Money Markets.

Project description


| Call for Contributors to the FinanceDatabase |
|---|
| The FinanceDatabase serves the role of providing anyone with any type of financial product categorisation entirely for free. To be able to achieve this, the FinanceDatabase relies on involvement from the community to add, edit and remove tickers over time. This is made easy enough that anyone, even with a lack of coding experience can contribute because of the usage of CSV files that can be manually edited with ease. |
| I'd like to invite you to go to the Contributing Guidelines to understand how you can help. Thank you! |
As a private investor, the sheer amount of information that can be found on the internet is rather daunting. Trying to understand what type of companies or ETFs are available is incredibly challenging with there being millions of companies and derivatives available on the market. Sure, the most traded companies and ETFs can quickly be found simply because they are known to the public (for example, Microsoft, Tesla, S&P500 ETF or an All-World ETF). However, what else is out there is often unknown.
This database tries to solve that. It features 300.000+ symbols containing Equities, ETFs, Funds, Indices, Currencies, Cryptocurrencies and Money Markets. It therefore allows you to obtain a broad overview of sectors, industries, types of investments and much more.
The aim of this database is explicitly not to provide up-to-date fundamentals or stock data as those can be obtained with ease (with the help of this database) by using the FinanceToolkit. Instead, it gives insights into the products that exist in each country, industry and sector and gives the most essential information about each product. With this information, you can analyse specific areas of the financial world and/or find a product that is hard to find. See for examples on how you can combine this database, and the earlier mentioned packages the section Examples.
Some key statistics of the database:
| Product | Quantity | Sectors | Industries | Countries | Exchanges |
|---|---|---|---|---|---|
| Equities | 158.429 | 12 | 63 | 111 | 83 |
| ETFs | 36.786 | 295 | 22 | 111 | 53 |
| Funds | 57.881 | 1541 | 52 | 111 | 34 |
| Product | Quantity | Category |
|---|---|---|
| Currencies | 2.556 | 175 Currencies |
| Cryptocurrencies | 3.367 | 352 Cryptocurrencies |
| Indices | 91.183 | 64 Exchanges |
| Money Markets | 1.367 | 3 Exchanges |
The Finance Database is used within or referenced by:


Table of Contents
Installation
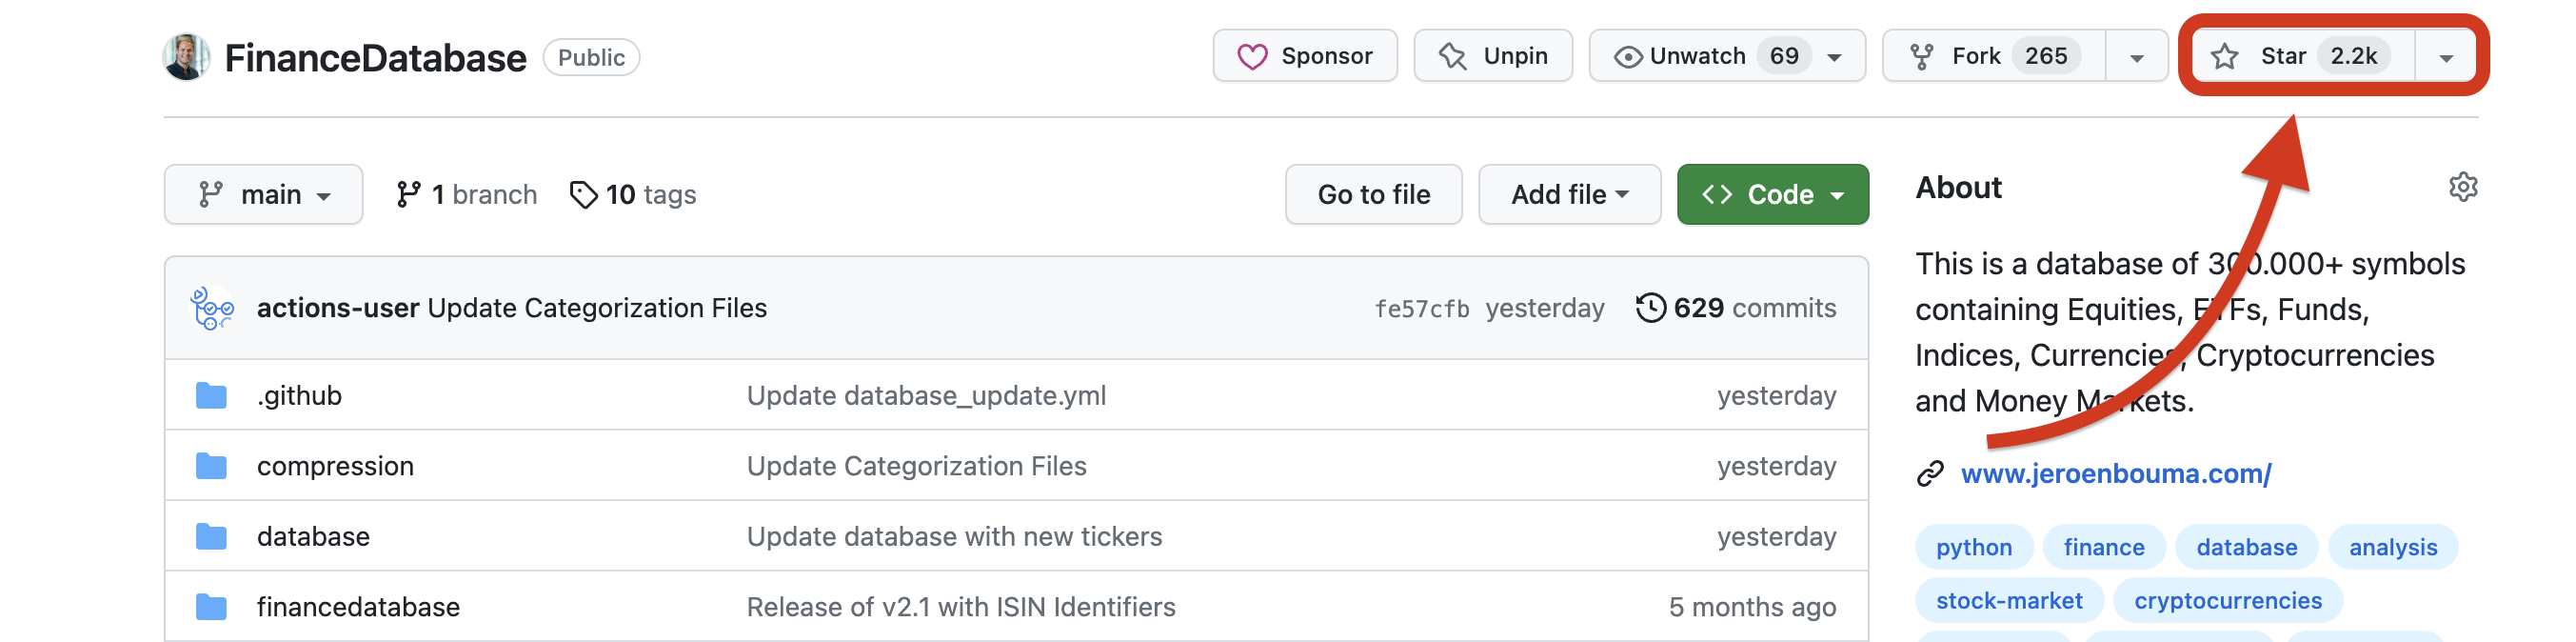
Before installation, consider starring the project on GitHub which helps others find the project as well.
To install the FinanceDatabase it simply requires the following:
pip install financedatabase
Then within Python use:
import financedatabase as fd
Basic Usage
This section explains in detail how the database can be queried with the related financedatabase package, also see the Jupyter Notebook in which you can run the examples also demonstrated here. You can find this document here.
Quick Start
Same methods apply to all other asset classes as well. Columns may vary.
import financedatabase as fd

# Initialize the Equities database
equities = fd.Equities()

# Obtain all countries from the database
equities_countries = equities.options('country')

# Obtain all sectors from the database
equities_sectors = equities.options('sector')

# Obtain all industry groups from the database
equities_industry_groups = equities.options('industry_group')

# Obtain all industries from a country from the database
equities_germany_industries = equities.options('industry', country='Germany')

# Obtain a selection from the database
equities_united_states = equities.select(country="United States")

# Obtain a detailed selection from the database
equities_usa_consumer_electronics = equities.select(country="United States", industry="Consumer Electronics")

# Search specific fields from the database with lists
equities_large_biotech = equities.search(
    summary="biotech", market_cap=["Large Cap", "Mega Cap"]
)
Scroll down below for a more elaborate explanation and detailed examples.
Collecting information from the database
Please see the Jupyter Notebook for an elaborate explanation of each asset class. This includes Equities, ETFs, Funds, Indices, Currencies, Cryptocurrencies and Money Markets.
As an example for Equities, If you wish to collect data from all equities you can use the following:
import financedatabase as fd

# Initialize the Equities database
equities = fd.Equities()

# Obtain all data available excluding international exchanges
equities.select()
Which returns the following DataFrame:
| symbol | name | currency | sector | industry_group | industry | exchange | market | country | state | city | zipcode | website | market_cap |
|---|---|---|---|---|---|---|---|---|---|---|---|---|---|
| A | Agilent Technologies, Inc. | USD | Health Care | Pharmaceuticals, Biotechnology & Life Sciences | Biotechnology | NYQ | us_market | United States | CA | Santa Clara | 95051 | http://www.agilent.com | Large Cap |
| AA | Alcoa Corporation | USD | Materials | Materials | Metals & Mining | NYQ | us_market | United States | PA | Pittsburgh | 15212-5858 | http://www.alcoa.com | Mid Cap |
| AAALF | Aareal Bank AG | USD | Financials | Banks | Banks | PNK | us_market | Germany | nan | Wiesbaden | 65189 | http://www.aareal-bank.com | Small Cap |
| AAALY | Aareal Bank AG | USD | Financials | Banks | Banks | PNK | us_market | Germany | nan | Wiesbaden | 65189 | http://www.aareal-bank.com | Small Cap |
| AABB | Asia Broadband, Inc. | USD | Materials | Materials | Metals & Mining | PNK | us_market | United States | NV | Las Vegas | 89135 | http://www.asiabroadbandinc.com | Micro Cap |
This returns approximately 20.000 different equities. Note that by default, only the American exchanges are selected. These are symbols like TSLA (Tesla) and MSFT (Microsoft) that tend to be recognized by a majority of data providers and therefore is the default. To disable this, you can set the exclude_exchanges argument to False which then results in approximately 155.000 different symbols.
Note that the summary column is taken out on purpose to keep it organized for markdown. The summary is however very handy when it comes to querying specific words as found with the following description given for Apple. All of this information is available when you query the database.
Apple Inc. designs, manufactures, and markets smartphones, personal computers, tablets, wearables, and accessories worldwide. It also sells various related services. The company offers iPhone, a line of smartphones; Mac, a line of personal computers; iPad, a line of multi-purpose tablets; and wearables, home, and accessories comprising AirPods, Apple TV, Apple Watch, Beats products, HomePod, iPod touch, and other Apple-branded and third-party accessories. It also provides AppleCare support services; cloud services store services; and operates various platforms, including the App Store, that allow customers to discover and download applications and digital content, such as books, music, video, games, and podcasts. In addition, the company offers various services, such as Apple Arcade, a game subscription service; Apple Music, which offers users a curated listening experience with on-demand radio stations; Apple News+, a subscription news and magazine service; Apple TV+, which offers exclusive original content; Apple Card, a co-branded credit card; and Apple Pay, a cashless payment service, as well as licenses its intellectual property. The company serves consumers, and small and mid-sized businesses; and the education, enterprise, and government markets. It sells and delivers third-party applications for its products through the App Store. The company also sells its products through its retail and online stores, and direct sales force; and third-party cellular network carriers, wholesalers, retailers, and resellers. Apple Inc. was founded in 1977 and is headquartered in Cupertino, California.
Find a more elaborate explanation with help(equities.select):
Help on method select in module financedatabase.equities:

select(country: str = '', sector: str = '', industry: str = '', exclude_exchanges: bool = True, capitalize: bool = True) -> pandas.core.frame.DataFrame method of financedatabase.equities.Equities instance
    Description
    ----
    Returns all equities when no input is given and has the option to give
    a specific set of symbols for the country, sector and/or industry provided.

    The data depends on the combination of inputs. For example Country + Sector
    gives all symbols for a specific sector in a specific country.

    Input
    ----
    country (string, default is None)
        If filled, gives all data for a specific country.
    sector (string, default is None)
        If filled, gives all data for a specific sector.
    industry (string, default is None)
        If filled, gives all data for a specific industry.
    exclude_exchanges (boolean, default is True):
        Whether you want to exclude exchanges from the search. If False,
        you will receive multiple times the product from different exchanges.
    capitalize (boolean, default is True):
        Whether country, sector and industry needs to be capitalized. By default
        the values always are capitalized as that is also how it is represented
        in the csv files.
    base_url (string, default is GitHub location)
        The possibility to enter your own location if desired.
    use_local_location (string, default False)
        The possibility to select a local location (i.e. based on Windows path)

    Output
    ----
    equities_df (pd.DataFrame)
        Returns a dictionary with a selection or all data based on the input.
As an example, we can use equities.options to obtain specific country, sector and industry options. For we can acquire all industries within the sector Basic Materials within the United States. This allows us to look at a specific industry in the United States in detail.
industry_options = equities.options(selection='industry', country="United States", sector="Materials")
So with this information in hand, I can now query the industry Metals & Mining as follows:
metals_and_mining_companies_usa = equities.select(country="United States", sector="Materials", industry="Metals & Mining")
This gives you a DataFrame with the following information:
| symbol | name | currency | sector | industry_group | industry | exchange | market | country | state | city | zipcode | website | market_cap |
|---|---|---|---|---|---|---|---|---|---|---|---|---|---|
| AA | Alcoa Corporation | USD | Materials | Materials | Metals & Mining | NYQ | us_market | United States | PA | Pittsburgh | 15212-5858 | http://www.alcoa.com | Mid Cap |
| AABB | Asia Broadband, Inc. | USD | Materials | Materials | Metals & Mining | PNK | us_market | United States | NV | Las Vegas | 89135 | http://www.asiabroadbandinc.com | Micro Cap |
| AAGC | All American Gold Corp. | USD | Materials | Materials | Metals & Mining | PNK | us_market | United States | WY | Cheyenne | 82001 | http://www.allamericangoldcorp.com | Nano Cap |
| ABML | American Battery Metals Corporation | USD | Materials | Materials | Metals & Mining | PNK | us_market | United States | NV | Incline Village | 89451 | http://www.batterymetals.com | Small Cap |
| ACNE | Alice Consolidated Mines, Inc. | USD | Materials | Materials | Metals & Mining | PNK | us_market | United States | ID | Wallace | 83873-0469 | nan | nan |
As you can imagine, looking at such a specific selection only yields a few results but picking the entire sector Materials would have returned 403 different companies (which excludes exchanges other than the United States).
Searching the database extensively
All asset classes have the capability to search each column with search, for example equities.search(). Through how this functionality is developed you can define multiple columns and search throughoutly. For example:
# Collect all Equities Database
equities = fd.Equities()

# Search Multiple Columns
equities.search(summary='automotive', currency='USD', country='Germany')
Which returns a selection of the DataFrame that matches all criteria.
| symbol | name | currency | sector | industry_group | industry | exchange | market | country | state | city | zipcode | website | market_cap |
|---|---|---|---|---|---|---|---|---|---|---|---|---|---|
| AFRMF | Alphaform AG | USD | Industrials | Capital Goods | Machinery | PNK | us_market | Germany | nan | Feldkirchen | 85622 | nan | Nano Cap |
| AUUMF | Aumann AG | USD | Industrials | Capital Goods | Machinery | PNK | us_market | Germany | nan | Beelen | 48361 | http://www.aumann.com | Micro Cap |
| BAMXF | Bayerische Motoren Werke Aktiengesellschaft | USD | Consumer Discretionary | Automobiles & Components | Automobiles | PNK | us_market | Germany | nan | Munich | 80788 | http://www.bmwgroup.com | Large Cap |
| BASFY | BASF SE | USD | Materials | Materials | Chemicals | PNK | us_market | Germany | nan | Ludwigshafen am Rhein | 67056 | http://www.basf.com | Large Cap |
| BDRFF | Beiersdorf Aktiengesellschaft | USD | Consumer Staples | Household & Personal Products | Household Products | PNK | us_market | Germany | nan | Hamburg | 20245 | http://www.beiersdorf.com | Large Cap |
Storing the database at a different location
If you wish to store the database at a different location (for example your own Fork) you can do so with the variable
base_url which you can find in each of the asset classes. An example would be:
fd.Equities(base_url=<YOUR URL>)
You can also store the database locally and point to your local location with the variable base_url and by setting
use_local_location to True. An example would be:
fd.Equities(base_url=<YOUR PATH>, use_local_location=True)
Examples
This section gives a few examples of the possibilities with this package. These are merely a few of the things you can do with the package. As you can obtain a wide range of symbols, pretty much any package that requires symbols should work.
Companies in the Netherlands
I want to see how many companies exist in each sector in the Netherlands. Let's count all companies with the following code, I skip a sector when it has no data and also do not include companies that are not categorized:
import financedatabase as fd

equities = fd.Equities()

equities_per_sector_netherlands = {}

for sector in equities.options(selection='sector', country='Netherlands'):
    try:
        equities_per_sector_netherlands[sector] = len(equities.select(country='Netherlands', sector=sector))
    except ValueError as error:
        print(error)
Lastly, I plot the data in a pie chart and add some formatting to make the pie chart look a bit nicer:
import matplotlib.pyplot as plt
legend, values = zip(*equities_per_sector_netherlands.items())
colors = ['b', 'g', 'r', 'c', 'm', 'y', 'k', 'tab:blue', 'tab:orange', 'tab:gray',
'lightcoral', 'yellow', 'saddlebrown', 'lightblue', 'olive']
plt.pie(values, labels=legend, colors=colors,
wedgeprops={'linewidth': 0.5, 'edgecolor': 'white'})
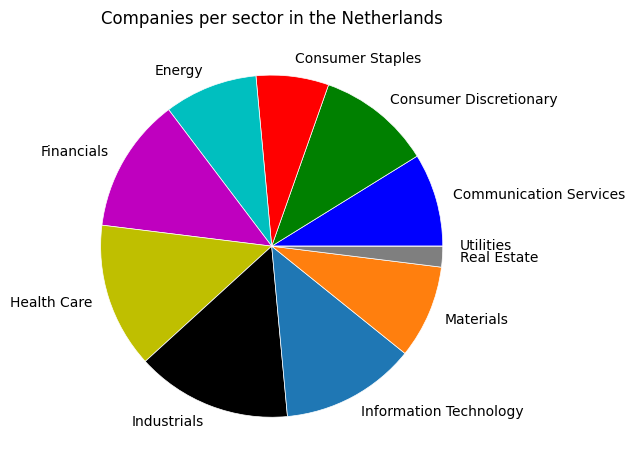
plt.title('Companies per sector in the Netherlands')
plt.tight_layout()
plt.show()
This results in the following graph which gives an indication which sectors are dominant within The Netherlands. Of course this is a mere example and to truly understand the importance of certain companies for the Netherlands, you would need to know market cap of each sector as well including demographics.
Technical Analysis of Biotech ETFs
With the help of ta and yfinance I can quickly perform a basic technical analysis on a group of ETFs categorized by the FinanceDatabase. I start by searching the database for ETFs related to Health and then make a subselection by searching, in the collected database, for biotech-related ETFs:
import financedatabase as fd

etfs = fd.ETFs()

health_care_etfs_in_biotech = etfs.search(category='Health Care', summary='biotech')
Then, I collect stock data on each ticker and remove tickers that have no data in my chosen period. The period I have chosen shows the initial impact of the Coronacrisis on the financial markets.
import yfinance as yf

tickers = list(health_care_etfs_in_biotech.index)

stock_data_biotech = yf.download(tickers, start="2020-01-01", end="2020-06-01")['Adj Close']
stock_data_biotech = stock_data_biotech.dropna(axis='columns')
Next up I initialize subplots and loop over all collected tickers. Here, I create a new temporary DataFrame that I fill with the adjusted close prices of the ticker as well as the Bollinger Bands. Then I plot the data in one of the subplots.
import pandas as pd
from ta.volatility import BollingerBands
import matplotlib.pyplot as plt
figure, axis = plt.subplots(4, 3)
row = 0
column = 0
for ticker in stock_data_biotech.columns:
data_plot = pd.DataFrame(stock_data_biotech[ticker])
name = health_care_etfs_in_biotech.loc[health_care_etfs_in_biotech.index == ticker, 'name'].iloc[0]
indicator_bb = BollingerBands(close=stock_data_biotech[ticker], window=20, window_dev=2)
data_plot['bb_bbm'] = indicator_bb.bollinger_mavg()
data_plot['bb_bbh'] = indicator_bb.bollinger_hband()
data_plot['bb_bbl'] = indicator_bb.bollinger_lband()
axis[row, column].plot(data_plot)
axis[row, column].set_title(name, fontsize=6)
axis[row, column].set_xticks([])
axis[row, column].set_yticks([])
column += 1
if column == 3:
row += 1
column = 0
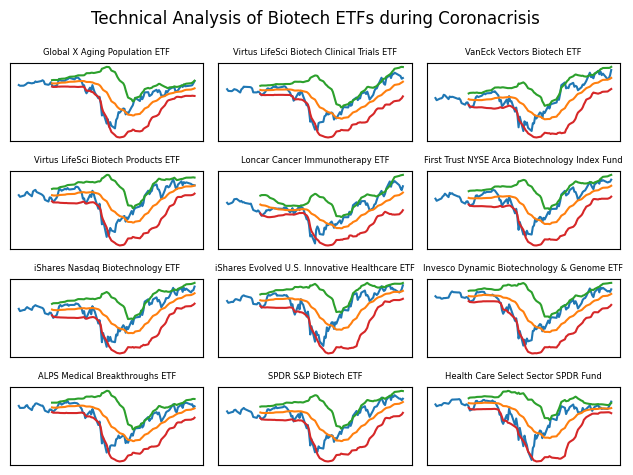
figure.suptitle('Technical Analysis of Biotech ETFs during Coronacrisis')
figure.tight_layout()
This leads to the following graph which gives an indication whether Biotech ETFs were oversold or overbought and how this effect is neutralised (to some degree) in the months after. Read more about Bollinger Bands here.
Perform a Dupont Analysis on Railroad Companies
In case I want to look into the Railroad companies in the United States that are marked as "Large Cap", I can use the following:
import financedatabase as fd

equities = fd.Equities()

railroad = equities.search(industry='Road & Rail',
                           country='United States',
                           market_cap='Large Cap',
                           exclude_exchanges=True)
With this information in hand, I can now start collecting data with the FinanceToolkit package. This can be anything from balance sheet, cash flow and income statements to 50+ financial ratios, enterprise values and historical data. Here I initialize the FinanceToolkit with the tickers as found in the FinanceDatabase.
from financetoolkit import Toolkit

API_KEY = "YOUR_FMP_API_KEY"
data_set = {}

companies = Toolkit(list(railroad.index), API_KEY)
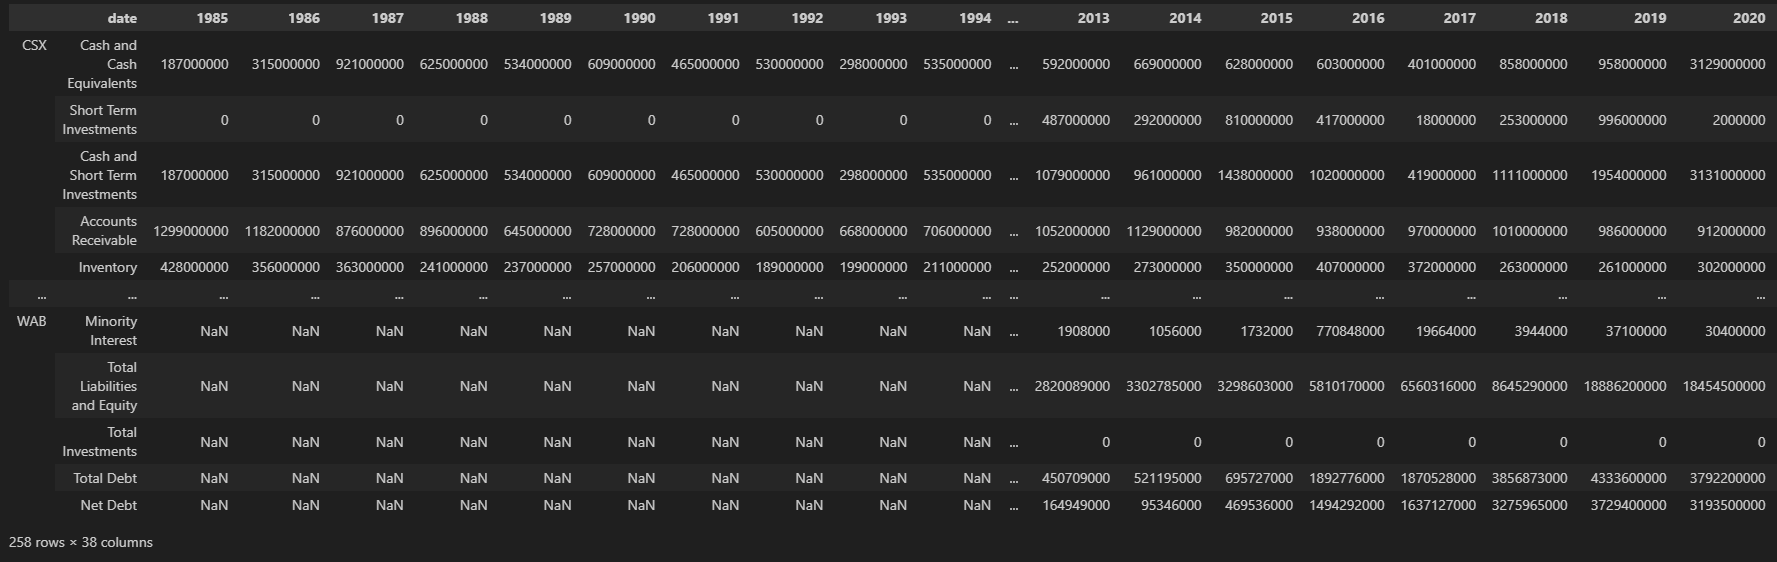
Then, as a demonstration, I can obtain all balance sheet statements for all companies that are marked as Large Cap Railroad companies in the United States.
companies.get_balance_sheet_statement()
With the data from the FinanceToolkit, it is now possible to execute a Dupont analysis on all companies. This shows the power of being able to combine a large database with a toolkit that allows you to do proper financial research.
companies.models.get_extended_dupont_analysis()
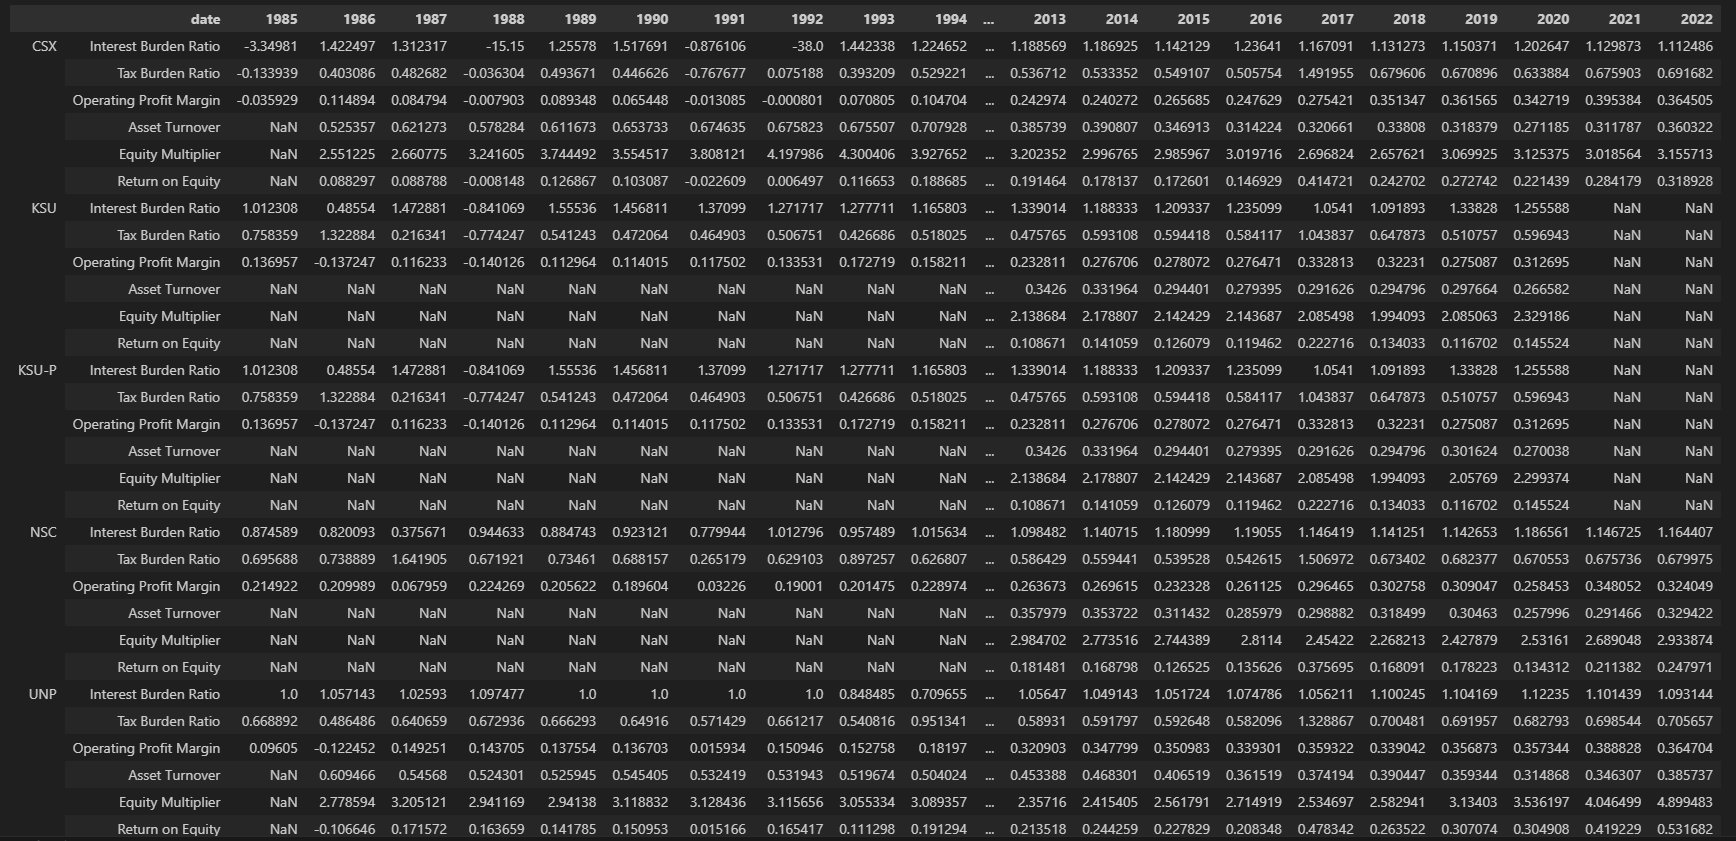
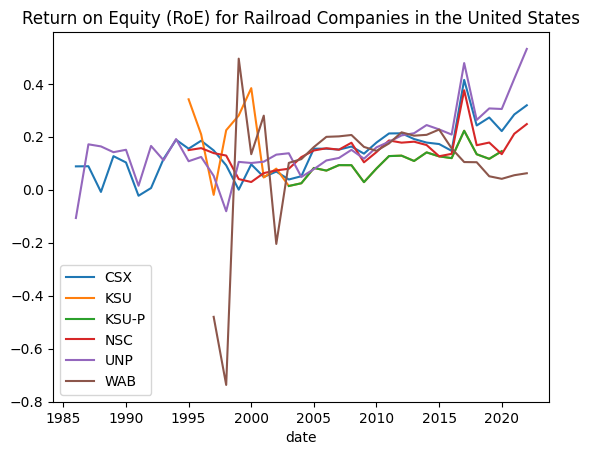
As you can imagine, it isn't too difficult to then plot a metric like Return on Equity (RoE) for all companies.
dupont_analysis = companies.models.get_extended_dupont_analysis()

dupont_analysis.loc[: , 'Return on Equity', :].T.plot(
    title='Return on Equity (RoE) for Railroad Companies in the United States')
Questions & Answers
In this section you can find answers to commonly asked questions. In case the answer to your question is not here, consider creating an Issue.
- How is the data obtained?
- The data is an aggregation of a variety of sources. The rule that I hold with high regard is that all data needs to be entirely publicly available. Any data that requires API key access or requires a paid tier is never included in this database. Data that you are being charged for is often owned and maintained by the company you have a subscription at and therefore publicly sharing this information online is against their Terms of Service (ToS). However, data that is publicly available can freely be shared (read more about this subject here) especially since this database will never cost any money.
- What categorization method is used?
- The categorization for Equities is based on a loose approximation of GICS. No actual data is collected from this source and this database merely tries to reflect the sectors and industries as best as possible. This is completely done through manual curation. The actual datasets as curated by MSCI has not been used in the development of any part of this database and remains the most up to date, paid, solution. Other categorizations are entirely developed by the author and can freely be changed.
- How can I contribute?
- Please see the Contributing Guidelines. Thank you!
- How can I find out which countries, sectors and/or industries exists within the database without needing to check the database manually?
- For this you can use the
optionsfunction from the package attached to this database. Furthermore, it is also possible to useequities = fd.Equities()and then useequities.options(selection='country')or specific further withequities.options(selection='sector', country='United States'). Please see this example
- For this you can use the
- When I try collect data I notice that not all tickers return output, why is that?
- Some tickers are merely holdings of companies and therefore do not really have any data attached to them. Therefore, it makes sense that not all tickers return data. If you are still in doubt, search the ticker on Google to see if there is really no data available. If you can't find anything about the ticker, consider updating the database by visiting the Contributing Guidelines.
- How does the database handle changes to companies over time - like symbol/exchange migration, mergers, bankruptcies, or symbols getting reused?
- For the American Exchanges, every Sunday the database automatically updates based on this repository. It also automatically checks if there were any market cap changes and converts assets accordingly. On purpose, most tickers are not removed even after becoming delisted. This is because it can be still of value for research to look into companies that no longer exist. When it comes to further automisation, this is what you usually pay a hefty fee for, think of Bloomberg at over $25.000 a year. Instead of requiring you to pay, this database is meant to be a community-driven project in which you help in identifiyng these companies. As news about migrations, mergers, bankruptcies and similar occur outside of the American exchanges it is up to the community to identify these and/or users to look into writing scripts that help with this. It is important to note that the vast majority of companies do not change as rapidly that this database becomes irrelevant before it is identified, e.g. a company like Facebook changing to META has already been updated. Furthermore, even though a company goes bankrupt, the old ticker is still relevant when it comes to historic data before the bankruptcy.
User Contributions
This section is meant to thank those that contributed to the project. Looking to contribute as well? Have a look here.
| User | Contribution |
|---|---|
| nindogo | Introduced a variety of new equities from the Nairobi Securities Exchange and introduced the country Kenya into the dataset. |
| colin99d | Helped in the conversion of the Finance Database package to Object-Orientated, making the code much more efficient. |
Contact
If you have any questions about the FinanceDatabase or would like to share with me what you have been working on, feel free to reach out to me via:
- LinkedIn: https://www.linkedin.com/in/boumajeroen/
- Email: jer.bouma@gmail.com
- Discord: https://discord.gg/WS94QqH9Xb
f you'd like to support my efforts, either help me out via the Contributing Guidelines or Buy me a Coffee.

Release history Release notifications | RSS feed


Download files
Download the file for your platform. If you're not sure which to choose, learn more about installing packages.
Source Distribution
Built Distribution
Filter files by name, interpreter, ABI, and platform.
If you're not sure about the file name format, learn more about wheel file names.
Copy a direct link to the current filters
File details
Details for the file financedatabase-2.1.1.tar.gz.
File metadata
- Download URL: financedatabase-2.1.1.tar.gz
- Upload date:
- Size: 29.5 kB
- Tags: Source
- Uploaded using Trusted Publishing? No
- Uploaded via: twine/4.0.2 CPython/3.10.9
File hashes
| Algorithm | Hash digest | |
|---|---|---|
| SHA256 |
bf28ecf4026e01e1c1d939b29bf70dae0bbbd8f81880a7805f91f50f49006060
|
|
| MD5 |
a23994eefa328e54a6d965e568932781
|
|
| BLAKE2b-256 |
7a139909dda1b069409d0d9471842be97b5404f44ca6528bf86b7bdcc0f81024
|
File details
Details for the file financedatabase-2.1.1-py3-none-any.whl.
File metadata
- Download URL: financedatabase-2.1.1-py3-none-any.whl
- Upload date:
- Size: 27.8 kB
- Tags: Python 3
- Uploaded using Trusted Publishing? No
- Uploaded via: twine/4.0.2 CPython/3.10.9
File hashes
| Algorithm | Hash digest | |
|---|---|---|
| SHA256 |
04d814aa23041c0f0833d907cf4c364d0c705676054afad8b1f3625bdd7ff071
|
|
| MD5 |
f859158ed2b25c6a5e46a4192660323a
|
|
| BLAKE2b-256 |
ff04ff6bd14d97435b1d85166e247ee029f9c9efd377acd209bb67fa3243f40e
|


