To easy plot forecasting through ARIMA model
Project description
A package to make forecast visualisation easier
Objective: To make forecast visualisation easier and more expressive.
To install the package
pip install forecast-tool
Let me show you how the package works
(1) Make a simple forecast using ARIMA model
Input [1]:
from forecast_tool import forecast_plot as fp
df = fp.get_data()

period = 'y' #[y, m, d]
date='Date'
newtarget='Volume'

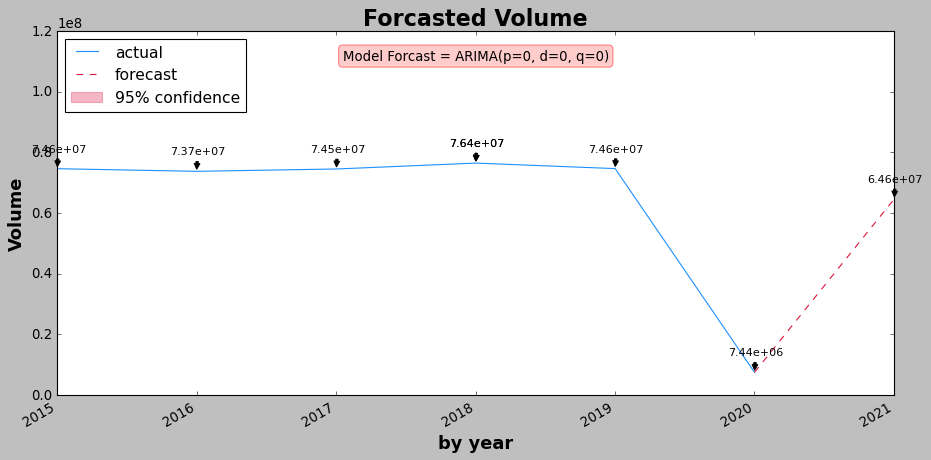
fp.overall_vis(df, date, newtarget, period)
Output [1]:
(1) You can also customise it to create your own plot
Input [2]:
show_model_name=True
suggested_n_forcast=True
my_title = True
y_label_name = True
x_label_name = True
color_past='dodgerblue'
color_forecast='crimson'
linestyle_past = 'solid'
linestyle_forecast='--'
show_confidence=True
numElems=10
matplotlib_style = 'seaborn'
legend_position=2
fig_length=13.5
fig_height=6.5
legend_font_size=14
scientific_annotation=True
zoom_last_n = 3  # to zoom last n values in a plot

fp.overall_vis(df, date, newtarget, period, \
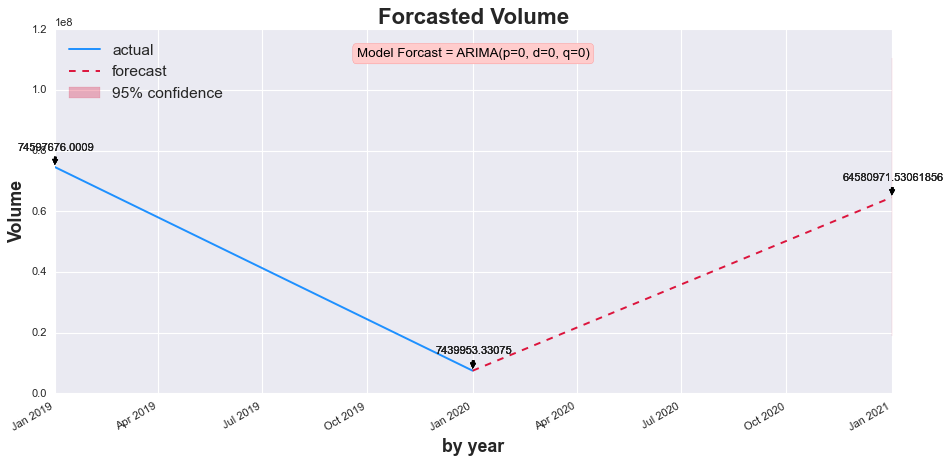
               zoom_last_n=zoom_last_n, matplotlib_style=matplotlib_style, scientific_annotation=False)
Output [2]:
This is contributed by Morris Lee.
Project details
Release history Release notifications | RSS feed
Download files
Download the file for your platform. If you're not sure which to choose, learn more about installing packages.
Source Distribution
forecast_tool-0.0.3.tar.gz
(17.7 kB
view hashes)
Built Distribution
Close
Hashes for forecast_tool-0.0.3-py3-none-any.whl
| Algorithm | Hash digest | |
|---|---|---|
| SHA256 | 899acae0f5f24a49b5dde3c8489ad1e38c54b54f3c254b302183f3d1fd017b4c |
|
| MD5 | 981d55d35195f7019bf50156dd44413a |
|
| BLAKE2b-256 | 3f20542572680b5ddd5608715ae030074b5fdce6005a688c7e13c4a41e0bb1f4 |


