A small example package
Project description
GeoPi = 3.14!
面向中国的时空位置数据处理工具包
可在离线环境下,无需联网,即可快速获取地理坐标点(经纬度)所在位置点(省市区县),查询速度毫秒级。
:octocat: Github链接地址
:rocket: pypi.org链接地址
:alien: test.pypi.org链接地址


1. 功能
获取地理坐标点(经纬度)所在位置点(省市区县)
- 中国地区数据来源于阿里云DataV.GeoAtlas,确保地理数据的准确性,地图坐标系采用GCJ02高德坐标系。
- POI数据来源于OSM数据, 坐标系已从WGS84转为GCJ02高德坐标系,确保区域数据与POI数据的坐标系一致性。
2. 安装
pip install geopi
或者
pip install geopi -i https://test.pypi.org/simple/
3. 使用
查询经纬度坐标所在位置点(省市区县):
from geopi import GeoPi

geopi = GeoPi()

# 设置要查询的经纬度坐标
lat, lng = 32.043787, 118.797437

# 获取所在地址
ret = geopi.search_city(lat, lng)
print(ret)
输出经纬度坐标所在位置点(省市区县):
{
    'province': ['江苏省', '320000'],
    'city': ['南京市', '320100'],
    'area': ['玄武区', '320102']
}
4. 可视化
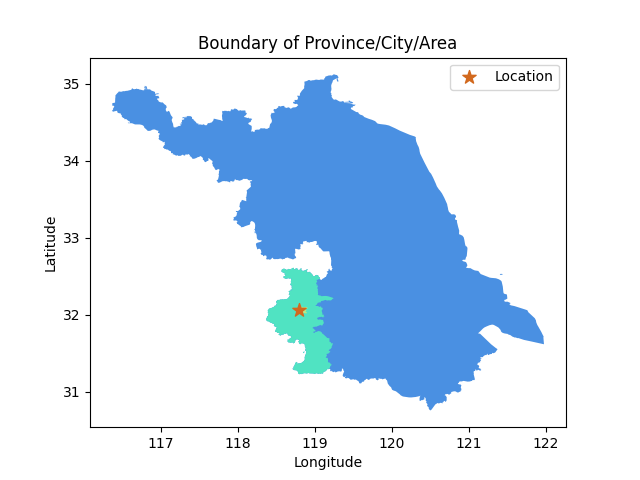
对经纬度坐标所在位置点(省市区县)进行可视化:
from geopi import GeoPi
from geopandas import GeoDataFrame
import matplotlib.pyplot as plt

geopi = GeoPi()

# 设置要查询的经纬度坐标
lat, lng = 32.043787, 118.797437

# 获取所在地址
ret = geopi.search_city(lat, lng)

# 获取经纬度坐标所在区域的边界数据
province_boundary = geopi.get_boundary_data(ret['province'][1])
city_boundary = geopi.get_boundary_data(ret['city'][1])
area_boundary = geopi.get_boundary_data(ret['area'][1])

gdf = GeoDataFrame({'geometry': [province_boundary, city_boundary, area_boundary]}, index=['province', 'city', 'area'])
ax = gdf.plot(color=['#4A90E2', '#50E3C2', '#B8E986'])
plt.xlabel('Longitude')
plt.ylabel('Latitude')
plt.title('Boundary of Province/City/Area')

# 在地图上绘制经纬度位置点
plt.scatter(lng, lat, color='#D2691E', marker='*', s=100, zorder=10, label='Location')
ax.legend()
plt.show()
5. 位置附近POI查询
查询经纬度坐标所在位置点附近的POI地点:
from geopi import GeoPi
from geopandas import GeoDataFrame
import matplotlib.pyplot as plt

geopi = GeoPi()

# 设置要查询的经纬度坐标
lat, lng = 32.043787, 118.797437

# 查询经纬度位置附近的POI信息
ret = geopi.search_nearest_poi(lat, lng, topk=10)
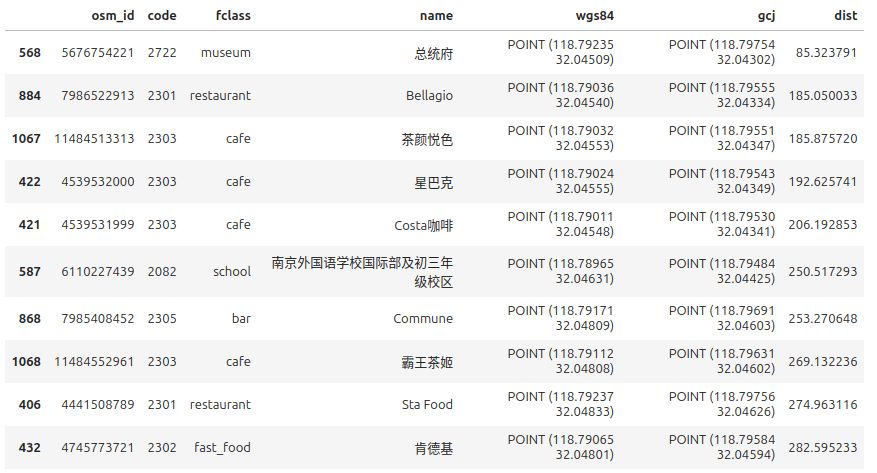
输出附近POI数据,fclass为POI类型,name为POI名称,wgs84和gcj为POI在不同坐标系的坐标点,dist为距离查询位置点的距离,距离单位为米(Meters):
6. 通过folium对位置附近POI进行可视化
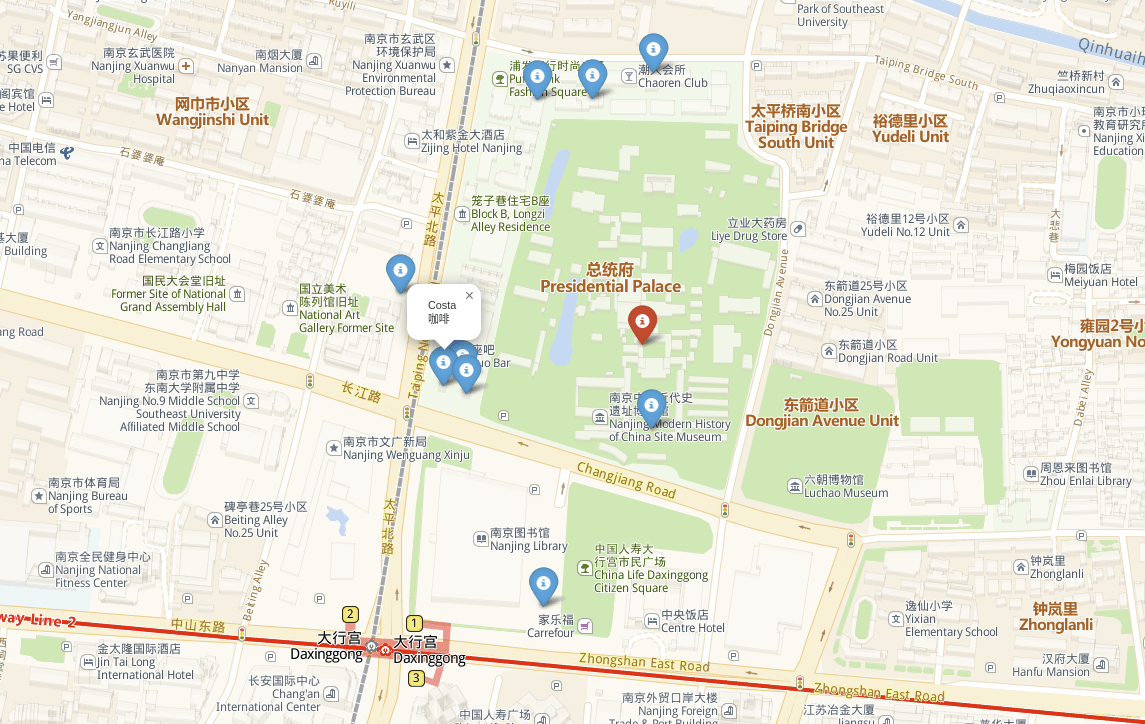
基于地图可视化可以更直观的查看位置附近的POI信息:
from geopi import GeoPi
from geopandas import GeoDataFrame
import matplotlib.pyplot as plt

geopi = GeoPi()

# 设置要查询的经纬度坐标
lat, lng = 32.043787, 118.797437

# 查询经纬度位置附近的POI信息
ret = geopi.search_nearest_poi(lat, lng, topk=10)

map = folium.Map(location=[lat, lng],
           tiles='https://webrd02.is.autonavi.com/appmaptile?lang=zh_en&size=1&scale=1&style=8&x={x}&y={y}&z={z}',
           attr='高德-中英文对照',
           zoom_start=15)

folium.Marker(location=[lat, lng], icon=folium.Icon(color='red')).add_to(map)

for index, row in ret.iterrows():
    pt = row['gcj']
    folium.Marker(location=[pt.y, pt.x], icon=folium.Icon(color='blue'), popup=row['name']).add_to(map)
map
位置附近的POI在地图上的可视化:
License
This project is released under the MIT License.
Project details
Release history Release notifications | RSS feed
Download files
Download the file for your platform. If you're not sure which to choose, learn more about installing packages.
Source Distribution
geopi-0.1.3.tar.gz
(29.5 MB
view hashes)
Built Distribution
geopi-0.1.3-py3-none-any.whl
(31.2 MB
view hashes)


