







Table of Contents
About the project
GNSS visualizer is a tool for visualizing GNSS data in an interactive environment.
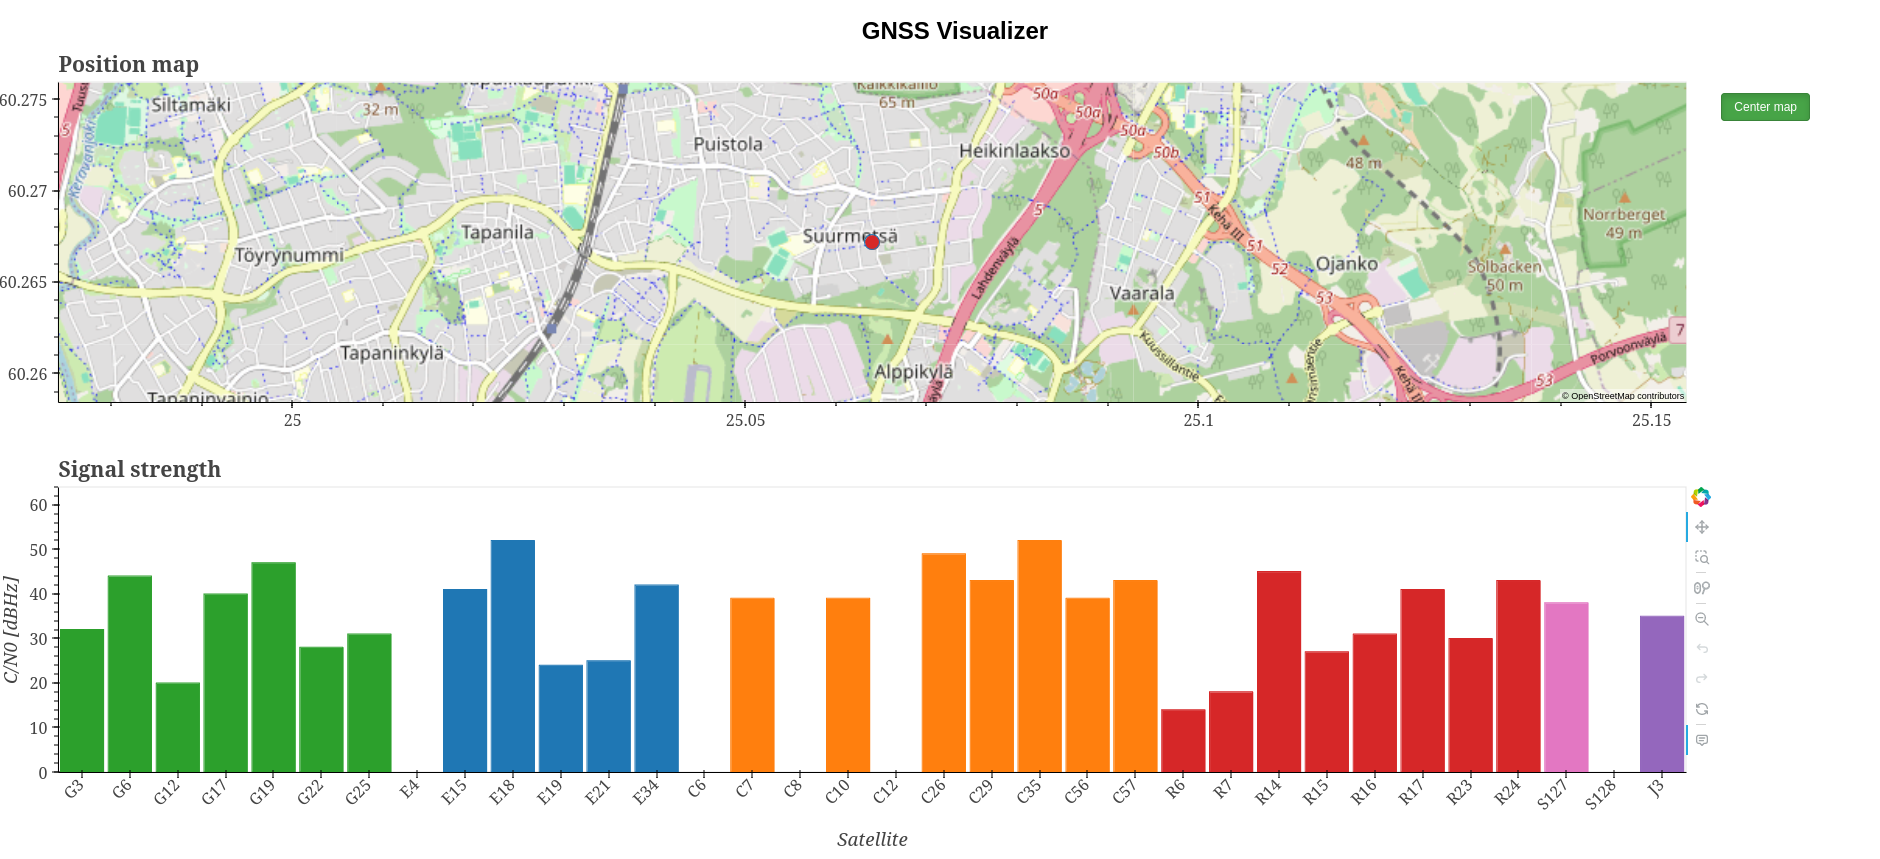
It is designed to offer a simple interface in a web browser with ever extending plotting capabilities.
The tool is still in very early development so don't expect much just yet!
GNSS receivers collect lots of information about the satellites and the signals they observe which can help to understand the quality of the positioning solution and the behavior of the receiver. Vast amounts of this data make it sometimes difficult to take proper advantage of it. GNSS visualizer aims to make this easier by providing easy to use tool that can be used to explore the data.
Built with
The interface and all the plots are built using awesome Bokeh library. Bokeh gives lots of power for creating pretty plots with nice interactive features including callbacks to python code.
Parsing of ubx messages leverages pyubx2 library.
Getting started
Prequisites
- Python 3.11 or later. Earlier versions might work but are not tested.
Installation via pip
python -m pip install gnss-visualizer
Usage
After installing, the tool provides a command gnss-visualizer that can be used to launch the tool and open the UI in a web browser.
Reading ubx files in playback mode
Analyzing an ubx file in playback mode can be done in the following way:
gnss-visualizer ~/path/to/file.ubx -w 1
where -w (shorthand for --default-simulate-wait-s) is used to add delay of 1 second after each UBX-NAV-PVT message. This will make files with 1 Hz navigation rate playback as if they were done in (almost) realtime.
The input file should contain UBX-NAV-PVT messages and in order to generate signal and satellite based plots also UBX-NAV-SIG messages.
For testing purposes the repository contains a file coldstart.ubx that can be used to test the tool. It contains data from a coldstart of a stationary receiver.
Reading serial devices
Data can be read also from a serial device using:
gnss-visualizer /dev/ttyUSB0
Details
gnss-visualizer command can be substituted to bokeh serve src/gnss_visualizer --show --args INPUT and in case the bokeh serve command needs to be modified, it can simply be used manually instead of calling gnss-visualizer.
Roadmap
- Test setup
- Github CICD
- Tests
- Plot selection mechanism
- Make plotting module with classess for different plots
- Set up whole file reading for timeseries plots
- More plots
- Allow playback after reading the whole file
- Configurable wait delay
- Non-ubx file support (some basic plots?)
- Even more plots
- Truth location handling (coordinates / files)
- Lots more plots
- UI for file input
See the open issues for a full list of proposed features (and known issues).
Contributing
Contributions are what make the open source community such an amazing place to learn, inspire, and create. Any contributions you make are greatly appreciated.
If you have a suggestion that would make this better, please fork the repo and create a pull request. You can also simply open an issue. Don't forget to give the project a star! Thanks again!
Setting up a local repository
- Fork the project
- Clone the forked project
- Install dependencies (
pip install -r requirements.txt && pip install -r requirements-dev.txt) - Install the project in editable mode (
pip install -e .) - Install pre-commit (
pipx install pre-commit) - Install pre-commit hooks (
pre-commit install)
Steps to contribute
- Set up a local repository
- Create your feature branch (
git checkout -b feature/AmazingFeature) - Commit your changes (
git commit -m 'Add some AmazingFeature') - Push to the branch (
git push origin feature/AmazingFeature) - Open a pull request
License
Distributed under the AGPL-3.0 license. See LICENSE for more information.
Contact
Ville Joensuu - Linkedin - jopppis@iki.fi
Project Link: https://github.com/jopppis/gnss-visualizer
Acknowledgments
1 maintainer

Release files for gnss-visualizer 0.0.7
For a detailed explanation of source distributions (sdists) and built distributions (wheels), please see the package formats documentation.
Source distribution (sdist)
| File | Size | Uploaded | |
|---|---|---|---|
| gnss_visualizer-0.0.7.tar.gz | 546.1 kB | Details |
Built distribution (wheel)
| File | Interpreter | ABI | Platform | Reset |
|---|---|---|---|---|
| gnss_visualizer-0.0.7-py3-none-any.whl | Python 3 | none | any | Details |
Total release size: 590.7 kB
Release files / gnss_visualizer-0.0.7.tar.gz
| Download URL | gnss_visualizer-0.0.7.tar.gz |
|---|---|
| Size | 546.1 kB |
| Tags | Source |
|
SHA-256 checksum How to use checksums |
8b09c2baa7915bc5b15fb76a14df104027bfd22e532aa28a2e3928d313bbaa2f
|
|
BLAKE2b-256 checksum How to use checksums |
5be09726c961fa4b0712d8be3abf856e71a7b0d6c3d71e94831a1e6ed81f98fa
|
| Upload date | |
|
Uploaded using Trusted Publishing? What is trusted publishing? |
Yes |
| Uploaded via |
twine/5.0.0 CPython/3.12.2
|
Release files / gnss_visualizer-0.0.7-py3-none-any.whl
| Download URL | gnss_visualizer-0.0.7-py3-none-any.whl |
|---|---|
| Size | 44.6 kB |
| Tags | Python 3 |
|
SHA-256 checksum How to use checksums |
0f838cb7e8dc22bfa91a4d507c1e504385c2e2f86412dd9898babd1d2d2d83ef
|
|
BLAKE2b-256 checksum How to use checksums |
4968eb5c2cddcdc94709ee546fb551c17f5e8bec2d68b6cc5c0ba96ad9fe6557
|
| Upload date | |
|
Uploaded using Trusted Publishing? What is trusted publishing? |
Yes |
| Uploaded via |
twine/5.0.0 CPython/3.12.2
|














