
# graffiti - a library for declarative computation
## Installation
`pip install graffiti`
*or*
1. `git clone https://github.com/SegFaultAX/graffiti`
1. `cd graffiti/`
1. To install: `python setup.py install`
1. To get development dependencies: `pip install -r requirements.txt`
1. To run tests: `nosetests`
1. To audit source: `python setup.py audit`
Check out my [blog post](http://mkbernard.com/blog/2014/06/graffiti-a-python-library-for-declarative-computation/)
for more background on the "why" of this project. Get in touch if you have any
comments or questions!
Inspired by Prismatic's Graph library (https://github.com/prismatic/plumbing)
## Overview
```python
from graffiti import Graph
stats_descriptor = {
"n": lambda xs: len(xs),
"m": lambda xs, n: sum(xs) / n,
"m2": lambda xs, n: sum(x ** 2 for x in xs) / n,
"v": lambda m, m2: m2 - m ** 2
}
graph = Graph(stats_descriptor)
graph({ "xs": [1, 2, 3, 4, 5] })
#=> {'xs': [1, 2, 3, 4, 5], 'n': 5, 'm': 3, 'm2': 11, 'v': 2}
# if pydot is installed
graph.visualize()
```
## Tutorial
Consider the following perfectly reasonable Python code:
```python
def stats(xs):
n = len(xs)
m = sum(xs) / n
m2 = sum(x ** 2 for x in xs) / n
v = m2 - m ** 2
return {
"xs": xs,
"n": n,
"m": m,
"m2": m2,
"v": v,
}
```
The first computation is based on our input (xs), and each additional
computation builds up more values based on things we've computed already. It's
convenient to visualize this computation as a graph with the user inputs at the
root and values we're interested in at the leaves.
graffiti allows you to structure your computation in exactly that fashion:
```python
stats_graph = {
"n": lambda xs: len(xs),
"m": lambda xs, n: sum(xs) / n,
"m2": lambda xs, n: sum(x ** 2 for x in xs) / n,
"v": lambda m, m2: m2 - m ** 2
}
graph = Graph(stats_graph)
graph({ "xs": range(100) })
```
graffiti finds the relationships between the nodes in your graph and determines
the optimal execution order. Leaves in the graph are computed lazily which means
we can choose to only evaluate the ones we're interested in:
```python
graph({ "xs": range(100) }, _keys={"m", "n"})
```
In this case, graffiti will only evaluate what's needed to compute m and n, but
not the rest of the graph. You can also build nested graphs with dependencies
across nesting levels:
```python
stats_graph = {
"n": lambda xs: len(xs),
"m": lambda xs, n: sum(xs) / n,
"m2": lambda xs, n: sum(x ** 2 for x in xs) / n,
"v": lambda m, m2: m2 - m ** 2,
"order": {
"sorted": lambda xs: sorted(xs),
"reversed": lambda xs: sorted(xs, reverse=True)
},
}
graph = Graph(stats_graph)
graph({ "xs": range(100) })
graph({ "xs": range(10) }, _keys={"order"})
```
Again, none of the unecessary nodes will be computed. Nodes in the graph can
also contain optional arguments:
```python
graph = Graph({ "mul": lambda n, p=10: n * p })
graph({ "n": 10 }) # mul == 100
graph({ "n": 10, "p": 20 }) # mul == 200
```
If the optional key is provided as an input to the graph evaluator, it will
override the default value of the node. This makes it easy to play with
different values or settings as the computation flows through your pipeline.
Finally, graphs are resumable. Since a graph object takes a dict as input and
returns a dict as output, you can replay a previously generated dict as the
input to the next thereby reusing all previously computed values:
```python
stats_graph = {
"n": lambda xs: len(xs),
"m": lambda xs, n: sum(xs) / n,
"m2": lambda xs, n: sum(x ** 2 for x in xs) / n,
"v": lambda m, m2: m2 - m ** 2,
}
graph = Graph(stats_graph)
v1 = graph({ "xs": [1,2,3] }, _keys={"n"}) # just n
v2 = graph(v1, _keys={"m"}) # v1 + just m
v3 = graph(v2) # the rest of the graph
```
This allows you to defer the evaluation of expensive keys until the moment
they're actually needed without duplicating previous computations.
graffiti also supports drawing the transitive graph of dependencies:
```python
stats_graph = {
"n": lambda xs: len(xs),
"m": lambda xs, n: sum(xs) / n,
"m2": lambda xs, n: sum(x ** 2 for x in xs) / n,
"v": lambda m, m2: m2 - m ** 2,
"order": {
"sorted": lambda xs: sorted(xs),
"reversed": lambda xs: sorted(xs, reverse=True)
},
}
graph = Graph(stats_graph)
graph.visualize()
```
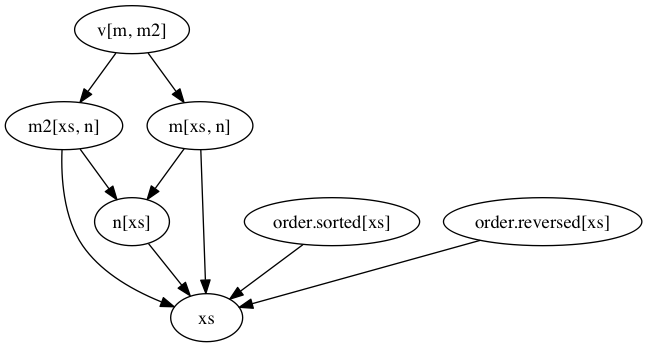
Using graffiti allows you to structure your computation and the complex
interdependencies therein naturally and efficiently. Most importantly, your
computational pipeline is just data. That means it's easy to inspect, easy to
reason about, and easy to build tooling around.
This project is still under active development. Contact me on Twitter
@SegFaultAX if you have any questions, comments, or bug reports.
## License
Copyright 2014 Michael-Keith Bernard
Availabe under the MIT License. See LICENSE for full details.
## Installation
`pip install graffiti`
*or*
1. `git clone https://github.com/SegFaultAX/graffiti`
1. `cd graffiti/`
1. To install: `python setup.py install`
1. To get development dependencies: `pip install -r requirements.txt`
1. To run tests: `nosetests`
1. To audit source: `python setup.py audit`
Check out my [blog post](http://mkbernard.com/blog/2014/06/graffiti-a-python-library-for-declarative-computation/)
for more background on the "why" of this project. Get in touch if you have any
comments or questions!
Inspired by Prismatic's Graph library (https://github.com/prismatic/plumbing)
## Overview
```python
from graffiti import Graph
stats_descriptor = {
"n": lambda xs: len(xs),
"m": lambda xs, n: sum(xs) / n,
"m2": lambda xs, n: sum(x ** 2 for x in xs) / n,
"v": lambda m, m2: m2 - m ** 2
}
graph = Graph(stats_descriptor)
graph({ "xs": [1, 2, 3, 4, 5] })
#=> {'xs': [1, 2, 3, 4, 5], 'n': 5, 'm': 3, 'm2': 11, 'v': 2}
# if pydot is installed
graph.visualize()
```
## Tutorial
Consider the following perfectly reasonable Python code:
```python
def stats(xs):
n = len(xs)
m = sum(xs) / n
m2 = sum(x ** 2 for x in xs) / n
v = m2 - m ** 2
return {
"xs": xs,
"n": n,
"m": m,
"m2": m2,
"v": v,
}
```
The first computation is based on our input (xs), and each additional
computation builds up more values based on things we've computed already. It's
convenient to visualize this computation as a graph with the user inputs at the
root and values we're interested in at the leaves.
graffiti allows you to structure your computation in exactly that fashion:
```python
stats_graph = {
"n": lambda xs: len(xs),
"m": lambda xs, n: sum(xs) / n,
"m2": lambda xs, n: sum(x ** 2 for x in xs) / n,
"v": lambda m, m2: m2 - m ** 2
}
graph = Graph(stats_graph)
graph({ "xs": range(100) })
```
graffiti finds the relationships between the nodes in your graph and determines
the optimal execution order. Leaves in the graph are computed lazily which means
we can choose to only evaluate the ones we're interested in:
```python
graph({ "xs": range(100) }, _keys={"m", "n"})
```
In this case, graffiti will only evaluate what's needed to compute m and n, but
not the rest of the graph. You can also build nested graphs with dependencies
across nesting levels:
```python
stats_graph = {
"n": lambda xs: len(xs),
"m": lambda xs, n: sum(xs) / n,
"m2": lambda xs, n: sum(x ** 2 for x in xs) / n,
"v": lambda m, m2: m2 - m ** 2,
"order": {
"sorted": lambda xs: sorted(xs),
"reversed": lambda xs: sorted(xs, reverse=True)
},
}
graph = Graph(stats_graph)
graph({ "xs": range(100) })
graph({ "xs": range(10) }, _keys={"order"})
```
Again, none of the unecessary nodes will be computed. Nodes in the graph can
also contain optional arguments:
```python
graph = Graph({ "mul": lambda n, p=10: n * p })
graph({ "n": 10 }) # mul == 100
graph({ "n": 10, "p": 20 }) # mul == 200
```
If the optional key is provided as an input to the graph evaluator, it will
override the default value of the node. This makes it easy to play with
different values or settings as the computation flows through your pipeline.
Finally, graphs are resumable. Since a graph object takes a dict as input and
returns a dict as output, you can replay a previously generated dict as the
input to the next thereby reusing all previously computed values:
```python
stats_graph = {
"n": lambda xs: len(xs),
"m": lambda xs, n: sum(xs) / n,
"m2": lambda xs, n: sum(x ** 2 for x in xs) / n,
"v": lambda m, m2: m2 - m ** 2,
}
graph = Graph(stats_graph)
v1 = graph({ "xs": [1,2,3] }, _keys={"n"}) # just n
v2 = graph(v1, _keys={"m"}) # v1 + just m
v3 = graph(v2) # the rest of the graph
```
This allows you to defer the evaluation of expensive keys until the moment
they're actually needed without duplicating previous computations.
graffiti also supports drawing the transitive graph of dependencies:
```python
stats_graph = {
"n": lambda xs: len(xs),
"m": lambda xs, n: sum(xs) / n,
"m2": lambda xs, n: sum(x ** 2 for x in xs) / n,
"v": lambda m, m2: m2 - m ** 2,
"order": {
"sorted": lambda xs: sorted(xs),
"reversed": lambda xs: sorted(xs, reverse=True)
},
}
graph = Graph(stats_graph)
graph.visualize()
```

Using graffiti allows you to structure your computation and the complex
interdependencies therein naturally and efficiently. Most importantly, your
computational pipeline is just data. That means it's easy to inspect, easy to
reason about, and easy to build tooling around.
This project is still under active development. Contact me on Twitter
@SegFaultAX if you have any questions, comments, or bug reports.
## License
Copyright 2014 Michael-Keith Bernard
Availabe under the MIT License. See LICENSE for full details.
1 maintainer

Release files for graffiti 0.1.2
For a detailed explanation of source distributions (sdists) and built distributions (wheels), please see the package formats documentation.
Source distribution (sdist)
| File | Size | Uploaded | |
|---|---|---|---|
| graffiti-0.1.2.tar.gz | 9.6 kB | Details |
Release files / graffiti-0.1.2.tar.gz
| Download URL | graffiti-0.1.2.tar.gz |
|---|---|
| Size | 9.6 kB |
| Tags | Source |
|
SHA-256 checksum How to use checksums |
39b7abc33508abff5d82e9f154104e842e7319ec8d5d46b1418b29393a579604
|
|
BLAKE2b-256 checksum How to use checksums |
49c5c35f3ae1515e04eae7ea7c02a8be33c50adc2db1f2cc108aa5151b8ffab2
|
| Upload date | |
|
Uploaded using Trusted Publishing? What is trusted publishing? |
No |














