
HiPlot - High dimensional Interactive Plotting 






HiPlot is a lightweight interactive visualization tool to help AI researchers discover correlations and patterns in high-dimensional data using parallel plots and other graphical ways to represent information.
Try a demo now with sweep data or upload your CSV or 
There are several modes to HiPlot:
- As a web-server (if your data is a CSV for instance)
- In a jupyter notebook (to visualize python data), or in Streamlit apps
- In CLI to render standalone HTML
pip install -U hiplot # Or for conda users: conda install -c conda-forge hiplot
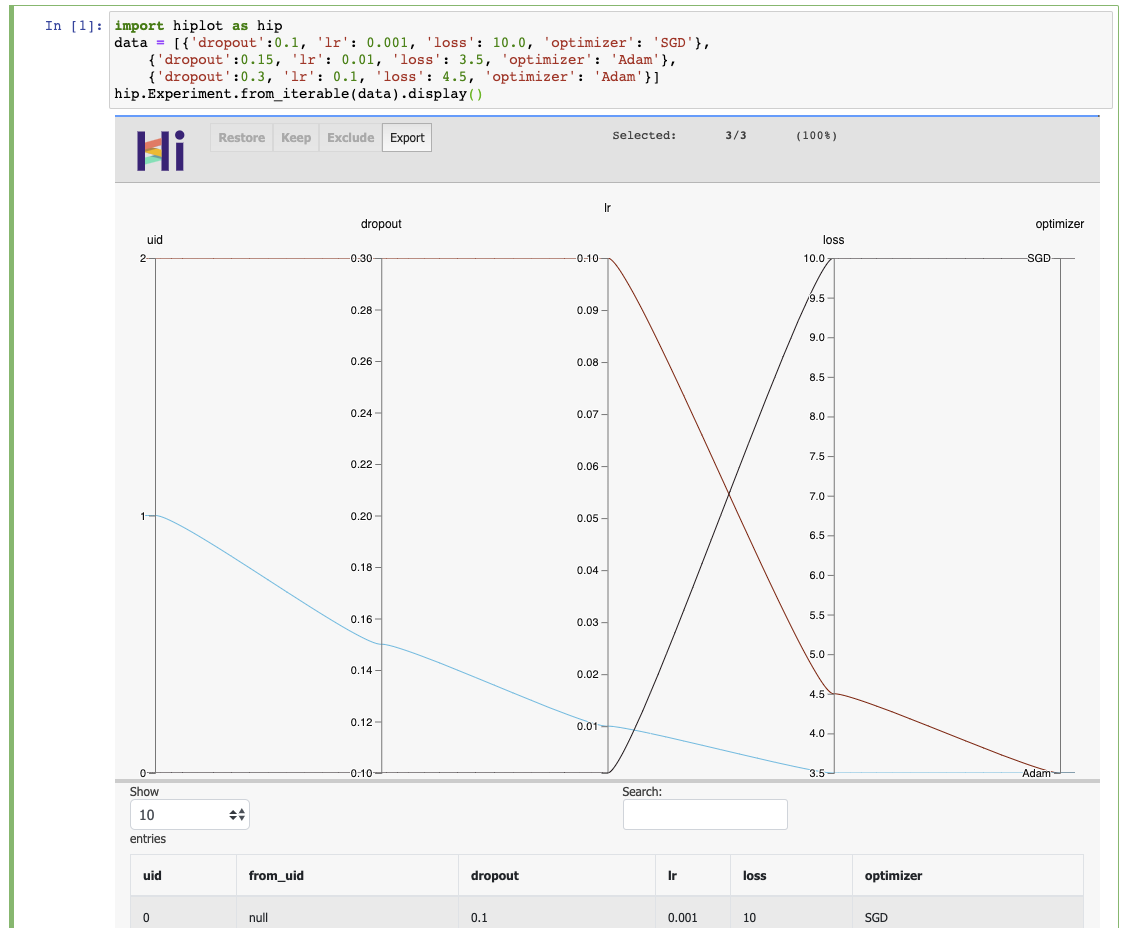
If you have a jupyter notebook, you can get started with something as simple as:
import hiplot as hip
data = [{'dropout':0.1, 'lr': 0.001, 'loss': 10.0, 'optimizer': 'SGD'},
        {'dropout':0.15, 'lr': 0.01, 'loss': 3.5, 'optimizer': 'Adam'},
        {'dropout':0.3, 'lr': 0.1, 'loss': 4.5, 'optimizer': 'Adam'}]
hip.Experiment.from_iterable(data).display()
See the live result
Links
- Blog post: https://ai.facebook.com/blog/hiplot-high-dimensional-interactive-plots-made-easy/
- Documentation: https://facebookresearch.github.io/hiplot/index.html
- Pypi package: https://pypi.org/project/hiplot/
- Conda package: https://anaconda.org/conda-forge/hiplot
- NPM package: https://www.npmjs.com/package/hiplot
- Examples: https://github.com/facebookresearch/hiplot/tree/main/examples
Citing
@misc{hiplot,
    author = {Haziza, D. and Rapin, J. and Synnaeve, G.},
    title = {{Hiplot, interactive high-dimensionality plots}},
    year = {2020},
    publisher = {GitHub},
    journal = {GitHub repository},
    howpublished = {\url{https://github.com/facebookresearch/hiplot}},
}
Credits
Inspired by and based on code from Kai Chang, Mike Bostock and Jason Davies.
External contributors (please add your name when you submit your first pull request):
License
1 maintainer

Release files for hiplot 0.1.33
For a detailed explanation of source distributions (sdists) and built distributions (wheels), please see the package formats documentation.
Source distribution (sdist)
| File | Size | Uploaded | |
|---|---|---|---|
| hiplot-0.1.33.tar.gz | 848.2 kB | Details |
Built distribution (wheel)
| File | Interpreter | ABI | Platform | Reset |
|---|---|---|---|---|
| hiplot-0.1.33-py3-none-any.whl | Python 3 | none | any | Details |
Total release size: 1.7 MB
Release files / hiplot-0.1.33.tar.gz
| Download URL | hiplot-0.1.33.tar.gz |
|---|---|
| Size | 848.2 kB |
| Tags | Source |
|
SHA-256 checksum How to use checksums |
f78a1bf52fac5dc8a59ac37454978f7343e7659ad8a419dec4c881539126ac9f
|
|
BLAKE2b-256 checksum How to use checksums |
81f05b17e48ebfcbd9f8014ee76949091e640929714c29937ea3a04fde9ac488
|
| Upload date | |
|
Uploaded using Trusted Publishing? What is trusted publishing? |
No |
| Uploaded via |
twine/4.0.0 CPython/3.7.13
|
Release files / hiplot-0.1.33-py3-none-any.whl
| Download URL | hiplot-0.1.33-py3-none-any.whl |
|---|---|
| Size | 863.2 kB |
| Tags | Python 3 |
|
SHA-256 checksum How to use checksums |
82761a0e087a04d696914f4e141197e9f6ae776a590369ec9db01e26710f9f85
|
|
BLAKE2b-256 checksum How to use checksums |
aea62f37a5fc35f9889c4ab09dea62ec0f9ae304789be1dc4965d231822a3e78
|
| Upload date | |
|
Uploaded using Trusted Publishing? What is trusted publishing? |
No |
| Uploaded via |
twine/4.0.0 CPython/3.7.13
|














