A package for visualizing state transition graphs from hidden Markov models or other models.

Project description
hmmviz
A package for visualizing state transition graphs from hidden Markov models or other models.
This package is meant to serve as an out-of-the-box means of plotting small graphs (less than 10 nodes) in a customizable way.
Installation
Developed with Python 3.6
pip install hmmviz
Usage
Each graph object takes a pandas DataFrame with states indices and columns and transition probabilities (from index to column). However, these can be instantiated using different data structures such as numpy arrays, networkx graphs, etc. (help needed) via the appropriate class methods. as values.
Plotting a Transition Matrix from a Markov Process
from hmmviz import TransGraph
import pandas as pd
import matplotlib.pyplot as plt
sequence = ['sunny', 'sunny', 'rainy', 'rainy', 'sunny', 'sunny', 'sunny', 'rainy']
T = pd.crosstab(
pd.Series(sequence[:-1], name='Today'),
pd.Series(sequence[1:], name='Tomorrow'),
normalize=0
)
# Tomorrow rainy sunny
# Today
# rainy 0.5 0.5
# sunny 0.4 0.6
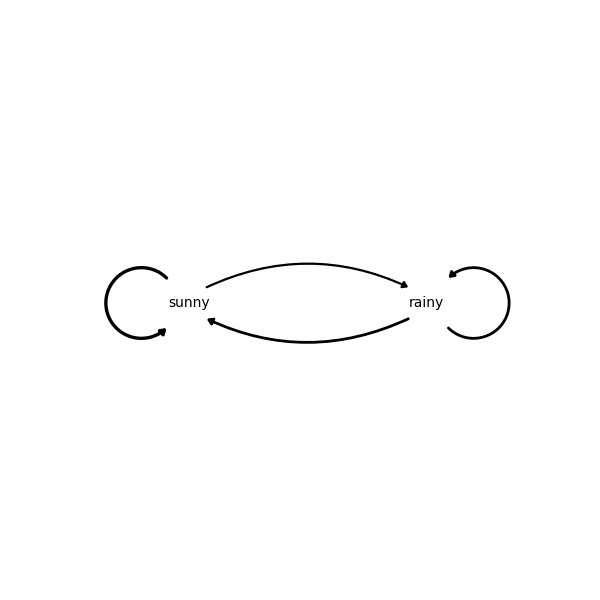
graph = TransGraph(T)
# looks best on square figures/axes
fig = plt.figure(figsize=(6, 6))
graph.draw()
plt.show()
This will make an all black graph with labels on the nodes but none on the edges.
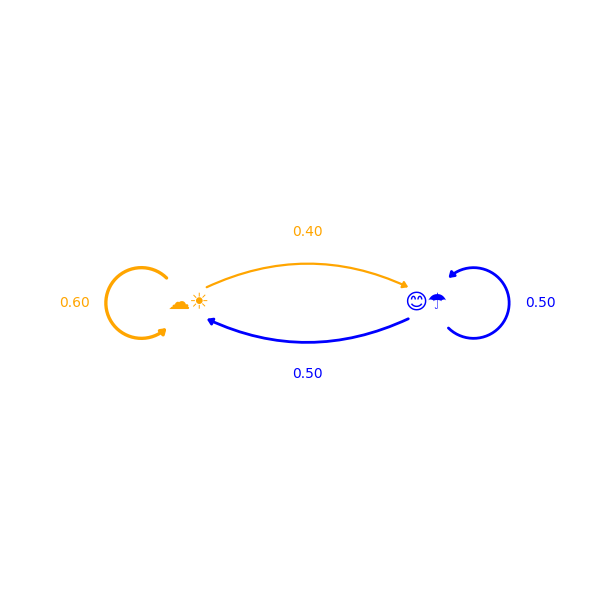
If we want to make the graph more colorful and informative we can pass some parameters into the graph's draw method.
# same T as before
graph = TransGraph(T)

fig = plt.figure(figsize=(6, 6))

nodelabels = {'sunny':  '☁☀', 'rainy': '😊☂'}
colors = {'sunny': 'orange', 'rainy': 'blue'}

graph.draw(
    nodelabels=nodelabels, nodecolors=colors, edgecolors=colors, edgelabels=True,
    nodefontsize=16,
)

plt.show()
hmmviz really shines for graphs with 4 or 5 nodes. For larger graphs consider using a package like nxviz.
import numpy as np

arr = np.ones((4, 4)) * 0.25

labels = ['s0', 's1', 's2', 's3']

graph = TransGraph.from_array(arr, labels)

colors = {f's{i}': f'C{i}' for i in range(4)}

plt.figure(figsize=(6, 6))

graph.draw(edgecolors=colors, nodecolors=colors, nodelabels=False, edgewidths=2)

plt.show()

Release history Release notifications | RSS feed


Download files
Download the file for your platform. If you're not sure which to choose, learn more about installing packages.
Source Distribution
Built Distribution
Filter files by name, interpreter, ABI, and platform.
If you're not sure about the file name format, learn more about wheel file names.
Copy a direct link to the current filters
File details
Details for the file hmmviz-0.0.7.tar.gz.
File metadata
- Download URL: hmmviz-0.0.7.tar.gz
- Upload date:
- Size: 5.4 kB
- Tags: Source
- Uploaded using Trusted Publishing? No
- Uploaded via: twine/3.1.1 pkginfo/1.5.0.1 requests/2.22.0 setuptools/42.0.2 requests-toolbelt/0.9.1 tqdm/4.41.0 CPython/3.6.9
File hashes
| Algorithm | Hash digest | |
|---|---|---|
| SHA256 |
412956b5f4838aa6d1fb8ed250e1c2e7029950b14ff44614c287d5de6ee0fdf0
|
|
| MD5 |
2dfcad361b9f0232633530a440104609
|
|
| BLAKE2b-256 |
cbfaef2229eb2c6c1d80a2e4ceae33c1dceb7ebcfa03ba323e0c47c9c8ac32c7
|
File details
Details for the file hmmviz-0.0.7-py3-none-any.whl.
File metadata
- Download URL: hmmviz-0.0.7-py3-none-any.whl
- Upload date:
- Size: 6.1 kB
- Tags: Python 3
- Uploaded using Trusted Publishing? No
- Uploaded via: twine/3.1.1 pkginfo/1.5.0.1 requests/2.22.0 setuptools/42.0.2 requests-toolbelt/0.9.1 tqdm/4.41.0 CPython/3.6.9
File hashes
| Algorithm | Hash digest | |
|---|---|---|
| SHA256 |
20ffc9f98258377d1a8c5fc39cd65b81759a29ed60bc25fdfc44a2942d53bbf0
|
|
| MD5 |
7040d129ebd22e8556538004317b6c72
|
|
| BLAKE2b-256 |
1bfc53fd497a3f68911f44fc88844efa96bbb7b55c8777e702109dd369909fc2
|


