A simple and lightweight http server to visualize measurements

Project description
plot_server
A lightweight http plot server written in python to visualize data locally. Storing only a fixed number of data points (100 per default) per measurement to keep the resources low.
| Empty plot | Selectable data |
|---|---|
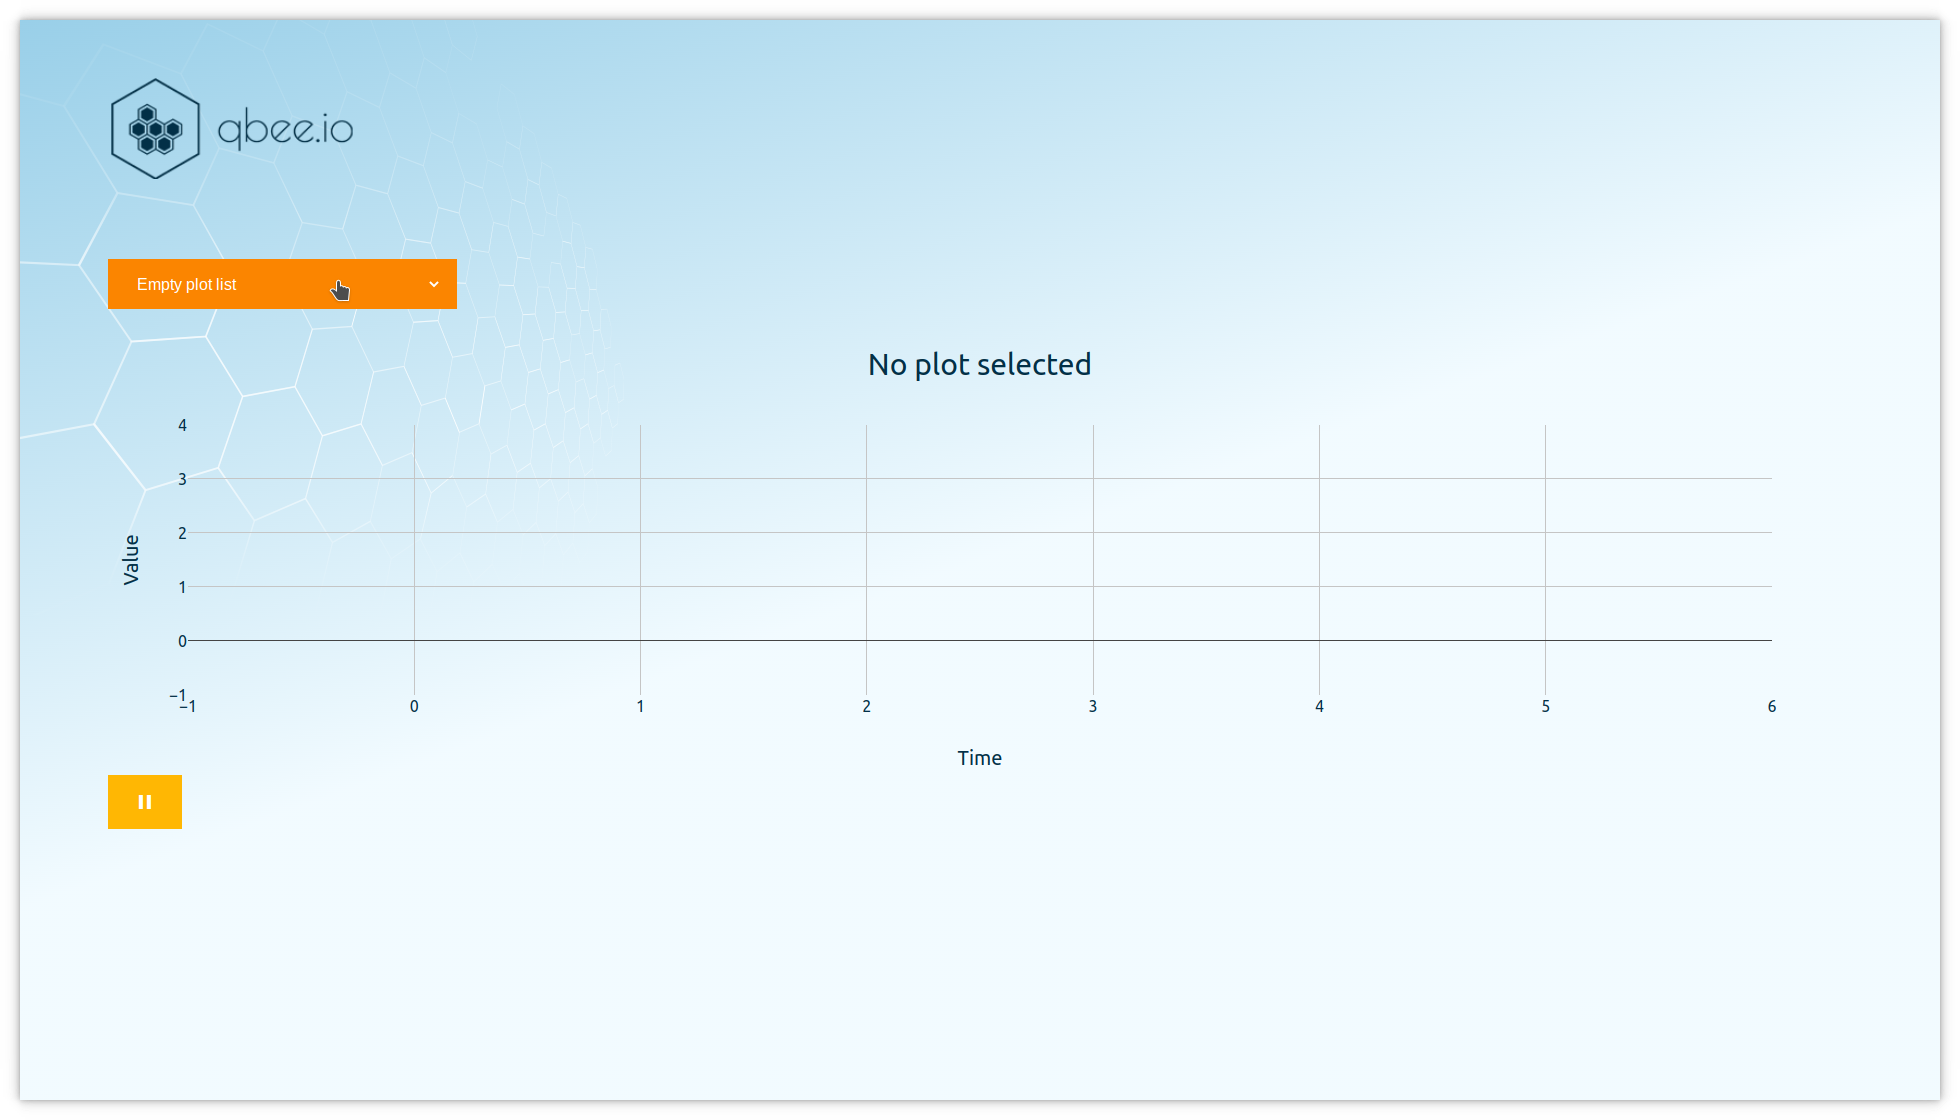 |
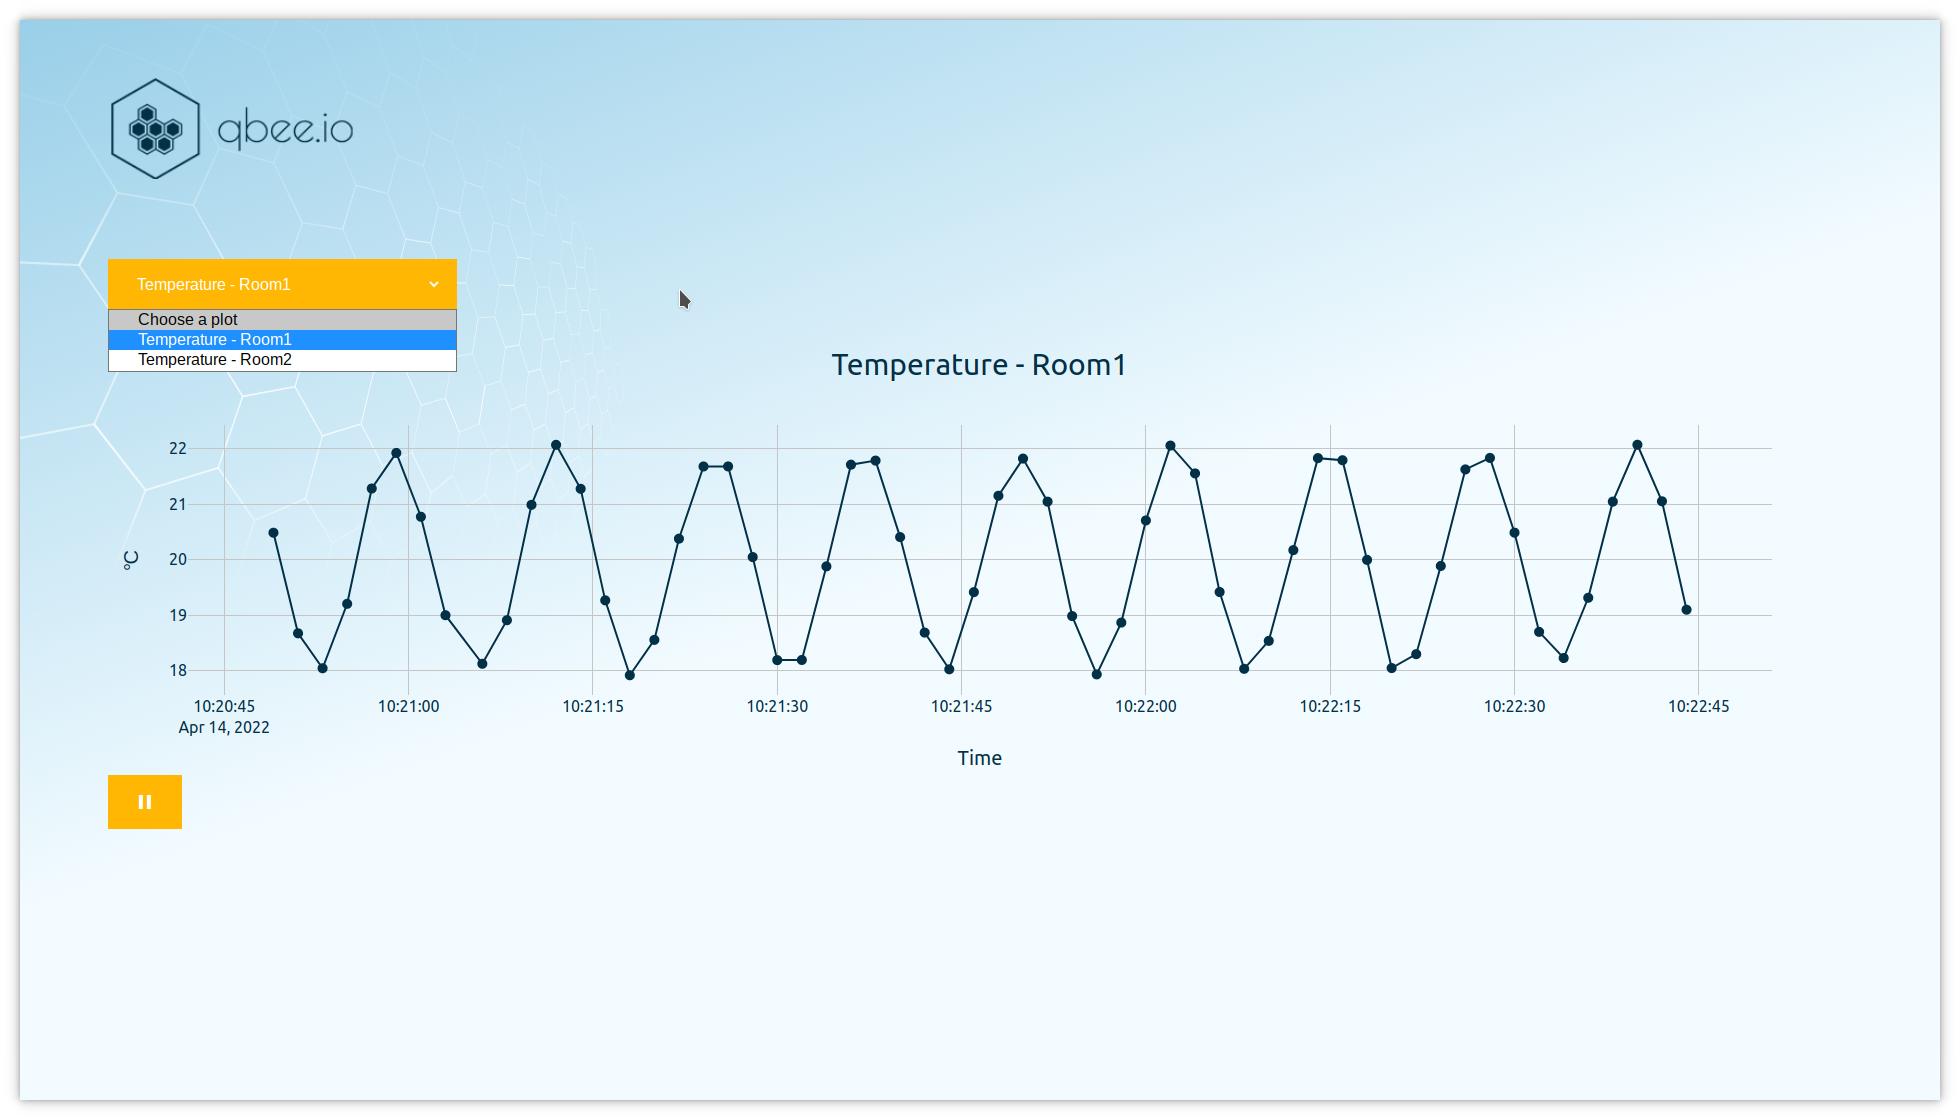 |
Quickstart
Install the package via pip
pip3 install http-plot-server
Adapt the settings in param.cfg to your needs and run
plot_server --cfg=param.cfg
or run the module as
python3 -m plot_server --cfg=param.cfg
and open your browser with the specified port, per default:
http://localhost:8080
You can also leave out the cfg flag and default values will be used.
Command line options
--host: specifies the host (default: 0.0.0.0), can belocalhostto avoid access from outside--port: specifies the port the server runs on (default: 8080)--max-points: specifies the maximum number of data points the plot server stores per measurement (default: 100)--cfg: specifies the path to a config file containing the above command line arguments (seemisc/param.cfg)
How to feed data to the plot_server
You can add data points to the plot_server by a simple http POST request including the json payload
{
    "tag": "Measurement Name",
    "value": 1234,
    "unit": "W",
    "ts": 1649859909
}
Where unit and ts are optional. If ts is not provided, then the time is used at which the post request is made. If unit is not provided, then the plot_server simply displays "Value" on the y-axis.
An example program feeding the plot_server is included in this repository and named misc/data_injector.py.
A short python snippet would look like this
import requests
data = {
    "tag": "Measurement Name",
    "value": 1234,
    "unit": "W",
    "ts": 1649859909
}
url = "http://localhost:8080"
requests.post(url,json=data)
Release history Release notifications | RSS feed

Download files
Download the file for your platform. If you're not sure which to choose, learn more about installing packages.
Source Distribution
Built Distribution
Filter files by name, interpreter, ABI, and platform.
If you're not sure about the file name format, learn more about wheel file names.
Copy a direct link to the current filters
File details
Details for the file http-plot-server-0.1.tar.gz.
File metadata
- Download URL: http-plot-server-0.1.tar.gz
- Upload date:
- Size: 9.3 kB
- Tags: Source
- Uploaded using Trusted Publishing? No
- Uploaded via: twine/4.0.0 CPython/3.8.10
File hashes
| Algorithm | Hash digest | |
|---|---|---|
| SHA256 |
99575d584145dd1576505b6e7ebc83c9fe348d748c891eb530548d9d7c702594
|
|
| MD5 |
50221bb59f5fb4e22ee0e718e1e9021a
|
|
| BLAKE2b-256 |
d2259e460075702f704fe60aa85c90e3cc0ad1a281321e1924bf6a478d7f0b2f
|
File details
Details for the file http_plot_server-0.1-py3-none-any.whl.
File metadata
- Download URL: http_plot_server-0.1-py3-none-any.whl
- Upload date:
- Size: 10.3 kB
- Tags: Python 3
- Uploaded using Trusted Publishing? No
- Uploaded via: twine/4.0.0 CPython/3.8.10
File hashes
| Algorithm | Hash digest | |
|---|---|---|
| SHA256 |
e78ce45cf14a584c2cf607b5e39653bbee174c666d8cf7b48413df841dc74d36
|
|
| MD5 |
5fae661f9e0e936179db3b2e27a36248
|
|
| BLAKE2b-256 |
1a2f15ae1f54c885f2db664daeac3107476e649555eddbcb07aa20f9a9a5d5f8
|


