Create GitHub-like visualisations

Project description
hubify
Create GitHub-like visualisations from your time series data.
Basic Usage
# A list of datetimes, where each datetime represents an observation
from datetime import datetime, timedelta
import random
# Import Hubify
from hubify import hubify
# Set a seed
random.seed(42)
# Create 400 random events
events = [
datetime.today() - timedelta(days=random.randint(0, 365))
for _ in range(400)
]
# Call hubify
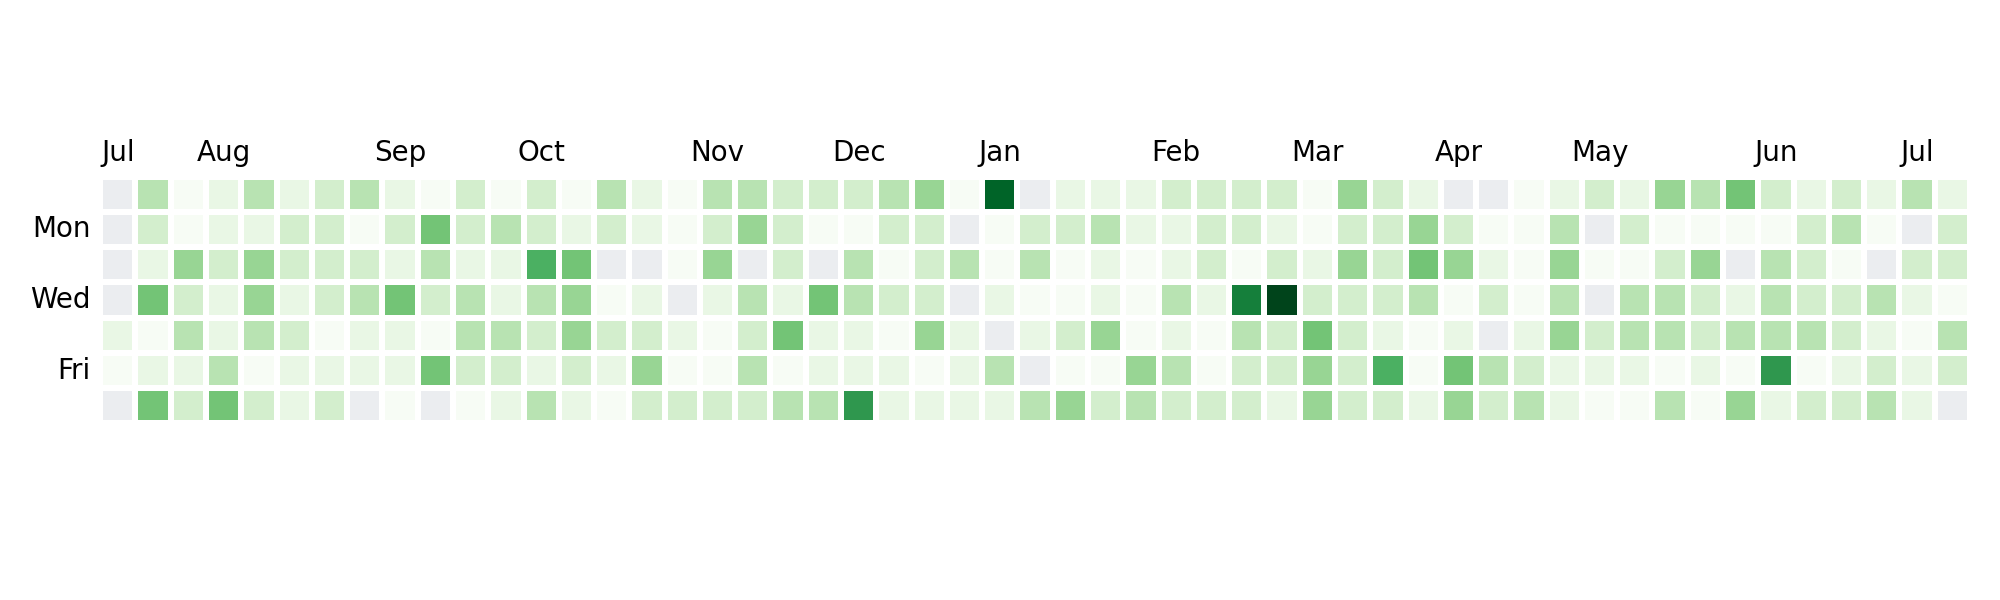
hubify(events)
You should see something like this
Installation
pip install hubify


Download files
Download the file for your platform. If you're not sure which to choose, learn more about installing packages.
Source Distribution
hubify-0.3.0.tar.gz
(4.2 kB
view details)
Built Distribution
Filter files by name, interpreter, ABI, and platform.
If you're not sure about the file name format, learn more about wheel file names.
Copy a direct link to the current filters
File details
Details for the file hubify-0.3.0.tar.gz.
File metadata
- Download URL: hubify-0.3.0.tar.gz
- Upload date:
- Size: 4.2 kB
- Tags: Source
- Uploaded using Trusted Publishing? No
- Uploaded via: poetry/1.1.13 CPython/3.7.13 Linux/5.13.0-1031-azure
File hashes
| Algorithm | Hash digest | |
|---|---|---|
| SHA256 |
fab44d8aee6100f0987b5e2664dd31545b93360ff8f475384261cca610b198f9
|
|
| MD5 |
1bbf26c2ab6c53bb10fe2c30fc86b87d
|
|
| BLAKE2b-256 |
521d27c7edc09b6fef3c91fdc980ec847c513a968b3a7dfcab5c0b50d0032ff3
|
File details
Details for the file hubify-0.3.0-py3-none-any.whl.
File metadata
- Download URL: hubify-0.3.0-py3-none-any.whl
- Upload date:
- Size: 4.6 kB
- Tags: Python 3
- Uploaded using Trusted Publishing? No
- Uploaded via: poetry/1.1.13 CPython/3.7.13 Linux/5.13.0-1031-azure
File hashes
| Algorithm | Hash digest | |
|---|---|---|
| SHA256 |
1d823c8c9a887f81bc5ca57f56b04dee87b584b0b914d6a5d600685654161ea7
|
|
| MD5 |
fe3e7356bd135718a191c8515b362199
|
|
| BLAKE2b-256 |
e4779f960076e43432717b0f1fba4aeaea2134c1c5af573576d9809e79ec262f
|


